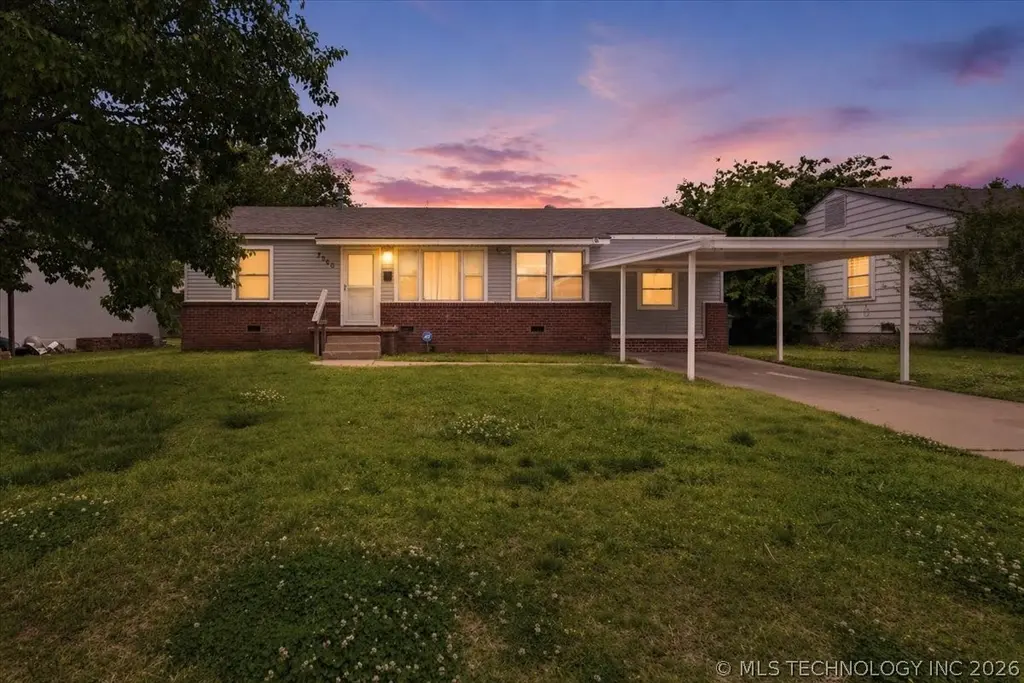
7360 E Newton St · Tulsa, OK
Flood risk 1/10 · Minimal
- FEMA flood zone
- X (unshaded)
- Chance of flooding over 30 yrs
- 0.0%
- Est. flood insurance / yr
- $507 – $1,088
Fire risk 3/10 · Minor
- Est. fire insurance / yr
- $2,463 – $4,575
Heat risk 6/10 · Moderate
- Hot days now (above 110°F)
- 7 days/yr
- Hot days in 30 yrs
- 18 days/yr
Wind risk 2/10 · Minimal
- Chance of severe wind over 30 yrs
- 4.0%
Air-quality risk 3/10 · Minor
- Unhealthy air days now
- 2 days/yr
- Unhealthy air days in 30 yrs
- 3 days/yr
Risk factors via First Street. Map © Google.
Why this score? — see what drove the D- grade
The composite is a weighted blend of 9 inputs, each scored 0–100. Each bar is that input's sub-score; the figure is the points it added to the 100-point composite (weight × sub-score).
- Cash flow +16.4/30.0
- DSCR +5.1/10.0
- 1% rule +4.3/10.0
- Livability +3.8/5.0
- Rent growth +3.6/5.0
- Condition / age +2.5/5.0
- ARV discount +1.1/15.0
- Schools +0.8/10.0
- Appreciation +0.0/10.0
$146,900
🖨 Deal sheet (PDF) 📄 Offer letter ✓ Due diligence
Listing remarks MLS
Newly Remodeled and Move-In Ready! This 3 Bed/1 Bath Home Has Many NEW Upgrades in 2017: Roof, Plumbing, Flooring, Interior Paint, Fixtures, and a Complete Bathroom Remodel! Office Could Be 4th Bedroom. Centrally located. MUST SEE–Won't Last Long!
Key facts
- Central hvac
- Access to highways
- Carport
Tags
Property features AI
Exterior
- Security: No safety shelter
- Utilities: Electricity available; Natural gas available; Public water; Public sewer
- Home design: Single-story home; Faces north; Crawlspace foundation
- Construction: Brick, block and vinyl siding construction; Asphalt/fiberglass roof
- Exterior features: Chain link fence; No other exterior features specified
Interior
- Kitchen: Dishwasher; Oven; Range / Stove; Refrigerator
- Flooring: Carpet; Tile
- Bathrooms: 1 full bathroom
- Heating & cooling: Central heating (gas); Central air conditioning
- Interior features: Wood window frames; Laminate countertops; Gas range and gas oven connections
- Laundry & utility: Electric dryer hookup
Neighborhood map
What this means for you Summary
Snapshot
- This is a 3-bed/1.0-bath single-family listed at $147k.
Deal economics
- At list price, monthly cash flow is $83 ($996/yr) — positive.
- The deal already cash-flows at list — no discount required.
- To meet the 1% rule (rent ≥ 1% of price), the offer needs to be $136k (7.4% below list).
- Recommended offer: $136k (7.4% below list) — sets the bar for 1% rule.
- Cap rate 7.0% vs local median 3.8% in Tulsa — top-decile yield for the area; either an underpriced asset or a hidden risk that comps aren't pricing in. Stress-test before assuming the spread holds.
Location & tenants
- Location reads 75/100 on livability (#13 in OK, #4,058 nationally) — a middle-class / working-renter tenant base. Strengths: amenities A+, commute A+, cost of living A+; Watch: crime F, employment D-.
- Tulsa (urban): math 7% / reading 12% proficiency, ranked #250 of 270 in OK (top 93%) — low school quality limits family demand, transient renter base, plan for 1-2y turnover; 76% free/reduced lunch — lower-income household profile, screen leases tightly.
- Zoned schools: Project Accept Traice Es (math 10% / reading 10%, grade F, #695 of 845 statewide, top 84%, 558 students, 0% FRL); Monroe Demonstration Ms (math 0% / reading 2%, grade F, #344 of 345 statewide, top 100%, 688 students, 0% FRL); Booker T. Washington Hs (math 41% / reading 61%, grade D+, #2 of 447 statewide, top 0%, 1,280 students, 0% FRL) — zoned schools average 0% FRL vs 76% district-wide (76 pts lower); this property's tenant base skews higher-income than the district average.
- Market conditions: Rents rising fast (+4.6%/yr); 89 active listings in the ZIP; 1 comparable units currently listed for rent nearby; lower-income renter base — watch delinquency; 2,818 units permitted in Tulsa County in 2024 (518 in 5+ unit buildings).
- This rent runs 37% of the median local income ($45k/yr) — at the standard rent-burdened threshold; future hikes will face affordability resistance.
Forward outlook
- Local home prices are declining (-3.0%/yr); year-one equity from $1k of loan paydown is wiped out by about $4k of value loss. Plan a longer hold.
- Tulsa County population projected at +30% by 2050 — long-run rental-demand tailwind backs the buy-and-hold thesis.
Negotiation context
- It's been on market 20 days — a 2% lower offer ($145k) is reasonable based on typical stale-listing flexibility.
- 7 sale attempts since 28y ago with the ask held roughly flat each time — persistent listings suggest the price (not the market) is what's stuck; bring a comps-based counter.
- Current owner paid $118k; 24% above their basis — modest negotiation headroom, anchor on the comps not their cost.
Risks & watch-outs
- Watch-outs: built in 1953 — expect roof / HVAC / electrical / plumbing capex.
- Climate carrying-cost: extreme-heat days projected 7→18/yr by 2055 (HVAC capex compounding) — expect insurance premiums to compound above CPI over the hold.
Questions for the listing agent
- Built in 1953 — when were the roof, HVAC, electrical panel, plumbing, and water heater last replaced?
- Is there a deadline driving the sale (1031 exchange, divorce, estate, relocation)? That informs how much negotiation room exists.
- Schools are F-rated, which usually means shorter tenancies and higher turnover. Who's the typical renter profile here, and what's been the actual vacancy rate?
- Crime grade is F in this area — have there been break-ins, vandalism, or insurance claims at this property in the last 3 years? What carrier currently insures it and at what premium?
- The area grade is low — what's the realistic commute time and amenity access for the typical tenant pool here? Any planned neighborhood developments (good or bad) we should know about?
- What's the average days-on-market for RENTAL listings here right now (not sales)? A rising rental-DOM trend means longer vacancies and softer asking-rent achievability than the comps imply.
- What's the recent tenant-quality profile in this submarket — average credit score on applications, eviction rate, late-payment / NSF rate, and stable-employment percentage? A property-management company in the area should have these aggregated.
- How much new for-sale + rental construction is in the pipeline within 1–3 miles? Heavy new supply typically softens prices + rents 12–24 months out; constrained supply supports both.
Investment metrics
- 1% rule
- 0.93% ✗
- Cap rate
- 6.97%
- Cash-on-cash
- 2.42%
- DSCR
- 1.11
- GRM
- 9.0
CMA / ARV
- ARV (on-the-fly)
- $128,592
- Comps found
- 12
Show comp detail 12 sales within ~0.75 mi
| Address | Dist | Beds/Ba | Sqft | Sold | Price | $/sf | Match |
|---|---|---|---|---|---|---|---|
| 6840 E King St | 0.43mi | 3/1.0 | 1,173 (+4%) | 4mo | $148,000 | $126 | 70 |
| 1365 N 76th EastAvenue | 0.18mi | 2/1.0 (-1) | 1,024 (-9%) | 1mo | $145,000 | $142 | 70 |
| 7842 E Latimer Pl | 0.29mi | 3/1.0 | 1,014 (-10%) | 2mo | $115,000 | $113 | 68 |
| 1044 N 77th EastAvenue | 0.18mi | 4/1.0 (+1) | 1,248 (+11%) | 2mo | $97,000 | $78 | 68 |
| 6837 E King Pl | 0.38mi | 4/2.0 (+1) | 1,093 (-3%) | 3mo | $175,000 | $160 | 65 |
| 1368 N 77th East Ave | 0.23mi | 2/1.0 (-1) | 1,022 (-9%) | 5mo | $81,000 | $79 | 64 |
| 7138 E King Pl | 0.29mi | 3/1.0 | 996 (-12%) | 4mo | $159,900 | $161 | 64 |
| 6614 E Reading St | 0.72mi | 3/1.0 | 1,136 (+1%) | 3mo | $129,900 | $114 | 63 |
| 1532 N 68th EastAvenue | 0.61mi | 2/1.0 (-1) | 1,146 (+2%) | 2mo | $74,000 | $65 | 62 |
| 806 N 78th EastAvenue | 0.39mi | 3/2.0 | 1,225 (+9%) | 4mo | $240,000 | $196 | 60 |
| 6710 E Independence Pl | 0.61mi | 4/1.0 (+1) | 1,212 (+7%) | 2mo | $138,000 | $114 | 52 |
| 512 N 78th East Ave | 0.67mi | 3/2.0 | 1,296 (+15%) | 4mo | $135,000 | $104 | 36 |
Match score weights: distance 35% · size 25% · config 20% · recency 20%. Top-matched comps best support the ARV.
Projected returns pro-forma
-3.0% appreciation · 4.57% rent growth · sell at horizon
- IRR
- -10.7%
- Equity multiple
- 0.60×
- Total profit
- $-16,330
- Equity at exit
- $21,903
- IRR
- 0.6%
- Equity multiple
- 1.05×
- Total profit
- $1,856
- Equity at exit
- $12,701
Cash invested: $41,132 (down + closing). Projections, not guarantees.
Landlord ↔ Tenant lean methodology
- Overall (STATE)
- 83 Strongly Landlord-Friendly
- State Oklahoma
- 83 Strongly Landlord-Friendly · R+20
- County
- — inherits STATE
- City
- — inherits STATE
ZIP-level market 74115
- Home prices YoY
- -9.7%
- Rents YoY
- 4.6%
- Active inventory
- 89
- Price-to-rent
- 9.0×
Monthly cashflow live
- Estimated rent
- $1,360 medium interval (Pro) →
- Mortgage (P&I)
- −$770
- Tax from tax record
- −$160 /mo · $1,918/yr
- Insurance
- −$61
- HOA
- −$0
- Vacancy / Maint / Mgmt
- −$286
- Net cashflow
- $83
Break-even live
Sensitivity live
| Price | -10% $166 | -5% $125 | +0% $83 | +5% $41 | +10% $0 |
|---|---|---|---|---|---|
| Rent | -10% $-24 | -5% $29 | +0% $83 | +5% $137 | +10% $190 |
| Rate | -1.0pp $157 | -0.5pp $120 | base $83 | +0.5pp $45 | +1.0pp $6 |
UW: 25.0% down · 7.5% · 30yr · 1.5% tax · 5.0% vac · 8.0% maint · 8.0% mgmt
Financing live
Cash to close
- Down payment
- $36,725
- Closing costs
- $4,407
- Reserves months
- —
- Total cash needed
- —
Loan-product check · same deal, 3 products live
Conventional
25% down · 7.5% · 30yr
- Down + closing
- —
- Monthly P&I
- —
- Monthly cashflow
- —
- DSCR
- —
- Eligible?
- —
Personal DTI + credit; lowest rate.
DSCR
20% down · 8.5% · 30yr
- Down + closing
- —
- Monthly P&I
- —
- Monthly cashflow
- —
- DSCR
- —
- Eligible?
- —
No personal income docs; deal must DSCR.
Hard money
10% down · 12.0% · 12mo
- Down + closing
- —
- Monthly P&I
- —
- Monthly cashflow
- —
- DSCR
- —
- Eligible?
- —
Short-term bridge; refi at stabilization.
Rent comps 1 comps
| Address | Beds | Baths | Sqft | Rent | $/sqft | DOM | Units | Dist |
|---|---|---|---|---|---|---|---|---|
| 1404 N Kingston Ave Tulsa, OK | 4.0 | 1.0 | 1279 | $1,350 | $1.06 | 25d | 1 | 1.03mi |
Listing history 23 events
-
2026-05-22price $146,900
-
2026-05-08$150,000 Active
-
2022-09-27soldstatus $118,000
-
2018-04-26soldstatus $65,000
-
2018-04-20soldstatus $65,000 Closed 253-char remark
Show marketing remark (253 chars)
Newly Remodeled and Move-In Ready! This 3 Bed/1 Bath Home Has Many NEW Upgrades in 2017: Roof, Plumbing, Flooring, Interior Paint, Fixtures, and a Complete Bathroom Remodel! Office Could Be 4th Bedroom. Centrally located. MUST SEE–Won't Last Long!
-
2018-03-09status Pending 253-char remark
Show marketing remark (253 chars)
Newly Remodeled and Move-In Ready! This 3 Bed/1 Bath Home Has Many NEW Upgrades in 2017: Roof, Plumbing, Flooring, Interior Paint, Fixtures, and a Complete Bathroom Remodel! Office Could Be 4th Bedroom. Centrally located. MUST SEE–Won't Last Long!
-
2018-02-10price $69,500 253-char remark
Show marketing remark (253 chars)
Newly Remodeled and Move-In Ready! This 3 Bed/1 Bath Home Has Many NEW Upgrades in 2017: Roof, Plumbing, Flooring, Interior Paint, Fixtures, and a Complete Bathroom Remodel! Office Could Be 4th Bedroom. Centrally located. MUST SEE–Won't Last Long!
-
2018-01-21price $69,900 253-char remark
Show marketing remark (253 chars)
Newly Remodeled and Move-In Ready! This 3 Bed/1 Bath Home Has Many NEW Upgrades in 2017: Roof, Plumbing, Flooring, Interior Paint, Fixtures, and a Complete Bathroom Remodel! Office Could Be 4th Bedroom. Centrally located. MUST SEE–Won't Last Long!
-
2018-01-01$74,900 Active 253-char remark
Show marketing remark (253 chars)
Newly Remodeled and Move-In Ready! This 3 Bed/1 Bath Home Has Many NEW Upgrades in 2017: Roof, Plumbing, Flooring, Interior Paint, Fixtures, and a Complete Bathroom Remodel! Office Could Be 4th Bedroom. Centrally located. MUST SEE–Won't Last Long!
-
2008-08-14soldstatus $65,000
-
2007-06-08soldstatus $50,000 77-char remark
Show marketing remark (77 chars)
Nice house with recent updates. Could be considered move-in ready. Sold As-Is
-
2007-04-27historical 77-char remark
Show marketing remark (77 chars)
Nice house with recent updates. Could be considered move-in ready. Sold As-Is
-
2007-04-13$55,000 77-char remark
Show marketing remark (77 chars)
Nice house with recent updates. Could be considered move-in ready. Sold As-Is
-
2005-11-15historical
-
2005-10-05$99,500
-
1999-04-29soldstatus $47,500
-
1999-04-23soldstatus $47,500
-
1999-03-08historical
-
1999-03-06$48,000
-
1999-02-28historical
-
1998-10-29historical
-
1998-08-31$48,000
-
1998-05-29$49,500
ⓘ Source: listings_history table (triggers on properties + properties_extension) + one-shot
backfill from property_details.listing_events for pre-trigger history.
Tax reassessment forecast OK · Resets to sale price
- Current annual tax
- $1,918 · $160/mo
- Projected year-2 tax
- $1,918 · $160/mo
- Expected delta
- $0/yr ($0/mo · 0.0%)
ⓘ Screening estimate from a state-policy table — verify with the county assessor before closing.
Climate risk First Street
- Flood 1/10 Low FEMA zone X (unshaded) · 0% chance over 30 yrs
- Wildfire 3/10 Moderate
- Heat 6/10 Major 7 d/yr ≥110°F today · 18 d/yr by 30 yrs out
- Wind 2/10 Low 4% chance of damaging wind over 30 yrs
- Air quality 3/10 Moderate 2 unhealthy d/yr today · 3 by 30 yrs out
Nearby sold comps map
Loading sold comps map…
Walkable amenities ~0.75 mi
Loading nearby amenities…
Taxation est. · year 1
- Rental income
- $16,320
- − Mortgage interest
- −$8,229
- − Property taxes
- −$1,918
- − Insurance
- −$734
- − Repairs & maintenance
- −$1,306
- − Management
- −$1,306
- − Depreciation
- −$4,273
- Taxable loss
- −$1,446
- Est. tax savings @ 24.0%
- +$347
- After-tax cash flow
- $1,343/yr
For passive investors: Depreciation is non-cash, so a rental often shows a tax loss while cash-flowing — sheltering income. Rental losses are passive: they offset passive income freely, and up to $25,000/yr can offset ordinary (W-2) income if you actively participate and your MAGI is under $100k (phasing out to $0 by $150k); unused losses carry forward. On sale, claimed depreciation is recaptured at up to 25%, and gains may owe capital-gains tax (a 1031 exchange can defer both). Figures are a year-1 estimate at your 24.0% rate — not tax advice; consult a CPA.
Schools (NCES district)
- District
- Tulsa
- NCES district ID
- 4030240
- Math proficiency
- 7% ▼ -9.00%
- Reading proficiency
- 12% ▼ -7.00%
- Median HH income
- $37,895
- Composite
- 8.04/100
- National rank
- #9919
- State rank
- #250 of 270 in OK
Livability — Tulsa
- Score
- 75/100
- State rank
- #13
- US rank
- #4058
Category grades
Schools grade is shown separately in the Schools card above.
Census & demographics
- Census place
- Tulsa, OK
- County
- Tulsa County · 640,811 people
- City population
- 389,418
- Metro
- Tulsa, OK
- Population (ZIP)
- 24,297
- Household income
- $44,608
- Rent vs Own
- Severe rent burden
- 805.0
Population outlook (Tulsa County) Hauer SSP2
- Today (2025)
- 723,846 people
- By 2030
- 766,033 · +5.8%
- By 2040
- 851,386 · +17.6%
- By 2050
- 938,389 · +29.6%
- By 2075
- 1,166,011 · +61.1%
- By 2100
- 1,350,277 · +86.5%
Race, ethnicity, and origin ACS 2023
- Neighborhood character
- Diverse neighborhood (Simpson 0.68)
- Race & ethnicity
- Hispanic / Latino 44% White 33% Two or more races 19% Black 13% Native American 5%
- Hispanic origin (detail)
- Mexican 39%
- Common ancestry
- Italian 1% Slovak 1% Lithuanian 1%
- Foreign-born
- 19% · Canada
- Languages at home
- 57% English-only · Spanish 42%
Political lean MEDSL · Tulsa
- 2024 margin
- R (+15.2) · D 41.3% · R 56.5% · Other 2.2%
- 2008→2024 swing
- +9.2pp toward D · 2008: -24.5pp · 2024: -15.2pp
- All cycles
- 2024: R+15.2 2020: R+15.6 2016: R+22.9 2012: R+27.4 2008: R+24.5
Not yet ingested
- Civics
- —
Market trends
- HPI YoY
- ▼ -26.82%
- Current HPI
- 251.0869
- Rent YoY
- ▲ 4.57%
- Metro
- Tulsa, OK
- State GDP YoY
- ▲ 1.55%
- F500 in state
- 6
Industry mix (Fortune 500 HQ in OK)
| Industry | F500 HQs | Revenue |
|---|---|---|
| Energy | 3 | $48B |
|
||
Price history
+196.8% since first listed23 events — show timeline
- 2026-05-22 Price Changed $146,900 MLS Technology, Inc.
- 2026-05-08 Listed $150,000 MLS Technology, Inc.
- 2022-09-27 Sold (Public Records) $118,000 Public Records
- 2018-04-26 Sold (Public Records) $65,000 Public Records
- 2018-04-20 Sold (MLS) $65,000 MLS Technology, Inc.
- 2018-03-09 Pending — MLS Technology, Inc.
- 2018-02-10 Price Changed $69,500 MLS Technology, Inc.
- 2018-01-21 Price Changed $69,900 MLS Technology, Inc.
- 2018-01-01 Listed $74,900 MLS Technology, Inc.
- 2008-08-14 Sold (Public Records) $65,000 Public Records
- 2007-06-08 Sold (MLS) $50,000 MLS Technology, Inc.
- 2007-04-27 Listing Removed — MLS Technology, Inc.
- 2007-04-13 Listed $55,000 MLS Technology, Inc.
- 2005-11-15 Listing Removed — MLS Technology, Inc.
- 2005-10-05 Listed $99,500 MLS Technology, Inc.
- 1999-04-29 Sold (Public Records) $47,500 Public Records
- 1999-04-23 Sold (MLS) $47,500 MLS Technology, Inc.
- 1999-03-08 Listing Removed — MLS Technology, Inc.
- 1999-03-06 Listed $48,000 MLS Technology, Inc.
- 1999-02-28 Listing Removed — MLS Technology, Inc.
- 1998-10-29 Listing Removed — MLS Technology, Inc.
- 1998-08-31 Listed $48,000 MLS Technology, Inc.
- 1998-05-29 Listed $49,500 MLS Technology, Inc.
Property tax history
+6.6%/yrLatest (2025): $1,918 · +8.7% YoY. Source: county tax records.
Cash-flow waterfall
monthlySold comps — $/sqft
last 12 mo · ≤1 miLoading sold comps…