 Triplex
95 Eventide Rd SE · Rio Rancho, NM
Flood risk 1/10 · Minimal
- FEMA flood zone
- X (unshaded)
- Chance of flooding over 30 yrs
- 0.0%
- Est. flood insurance / yr
- $507 – $1,088
Fire risk 3/10 · Minor
- Est. fire insurance / yr
- $706 – $1,312
Heat risk 4/10 · Minor
- Hot days now (above 95°F)
- 7 days/yr
- Hot days in 30 yrs
- 18 days/yr
Wind risk 1/10 · Minimal
- Chance of severe wind over 30 yrs
- —
Air-quality risk 1/10 · Minimal
- Unhealthy air days now
- 0 days/yr
- Unhealthy air days in 30 yrs
- 0 days/yr
Risk factors via First Street. Map © Google.
Why this score? — see what drove the D grade
The composite is a weighted blend of 9 inputs, each scored 0–100. Each bar is that input's sub-score; the figure is the points it added to the 100-point composite (weight × sub-score).
- Cash flow +15.1/30.0
- Schools +5.2/10.0
- ARV discount +4.8/15.0
- DSCR +4.6/10.0
- Livability +3.6/5.0
- 1% rule +3.3/10.0
- Rent growth +3.3/5.0
- Condition / age +2.5/5.0
- Appreciation +0.0/10.0
$582,500
🖨 Deal sheet (PDF) 📄 Offer letter ✓ Due diligence
Multi-family units
County records classify this as Multi-Family (2-4 Unit). Listing-text estimate: 3 units. confirmed
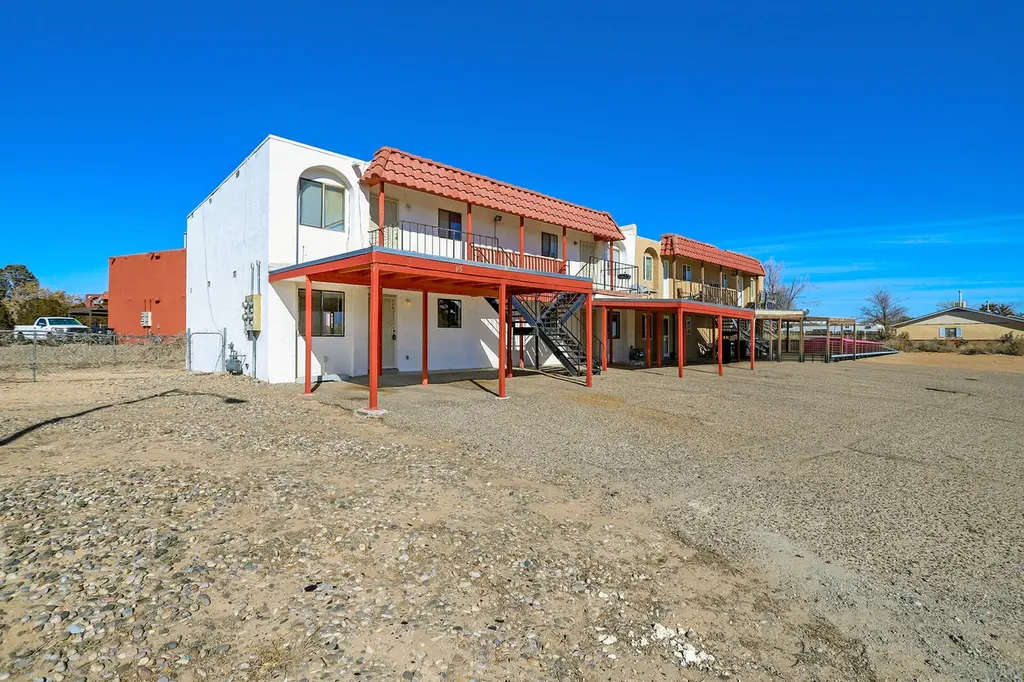
Listing remarks MLS
Amazing opportunity to invest in a highly desirable Rio Rancho four-plex. Awesome investment area with low inventory, high rental demand, and in growing community. This well maintained corner-lot property has four 2BR/1BA units. Bottom units having private backyards. Top units have private balconies with sandia views. All units have washer and dryer hookups, dishwashers, tile/vinyl floor, paint on file for easy maintenance, spacious open floor plans, and carport parking for each resident. Some units include renovated kitchens and bathrooms with tile backsplash, redone shower/counters, and tile shower surrounds. TPO roof with taper system installed in 2022, carport parking recently repainted, and touch exterior paint. High demand area when advertised for lease these unit don't last long.
Key facts
- Private balconies
- Tile vinyl floor
- Sandia views
Tags
Neighborhood map
What this means for you Summary
Snapshot
- This is a 3 × 2-bed/?-bath units multifamily listed at $582k.
Deal economics
- At list price, monthly cash flow is $191 ($2k/yr) — positive. Per door: $64/mo.
- The deal already cash-flows at list — no discount required.
- To meet the 1% rule (rent ≥ 1% of price), the offer needs to be $486k (16.6% below list).
- Recommended offer: $486k (16.6% below list) — sets the bar for 1% rule.
- Cap rate 6.7% vs local median 3.6% in Rio Rancho — top-decile yield for the area; either an underpriced asset or a hidden risk that comps aren't pricing in. Stress-test before assuming the spread holds.
Location & tenants
- Location reads 71/100 on livability (#17 in NM) — a middle-class / working-renter tenant base. Strengths: housing A+, cost of living A; Watch: amenities D, commute F.
- Rio Rancho Public Schools (suburban): math 48% / reading 73% proficiency, ranked #4 of 29 in NM (top 14%) — acceptable for families but not a draw, mixed tenant base, ~2y average lease.
- Zoned schools: Maggie Cordova Elementary School (674 students, 100% FRL); Lincoln Middle (823 students, 21% FRL); Rio Rancho High (math 52% / reading 77%, grade B-, #22 of 110 statewide, top 22%, 2,573 students, 22% FRL).
- Market conditions: Rents rising (+3.1%/yr); 837 active listings in the ZIP; solid renter incomes; 1,278 units permitted in Sandoval County in 2024 (216 in 5+ unit buildings).
- At $4,858/mo this rent would consume 67% of the median local household income ($87k/yr) (locally 1027% of renters already pay >50% of income on rent) — very limited rent-growth headroom before tenants either downsize or default.
Forward outlook
- Local home prices are declining (-3.0%/yr); year-one equity from $4k of loan paydown is wiped out by about $17k of value loss. Plan a longer hold.
- Sandoval County population projected at +15% by 2050 — long-run rental-demand tailwind backs the buy-and-hold thesis.
Negotiation context
- It's been on market 76 days — a 6% lower offer ($548k) is reasonable based on typical stale-listing flexibility.
- 3 sale attempts since 8y ago with the ask held roughly flat each time — persistent listings suggest the price (not the market) is what's stuck; bring a comps-based counter.
Questions for the listing agent
- It's been on market 76 days. Have you received any prior offers? Is the seller open to a 17% concession, seller financing, or rate buy-down credit?
- Can we see the unit-by-unit rent roll, current vacancy, and any below-market leases? What's the average tenancy length?
- What capital expenditures (roof, boiler, parking lot, exteriors) have been made in the last 5 years, and what's planned in the next 2?
- Why hasn't it sold? Are there any deal-killer items the seller is aware of (foundation, flood, title, zoning, code violations)?
- Is there a deadline driving the sale (1031 exchange, divorce, estate, relocation)? That informs how much negotiation room exists.
- The area grade is low — what's the realistic commute time and amenity access for the typical tenant pool here? Any planned neighborhood developments (good or bad) we should know about?
- What's the average days-on-market for RENTAL listings here right now (not sales)? A rising rental-DOM trend means longer vacancies and softer asking-rent achievability than the comps imply.
- What's the recent tenant-quality profile in this submarket — average credit score on applications, eviction rate, late-payment / NSF rate, and stable-employment percentage? A property-management company in the area should have these aggregated.
- How much new apartment / multifamily construction is in the pipeline within 1–3 miles? Heavy new supply (>2% of stock underway) typically softens rents 12–24 months out; light construction supports rent growth.
Investment metrics
- 1% rule
- 0.83% ✗
- Cap rate
- 6.69%
- Cash-on-cash
- 1.41%
- DSCR
- 1.06
- GRM
- 10.0
CMA / ARV
- ARV (median comp)
- $549,000
- List price
- $582,500
- Delta
- 6.10%
- Verdict
- FAIR
- Comps
- 3 within 1.0 mi
Projected returns pro-forma
-3.0% appreciation · 3.13% rent growth · sell at horizon
- IRR
- -14.0%
- Equity multiple
- 0.50×
- Total profit
- $-81,728
- Equity at exit
- $86,853
- IRR
- -5.0%
- Equity multiple
- 0.67×
- Total profit
- $-53,508
- Equity at exit
- $50,364
Cash invested: $163,100 (down + closing). Projections, not guarantees.
Landlord ↔ Tenant lean methodology
- Overall (STATE)
- 55 Moderately Landlord-Leaning
- State New Mexico
- 55 Moderately Landlord-Leaning · D+3
- County
- — inherits STATE
- City
- — inherits STATE
ZIP-level market 87124
- Rents YoY
- 3.1%
- Active inventory
- 837
- Price-to-rent
- 30.0×
Monthly cashflow live
- Estimated rent
- $4,858 high interval (Pro) →
- Mortgage (P&I)
- −$3,055
- Tax from tax record
- −$349 /mo · $4,189/yr
- Insurance
- −$243
- HOA
- −$0
- Vacancy / Maint / Mgmt
- −$1,020
- Net cashflow
- $191
Break-even live
Sensitivity live
| Price | -10% $521 | -5% $356 | +0% $191 | +5% $26 | +10% $-138 |
|---|---|---|---|---|---|
| Rent | -10% $-192 | -5% $-1 | +0% $191 | +5% $383 | +10% $575 |
| Rate | -1.0pp $485 | -0.5pp $339 | base $191 | +0.5pp $40 | +1.0pp $-113 |
3-unit breakdown (identical units grouped — click to expand)
| Units | Beds | Baths | Est. rent |
|---|---|---|---|
| 3× units | 2 | — | $4,857 |
| #1 | 2 | — | $1,619 |
| #2 | 2 | — | $1,619 |
| #3 | 2 | — | $1,619 |
| Total (3 units) | $4,858 | ||
UW: 25.0% down · 7.5% · 30yr · 1.5% tax · 5.0% vac · 8.0% maint · 8.0% mgmt
Financing live
Cash to close
- Down payment
- $145,625
- Closing costs
- $17,475
- Reserves months
- —
- Total cash needed
- —
Loan-product check · same deal, 3 products live
Conventional
25% down · 7.5% · 30yr
- Down + closing
- —
- Monthly P&I
- —
- Monthly cashflow
- —
- DSCR
- —
- Eligible?
- —
Personal DTI + credit; lowest rate.
DSCR
20% down · 8.5% · 30yr
- Down + closing
- —
- Monthly P&I
- —
- Monthly cashflow
- —
- DSCR
- —
- Eligible?
- —
No personal income docs; deal must DSCR.
Hard money
10% down · 12.0% · 12mo
- Down + closing
- —
- Monthly P&I
- —
- Monthly cashflow
- —
- DSCR
- —
- Eligible?
- —
Short-term bridge; refi at stabilization.
Listing history 29 events
-
2026-06-21days on market $582,500 Active 76 DOM
-
2026-06-18days on market $582,500 Active 73 DOM
-
2026-06-17days on market $582,500 Active 72 DOM
-
2026-06-16days on market $582,500 Active 71 DOM
-
2026-06-15days on market $582,500 Active 70 DOM
-
2026-06-13days on market $582,500 Active 68 DOM
-
2026-06-13days on market $582,500 Active 67 DOM
-
2026-06-10days on market $582,500 Active 65 DOM
-
2026-06-09days on market $582,500 Active 64 DOM
-
2026-06-08days on market $582,500 Active 63 DOM
-
2026-06-07days on market $582,500 Active 62 DOM
-
2026-06-03days on market $582,500 Active 58 DOM
-
2026-06-02days on market $582,500 Active 57 DOM
-
2026-06-01days on market $582,500 Active 56 DOM
-
2026-06-01price $582,500 Active 55 DOM
-
2026-05-31days on market $585,000 Active 55 DOM
-
2026-05-19price $585,000 797-char remark
Show marketing remark (797 chars)
Amazing opportunity to invest in a highly desirable Rio Rancho four-plex. Awesome investment area with low inventory, high rental demand, and in growing community. This well maintained corner-lot property has four 2BR/1BA units. Bottom units having private backyards. Top units have private balconies with sandia views. All units have washer and dryer hookups, dishwashers, tile/vinyl floor, paint on file for easy maintenance, spacious open floor plans, and carport parking for each resident. Some units include renovated kitchens and bathrooms with tile backsplash, redone shower/counters, and tile shower surrounds. TPO roof with taper system installed in 2022, carport parking recently repainted, and touch exterior paint. High demand area when advertised for lease these unit don't last long.
-
2026-04-28status Active 797-char remark
Show marketing remark (797 chars)
Amazing opportunity to invest in a highly desirable Rio Rancho four-plex. Awesome investment area with low inventory, high rental demand, and in growing community. This well maintained corner-lot property has four 2BR/1BA units. Bottom units having private backyards. Top units have private balconies with sandia views. All units have washer and dryer hookups, dishwashers, tile/vinyl floor, paint on file for easy maintenance, spacious open floor plans, and carport parking for each resident. Some units include renovated kitchens and bathrooms with tile backsplash, redone shower/counters, and tile shower surrounds. TPO roof with taper system installed in 2022, carport parking recently repainted, and touch exterior paint. High demand area when advertised for lease these unit don't last long.
-
2026-03-31status Pending 797-char remark
Show marketing remark (797 chars)
Amazing opportunity to invest in a highly desirable Rio Rancho four-plex. Awesome investment area with low inventory, high rental demand, and in growing community. This well maintained corner-lot property has four 2BR/1BA units. Bottom units having private backyards. Top units have private balconies with sandia views. All units have washer and dryer hookups, dishwashers, tile/vinyl floor, paint on file for easy maintenance, spacious open floor plans, and carport parking for each resident. Some units include renovated kitchens and bathrooms with tile backsplash, redone shower/counters, and tile shower surrounds. TPO roof with taper system installed in 2022, carport parking recently repainted, and touch exterior paint. High demand area when advertised for lease these unit don't last long.
-
2026-03-08$599,999 Active 797-char remark
Show marketing remark (797 chars)
Amazing opportunity to invest in a highly desirable Rio Rancho four-plex. Awesome investment area with low inventory, high rental demand, and in growing community. This well maintained corner-lot property has four 2BR/1BA units. Bottom units having private backyards. Top units have private balconies with sandia views. All units have washer and dryer hookups, dishwashers, tile/vinyl floor, paint on file for easy maintenance, spacious open floor plans, and carport parking for each resident. Some units include renovated kitchens and bathrooms with tile backsplash, redone shower/counters, and tile shower surrounds. TPO roof with taper system installed in 2022, carport parking recently repainted, and touch exterior paint. High demand area when advertised for lease these unit don't last long.
-
2023-03-08soldstatus
-
2023-03-08soldstatus
-
2019-02-22historical
-
2019-02-22soldstatus
-
2018-12-31status Pending
-
2018-10-29$225,000 Active
-
2006-03-20soldstatus
-
2006-03-20soldstatus
-
2003-09-11soldstatus
ⓘ Source: listings_history table (triggers on properties + properties_extension) + one-shot
backfill from property_details.listing_events for pre-trigger history.
Tax reassessment forecast NM · Resets to sale price
- Current annual tax
- $4,189 · $349/mo
- Projected year-2 tax
- $4,660 · $388/mo
- Expected delta
- +$471/yr (+$39/mo · 11.2%)
ⓘ Screening estimate from a state-policy table — verify with the county assessor before closing.
Climate risk First Street
- Flood 1/10 Low FEMA zone X (unshaded) · 0% chance over 30 yrs
- Wildfire 3/10 Moderate
- Heat 4/10 Moderate 7 d/yr ≥95°F today · 18 d/yr by 30 yrs out
- Wind 1/10 Low
- Air quality 1/10 Low 0 unhealthy d/yr today · 0 by 30 yrs out
Nearby sold comps map
Loading sold comps map…
Walkable amenities ~0.75 mi
Loading nearby amenities…
Taxation est. · year 1
- Rental income
- $58,296
- − Mortgage interest
- −$32,629
- − Property taxes
- −$4,189
- − Insurance
- −$2,912
- − Repairs & maintenance
- −$4,664
- − Management
- −$4,664
- − Depreciation
- −$16,945
- Taxable loss
- −$7,708
- Est. tax savings @ 24.0%
- +$1,850
- After-tax cash flow
- $4,146/yr
For passive investors: Depreciation is non-cash, so a rental often shows a tax loss while cash-flowing — sheltering income. Rental losses are passive: they offset passive income freely, and up to $25,000/yr can offset ordinary (W-2) income if you actively participate and your MAGI is under $100k (phasing out to $0 by $150k); unused losses carry forward. On sale, claimed depreciation is recaptured at up to 25%, and gains may owe capital-gains tax (a 1031 exchange can defer both). Figures are a year-1 estimate at your 24.0% rate — not tax advice; consult a CPA.
Schools (NCES district)
- District
- Rio Rancho Public Schools
- NCES district ID
- 3500010
- Math proficiency
- 48% ▲ 38.00%
- Reading proficiency
- 73% ▲ 48.00%
- Median HH income
- $59,410
- Composite
- 52.29/100
- National rank
- #1595
- State rank
- #4 of 29 in NM
Livability — Rio Rancho
- Score
- 71/100
- State rank
- #17
- US rank
- #7253
Category grades
Schools grade is shown separately in the Schools card above.
Census & demographics
- Census place
- Rio Rancho, NM
- County
- Sandoval County · 110,336 people
- City population
- 110,336
- Metro
- Albuquerque, NM
- Population (ZIP)
- 58,499
- Household income
- $86,555
- Rent vs Own
- Severe rent burden
- 1027.0
Population outlook (Sandoval County) Hauer SSP2
- Today (2025)
- 155,072 people
- By 2030
- 161,714 · +4.3%
- By 2040
- 171,831 · +10.8%
- By 2050
- 178,536 · +15.1%
- By 2075
- 192,517 · +24.1%
- By 2100
- 197,952 · +27.7%
Race, ethnicity, and origin ACS 2023
- Neighborhood character
- Diverse neighborhood (Simpson 0.61)
- Race & ethnicity
- White 47% Hispanic / Latino 41% Two or more races 18% Native American 5% Black 3% Asian 2%
- Hispanic origin (detail)
- Mexican 24% Puerto Rican 2%
- Common ancestry
- Lithuanian 3% Slovak 2% Italian 2%
- Foreign-born
- 6% · Canada, Vietnam, China
- Languages at home
- 84% English-only · Spanish 12% Vietnamese 1%
Political lean MEDSL · Sandoval
- 2024 margin
- Lean D (+5.8) · D 51.8% · R 46.0% · Other 2.2%
- 2008→2024 swing
- -7.0pp toward R · 2008: 12.8pp · 2024: 5.8pp
- All cycles
- 2024: D+5.8 2020: D+8.4 2016: D+2.7 2012: D+5.1 2008: D+12.8
Not yet ingested
- Civics
- —
Market trends
- HPI YoY
- ▼ -303.50%
- Current HPI
- 219.8377
- Rent YoY
- ▲ 3.13%
- Metro
- Albuquerque, NM
- State GDP YoY
- —
- F500 in state
- 0
Price history
+160.0% since first listed13 events — show timeline
- 2026-05-19 Price Changed $585,000 Southwest MLS
- 2026-04-28 Relisted — Southwest MLS
- 2026-03-31 Pending — Southwest MLS
- 2026-03-08 Listed $599,999 Southwest MLS
- 2023-03-08 Sold (Public Records) — Public Records
- 2023-03-08 Sold (Public Records) — Public Records
- 2019-02-22 Delisted — Southwest MLS
- 2019-02-22 Sold (Public Records) — Public Records
- 2018-12-31 Pending — Southwest MLS
- 2018-10-29 Listed $225,000 Southwest MLS
- 2006-03-20 Sold (Public Records) — Public Records
- 2006-03-20 Sold (Public Records) — Public Records
- 2003-09-11 Sold (Public Records) — Public Records
Property tax history
+6.0%/yrLatest (2024): $4,189 · +67.0% YoY. Source: county tax records.
Cash-flow waterfall
monthlySold comps — $/sqft
last 12 mo · ≤1 miLoading sold comps…