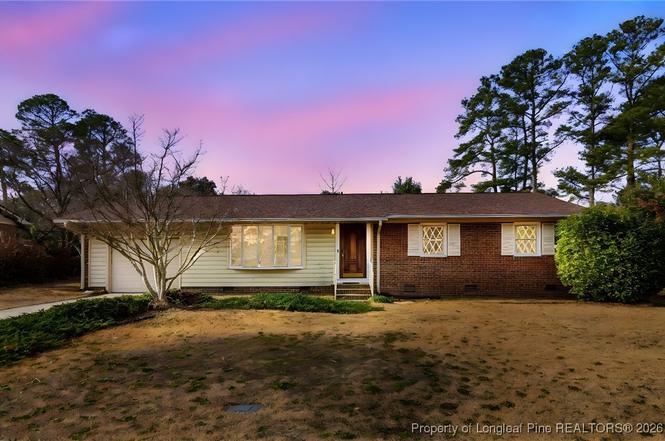
1438 Berriedale Dr · Fayetteville, NC
Flood risk 1/10 · Minimal
- FEMA flood zone
- X (unshaded)
- Chance of flooding over 30 yrs
- 0.0%
- Est. flood insurance / yr
- $473 – $860
Fire risk 4/10 · Minor
- Est. fire insurance / yr
- $906 – $1,684
Heat risk 7/10 · Major
- Hot days now (above 107°F)
- 7 days/yr
- Hot days in 30 yrs
- 16 days/yr
Wind risk 7/10 · Major
- Chance of severe wind over 30 yrs
- 78.0%
Air-quality risk 1/10 · Minimal
- Unhealthy air days now
- 0 days/yr
- Unhealthy air days in 30 yrs
- 0 days/yr
Risk factors via First Street. Map © Google.
Why this score? — see what drove the F grade
The composite is a weighted blend of 9 inputs, each scored 0–100. Each bar is that input's sub-score; the figure is the points it added to the 100-point composite (weight × sub-score).
- Cash flow +7.2/30.0
- ARV discount +4.4/15.0
- Livability +3.8/5.0
- Rent growth +3.3/5.0
- Schools +3.1/10.0
- Condition / age +2.5/5.0
- 1% rule +1.8/10.0
- DSCR +1.4/10.0
- Appreciation +0.0/10.0
$220,000
🖨 Deal sheet 📄 Offer letter ✓ Due diligence
Listing remarks
Some repairs in the process! Welcome to this 4-bedroom, 2.5-bath home offering plenty of room to live and entertain. Enjoy both a cozy den with fireplace and a separate living room, providing flexible space for relaxation or hosting guests. The home features two primary bedrooms, perfect for multi-generational living or added privacy, kitchen/dining combo. Den opens to the fenced backyard, complete with a stone patio area ideal for outdoor gatherings. A storage building offers extra room for tools, hobbies, or seasonal items.
Key facts
- Garage
- Built 1966
- Listed 189 days
Property features AI
Finance
- Other: Listed by Longleaf Pine Realtors / COMPLETE CONCEPT REALTY
Exterior
- Parking: Attached garage (1 covered space, 1 garage space)
- Utilities: Public water; Public sewer
- Home design: Single Family Residence; One-level (1 story); Subdivision: ARRAN HILLS; Zoned SF10 (Single Family Res 10)
- Construction: Brick veneer and cement siding; One story construction
- Exterior features: Patio; Back yard fencing; Shed(s)
Interior
- Kitchen: Refrigerator; Disposal
- Bedrooms: Total rooms: 8
- Flooring: Carpet; Hardwood; Laminate; Tile
- Bathrooms: 2 full bathrooms; 1 half bathroom
- Heating & cooling: Natural gas heating; Central air conditioning; Ceiling fans for cooling
- Interior features: Ceiling fans; Eat-in kitchen; Storage; Masonry fireplace
- Laundry & utility: Laundry located in garage; Crawl space basement
Neighborhood map
What this means for you Summary
Snapshot
- This is a 3-bed/2.0-bath single-family listed at $220k.
Deal economics
- At list price, monthly cash flow is $-301 ($-4k/yr) — negative.
- To cash-flow at today's rent, offer at most $167k (24.1% below list).
- To meet the 1% rule (rent ≥ 1% of price), the offer needs to be $149k (32.3% below list).
- Recommended offer: $149k (32.3% below list) — sets the bar for 1% rule.
Location & tenants
- Location reads 75/100 on livability (#45 in NC, #4,031 nationally) — a middle-class / working-renter tenant base. Strengths: commute A+, cost of living A+, housing A+; Watch: crime F, employment D-.
- Cumberland County Schools (urban): math 32% / reading 41% proficiency, ranked #126 of 178 in NC (top 71%) — families likely to look elsewhere, expect single-tenant / working-renter base with shorter leases.
- Zoned schools: Lewis Chapel Middle (math 15% / reading 27%, grade F, #424 of 475 statewide, top 90%, 578 students, 100% FRL); Seventy-First High (math 45% / reading 44%, grade F, #352 of 535 statewide, top 68%, 1,366 students, 70% FRL) — zoned schools average 85% FRL vs 55% district-wide (30 pts higher); higher-poverty schools than district average — tighter screening recommended.
- Market conditions: Rents rising (+3.2%/yr); 302 active listings in the ZIP; 40 comparable units currently listed for rent nearby; rentals at typical pace (median 23d on market — plan ~3-4 weeks tenant-placement turnaround); 1,125 units permitted in Cumberland County in 2024 (104 in 5+ unit buildings).
- This rent runs 31% of the median local income ($59k/yr) — at the standard rent-burdened threshold; future hikes will face affordability resistance.
Forward outlook
- Local home prices are declining (-3.0%/yr); year-one equity from $2k of loan paydown is wiped out by about $7k of value loss. Plan a longer hold.
Negotiation context
- It's been on market 190 days — a 12% lower offer ($194k) is reasonable based on typical stale-listing flexibility.
- 11 sale attempts since 8y ago; this cycle's ask is 12260% above the opening price — seller raised mid-cycle; expect resistance to lowballs.
- Current owner paid $145k; list at $220k implies a 52% gain — meaningful room to come down on a strong offer.
Risks & watch-outs
- Climate carrying-cost: major wind risk, 78% chance of damaging wind over 30y; extreme-heat days projected 7→16/yr by 2055 (HVAC capex compounding) — expect insurance premiums to compound above CPI over the hold.
Questions for the listing agent
- What do current leases actually rent for vs. the listed asking? Can we see a recent rent roll and the last 12 months of T-12 income?
- It's been on market 190 days. Have you received any prior offers? Is the seller open to a 32% concession, seller financing, or rate buy-down credit?
- Built in 1966 — when were the roof, HVAC, electrical panel, plumbing, and water heater last replaced?
- Why hasn't it sold? Are there any deal-killer items the seller is aware of (foundation, flood, title, zoning, code violations)?
- Is there a deadline driving the sale (1031 exchange, divorce, estate, relocation)? That informs how much negotiation room exists.
- Crime grade is F in this area — have there been break-ins, vandalism, or insurance claims at this property in the last 3 years? What carrier currently insures it and at what premium?
- The area grade is low — what's the realistic commute time and amenity access for the typical tenant pool here? Any planned neighborhood developments (good or bad) we should know about?
- What's the average days-on-market for RENTAL listings here right now (not sales)? A rising rental-DOM trend means longer vacancies and softer asking-rent achievability than the comps imply.
- What's the recent tenant-quality profile in this submarket — average credit score on applications, eviction rate, late-payment / NSF rate, and stable-employment percentage? A property-management company in the area should have these aggregated.
- How much new for-sale + rental construction is in the pipeline within 1–3 miles? Heavy new supply typically softens prices + rents 12–24 months out; constrained supply supports both.
Investment metrics
- 1% rule
- 0.68% ✗
- Cap rate
- 4.65%
- Cash-on-cash
- -5.85%
- DSCR
- 0.74
- GRM
- 12.3
CMA / ARV
- ARV (on-the-fly)
- $205,800
- Comps found
- 12
Show comp detail 12 sales within ~0.75 mi
| Address | Dist | Beds/Ba | Sqft | Sold | Price | $/sf | Match |
|---|---|---|---|---|---|---|---|
| 1310 Bingham Dr | 0.31mi | 3/2.0 | 1,382 (+1%) | 3mo | $160,000 | $116 | 82 |
| 6343 Pawling Ct | 0.42mi | 3/2.0 | 1,342 (-2%) | 3mo | $230,000 | $171 | 74 |
| 1520 Berriedale Dr | 0.30mi | 3/2.0 | 1,459 (+6%) | 4mo | $260,000 | $178 | 72 |
| 1109 Strickland Bridge Rd | 0.41mi | 3/1.5 | 1,326 (-3%) | 2mo | $199,000 | $150 | 72 |
| 6408 Barwick Dr | 0.28mi | 4/2.0 (+1) | 1,456 (+6%) | 3mo | $207,000 | $142 | 69 |
| 1066 Strickland Bridge Rd | 0.47mi | 3/2.0 | 1,427 (+4%) | 3mo | $230,000 | $161 | 69 |
| 1128 Thornwood Pl | 0.43mi | 3/2.0 | 1,274 (-7%) | 3mo | $190,000 | $149 | 66 |
| 6337 Rhemish Dr | 0.43mi | 3/2.0 | 1,235 (-10%) | 0mo | $222,000 | $180 | 63 |
| 1433 Keswick Dr | 0.55mi | 3/1.5 | 1,207 (-12%) | 1mo | $175,000 | $145 | 51 |
| 6528 Rhemish Dr | 0.52mi | 3/2.0 | 1,166 (-15%) | 1mo | $206,000 | $177 | 49 |
| 1715 Arrow Ridge Way | 0.69mi | 3/2.0 | 1,220 (-11%) | 2mo | $141,000 | $116 | 48 |
| 1716 Arrow Ridge Way | 0.67mi | 3/2.0 | 1,552 (+13%) | 2mo | $209,000 | $135 | 45 |
Match score weights: distance 35% · size 25% · config 20% · recency 20%. Top-matched comps best support the ARV.
Projected returns pro-forma
-3.0% appreciation · 3.17% rent growth · sell at horizon
- IRR
- -26.2%
- Equity multiple
- 0.11×
- Total profit
- $-54,540
- Equity at exit
- $32,803
- IRR
- -22.6%
- Equity multiple
- -0.15×
- Total profit
- $-71,106
- Equity at exit
- $19,022
Cash invested: $61,600 (down + closing). Projections, not guarantees.
Landlord ↔ Tenant lean methodology
- Overall (STATE)
- 85 Strongly Landlord-Friendly
- State North Carolina
- 85 Strongly Landlord-Friendly · R+3
- County
- — inherits STATE
- City
- — inherits STATE
ZIP-level market 28304
- Home prices YoY
- -21.7%
- Rents YoY
- 3.2%
- Active inventory
- 302
- Price-to-rent
- 12.3×
Monthly cashflow live
- Estimated rent
- $1,489 high interval (Pro) →
- Mortgage (P&I)
- −$1,154
- Tax from tax record
- −$232 /mo · $2,780/yr
- Insurance
- −$92
- HOA
- −$0
- Vacancy / Maint / Mgmt
- −$313
- Net cashflow
- $-301
Break-even live
UW: 25.0% down · 7.5% · 30yr · 1.5% tax · 5.0% vac · 8.0% maint · 8.0% mgmt
Financing live
Cash to close
- Down payment
- $55,000
- Closing costs
- $6,600
- Reserves months
- —
- Total cash needed
- —
Loan-product check · same deal, 3 products live
Conventional
25% down · 7.5% · 30yr
- Down + closing
- —
- Monthly P&I
- —
- Monthly cashflow
- —
- DSCR
- —
- Eligible?
- —
Personal DTI + credit; lowest rate.
DSCR
20% down · 8.5% · 30yr
- Down + closing
- —
- Monthly P&I
- —
- Monthly cashflow
- —
- DSCR
- —
- Eligible?
- —
No personal income docs; deal must DSCR.
Hard money
10% down · 12.0% · 12mo
- Down + closing
- —
- Monthly P&I
- —
- Monthly cashflow
- —
- DSCR
- —
- Eligible?
- —
Short-term bridge; refi at stabilization.
Rent comps 40 comps
| Address | Beds | Baths | Sqft | Rent | $/sqft | DOM | Units | Dist |
|---|---|---|---|---|---|---|---|---|
| 6333 Marykirk Dr Unit A Fayetteville, NC | 2.0 | 1.5 | 1080 | $1,075 | $1.00 | 23d | 1 | 0.11mi |
| 6332 Marykirk Dr Unit A Fayetteville, NC | 2.0 | 1.5 | 925 | $1,150 | $1.24 | 23d | 1 | 0.16mi |
| 6408 Dunham Dr Fayetteville, NC | 3.0 | 2.0 | 1400 | $1,500 | $1.07 | 13d | 1 | 0.21mi |
| 1508 Darvel Ave Fayetteville, NC | 3.0 | 2.0 | 1269 | $1,700 | $1.34 | 23d | 1 | 0.21mi |
| 1443 Larkhall Dr Fayetteville, NC | 4.0 | 2.0 | 1382 | $1,600 | $1.16 | 23d | 1 | 0.27mi |
| 3001 Stone Carriage Cir Fayetteville, NC | 1.0–3.0 | 1.0–2.0 | 1098 | $1,700 | $1.55 | 13d | 12 | 0.41mi |
| 6338 Rhemish Dr Fayetteville, NC | 3.0 | 2.0 | 1201 | $1,500 | $1.25 | 23d | 1 | 0.42mi |
| 1411 Furnish Dr Fayetteville, NC | 3.0 | 2.0 | 1100 | $1,350 | $1.23 | 23d | 1 | 0.43mi |
| 1066 Strickland Bridge Rd Fayetteville, NC | 3.0 | 2.0 | 1427 | $2,050 | $1.44 | 13d | 1 | 0.46mi |
| 3325 Oak Forest Dr Fayetteville, NC | 1.0–3.0 | 1.0–2.0 | 1112 | $1,745 | $1.57 | 13d | 66 | 0.66mi |
| 1715 Arrow Ridge Way Fayetteville, NC | 3.0 | 2.0 | 1220 | $1,550 | $1.27 | 13d | 1 | 0.70mi |
| 1070 Rulnick St Fayetteville, NC | 3.0 | 1.0 | 1014 | $1,200 | $1.18 | 23d | 1 | 0.74mi |
| 5744 Aftonshire Dr Fayetteville, NC | 2.0 | 1.5 | 945 | $999 | $1.06 | 23d | 1 | 0.81mi |
| 5706 McDougal Dr Fayetteville, NC | 3.0 | 2.0 | 1594 | $1,650 | $1.04 | 23d | 1 | 0.82mi |
| 5713 Aftonshire Dr Fayetteville, NC | 2.0 | 2.5 | 1025 | $995 | $0.97 | 13d | 1 | 0.83mi |
| 1406 Tangora Ln Fayetteville, NC | 2.0 | 2.5 | 1192 | $1,015 | $0.85 | 23d | 1 | 0.85mi |
| 6340 Ginger Cir Fayetteville, NC | 3.0 | 1.5 | 1052 | $1,400 | $1.33 | 23d | 1 | 0.86mi |
| 1216 Weeping Willow Way Unit 229 Fayetteville, NC | 3.0 | 2.0 | 960 | $969 | $1.01 | 13d | 1 | 0.87mi |
| 1413 Tangora Ln Fayetteville, NC | 2.0 | 1.5 | 945 | $979 | $1.04 | 13d | 1 | 0.89mi |
| 5876 Aftonshire Dr Fayetteville, NC | 2.0 | 1.5 | 1024 | $1,015 | $0.99 | 23d | 1 | 0.90mi |
| 5864 Aftonshire Dr Fayetteville, NC | 2.0 | 2.0 | 1100 | $1,100 | $1.00 | 23d | 1 | 0.92mi |
| 5842 Aftonshire Dr Fayetteville, NC | 2.0 | 1.5 | 1010 | $1,000 | $0.99 | 23d | 1 | 0.94mi |
| 1401 Carnsmore Dr Fayetteville, NC | 3.0 | 2.5 | 1450 | $1,575 | $1.09 | 23d | 1 | 0.95mi |
| 944 Lark Dr Fayetteville, NC | 3.0 | 2.0 | 1100 | $1,395 | $1.27 | 13d | 1 | 0.96mi |
| 1701 Carter Baron Pl Unit 211 Fayetteville, NC | 3.0 | 2.0 | 1295 | $1,700 | $1.31 | 23d | 1 | 0.96mi |
| 5812 Shenandoah Dr Fayetteville, NC | 4.0 | 2.0 | 1800 | $1,599 | $0.89 | 23d | 1 | 0.97mi |
| 1879 Frankie Ave Fayetteville, NC | 3.0 | 2.0 | 1100 | $1,375 | $1.25 | 23d | 1 | 0.98mi |
| 6301 Lakehaven Dr Fayetteville, NC | 3.0 | 2.0 | 1514 | $1,700 | $1.12 | 23d | 1 | 1.00mi |
| 1583 Winnabow Dr Fayetteville, NC | 3.0 | 2.5 | 1550 | $2,100 | $1.35 | 23d | 1 | 1.03mi |
| 1815 Paisley Ave Fayetteville, NC | 3.0 | 2.0 | 1508 | $1,595 | $1.06 | 23d | 1 | 1.06mi |
| 1644 Sweetgum Cir Fayetteville, NC | 3.0 | 2.0 | 1446 | $1,750 | $1.21 | 23d | 1 | 1.10mi |
| 1927 Shiloh Dr Fayetteville, NC | 3.0 | 1.5 | 1606 | $1,600 | $1.00 | 13d | 1 | 1.12mi |
| 1800 Balmoral Dr Fayetteville, NC | 2.0 | 2.0 | 1328 | $1,250 | $0.94 | 23d | 1 | 1.17mi |
| 1811 Balmoral Dr #202 Fayetteville, NC | 2.0 | 2.0 | 1250 | $1,275 | $1.02 | 13d | 1 | 1.19mi |
| 1761 Renwick Dr #204 Fayetteville, NC | 2.0 | 2.0 | 1331 | $1,300 | $0.98 | 13d | 1 | 1.20mi |
| 5744 Randleman St Fayetteville, NC | 3.0 | 2.0 | 1171 | $1,395 | $1.19 | 23d | 1 | 1.21mi |
| 6517 Portsmouth Dr Fayetteville, NC | 3.0 | 1.5 | 1125 | $1,250 | $1.11 | 23d | 1 | 1.23mi |
| 6132 Dandy Loop Rd Fayetteville, NC | 3.0 | 1.0 | 1456 | $1,325 | $0.91 | 23d | 1 | 1.24mi |
| 5721 Randleman St Fayetteville, NC | 3.0 | 2.0 | 1050 | $1,575 | $1.50 | 23d | 1 | 1.25mi |
| 5632 Birch Rd Fayetteville, NC | 3.0 | 1.0 | 1228 | $1,250 | $1.02 | 23d | 1 | 1.32mi |
Listing history 38 events
-
2026-06-18days on market $220,000 Active 190 DOM
-
2026-06-17days on market $220,000 Active 189 DOM
-
2026-06-16days on market $220,000 Active 188 DOM
-
2026-06-15days on market $220,000 Active 187 DOM
-
2026-06-14days on market $220,000 Active 185 DOM
-
2026-06-13days on market $220,000 Active 184 DOM
-
2026-06-10days on market $220,000 Active 182 DOM
-
2026-06-09days on market $220,000 Active 181 DOM
-
2026-06-08days on market $220,000 Active 180 DOM
-
2026-06-07days on market $220,000 Active 179 DOM
-
2026-06-03days on market $220,000 Active 175 DOM
-
2026-06-02days on market $220,000 Active 174 DOM
-
2026-06-01days on market $220,000 Active 173 DOM
-
2026-05-31days on market $220,000 Active 172 DOM
-
2026-05-30pricedays on market $220,000 Active 171 DOM
-
2026-03-16price $240,000
-
2026-03-03historical $1,780
-
2026-03-03$1,780
-
2025-12-11$243,500 Active
-
2025-11-26historical $243,500
-
2025-11-26$243,500 Active
-
2025-10-15$243,500 Active
-
2025-09-25historical
-
2025-03-18historical $1,780
-
2025-03-18$1,780
-
2025-03-08historical $1,780
-
2025-03-08$1,780
-
2023-11-07historical $1,695
-
2023-11-03$1,695
-
2022-03-24soldstatus $145,000
-
2022-03-24soldstatus $145,000
-
2022-03-24soldstatus $145,000
-
2021-12-30$175,000
-
2021-12-30$175,000
-
2021-11-09$175,000
-
2018-10-03soldstatus $119,000
-
2018-10-02soldstatus $118,800
-
2018-06-21$125,900
ⓘ Source: listings_history table (triggers on properties + properties_extension) + one-shot
backfill from property_details.listing_events for pre-trigger history.
Tax reassessment forecast NC · Resets to sale price
- Current annual tax
- $2,780 · $232/mo
- Projected year-2 tax
- $2,780 · $232/mo
- Expected delta
- $0/yr ($0/mo · 0.0%)
ⓘ Screening estimate from a state-policy table — verify with the county assessor before closing.
Climate risk First Street
- Flood 1/10 Low FEMA zone X (unshaded) · 0% chance over 30 yrs
- Wildfire 4/10 Moderate
- Heat 7/10 Severe 7 d/yr ≥107°F today · 16 d/yr by 30 yrs out
- Wind 7/10 Severe 78% chance of damaging wind over 30 yrs
- Air quality 1/10 Low 0 unhealthy d/yr today · 0 by 30 yrs out
Nearby sold comps map
Loading sold comps map…
Walkable amenities ~0.75 mi
Loading nearby amenities…
Taxation est. · year 1
- Rental income
- $17,870
- − Mortgage interest
- −$12,323
- − Property taxes
- −$2,780
- − Insurance
- −$1,100
- − Repairs & maintenance
- −$1,430
- − Management
- −$1,430
- − Depreciation
- −$6,400
- Taxable loss
- −$7,592
- Est. tax savings @ 24.0%
- +$1,822
- After-tax cash flow
- $-1,784/yr
For passive investors: Depreciation is non-cash, so a rental often shows a tax loss while cash-flowing — sheltering income. Rental losses are passive: they offset passive income freely, and up to $25,000/yr can offset ordinary (W-2) income if you actively participate and your MAGI is under $100k (phasing out to $0 by $150k); unused losses carry forward. On sale, claimed depreciation is recaptured at up to 25%, and gains may owe capital-gains tax (a 1031 exchange can defer both). Figures are a year-1 estimate at your 24.0% rate — not tax advice; consult a CPA.
Schools (NCES district)
- District
- Cumberland County Schools
- NCES district ID
- 3700011
- Math proficiency
- 32% ▼ -2.00%
- Reading proficiency
- 41% ▼ -1.00%
- Median HH income
- $44,168
- Composite
- 31.0/100
- National rank
- #6096
- State rank
- #126 of 178 in NC
Livability — Fayetteville
- Score
- 75/100
- State rank
- #45
- US rank
- #4031
Category grades
Schools grade is shown separately in the Schools card above.
Census & demographics
- Census place
- Fayetteville, NC
- County
- Cumberland County · 265,314 people
- City population
- 226,118
- Metro
- Fayetteville, NC
- Population (ZIP)
- 37,140
- Household income
- $58,563
- Rent vs Own
- Severe rent burden
- 1667.0
Population outlook (Cumberland County) Hauer SSP2
- Today (2025)
- 330,855 people
- By 2030
- 333,523 · +0.8%
- By 2040
- 335,583 · +1.4%
- By 2050
- 335,325 · +1.4%
- By 2075
- 342,853 · +3.6%
- By 2100
- 340,698 · +3.0%
Race, ethnicity, and origin ACS 2023
- Neighborhood character
- Highly diverse neighborhood (Simpson 0.70)
- Race & ethnicity
- Black 39% White 36% Hispanic / Latino 14% Two or more races 12% Asian 3% Native American 1%
- Hispanic origin (detail)
- Mexican 5% Puerto Rican 5%
- Common ancestry
- Slovak 2% Italian 1% Serbian 1%
- Foreign-born
- 8% · Canada, South Korea, Vietnam
- Languages at home
- 87% English-only · Spanish 9% Tagalog/Filipino 1% French/Haitian/Cajun 1%
Political lean MEDSL · Cumberland
- 2024 margin
- D (+13.4) · D 56.1% · R 42.7% · Other 1.2%
- 2008→2024 swing
- -4.3pp toward R · 2008: 17.7pp · 2024: 13.4pp
- All cycles
- 2024: D+13.4 2020: D+16.6 2016: D+16.0 2012: D+19.7 2008: D+17.7
Not yet ingested
- Civics
- —
Market trends
- HPI YoY
- ▼ -59.90%
- Current HPI
- 215.927
- Rent YoY
- ▲ 3.17%
- Metro
- Fayetteville, NC
- State GDP YoY
- ▲ 3.28%
- F500 in state
- 26
Industry mix (Fortune 500 HQ in NC)
| Industry | F500 HQs | Revenue |
|---|---|---|
| Financial Services | 2 | $213B |
|
||
| Retail | 2 | $95B |
|
||
| Industrial Conglomerate | 1 | $38B |
|
||
| Metals / Steel | 1 | $35B |
|
||
| Utilities | 1 | $30B |
|
||
| Industrial Machinery | 1 | $19B |
|
||
Price history
+90.6% since first listed23 events — show timeline
- 2026-03-16 Price Changed $240,000 LPRMLS
- 2026-03-03 Rental Removed $1,780 TMLS
- 2026-03-03 Listed for Rent $1,780 TMLS
- 2025-12-11 Listed $243,500 LPRMLS
- 2025-11-26 Coming Soon $243,500 LPRMLS
- 2025-11-26 Listed $243,500 LPRMLS
- 2025-10-15 Listed $243,500 LPRMLS
- 2025-09-25 Coming Soon — LPRMLS
- 2025-03-18 Rental Removed $1,780 TMLS
- 2025-03-18 Listed for Rent $1,780 TMLS
- 2025-03-08 Rental Removed $1,780 LPRMLS
- 2025-03-08 Listed for Rent $1,780 LPRMLS
- 2023-11-07 Rental Removed $1,695 TMLS
- 2023-11-03 Listed for Rent $1,695 TMLS
- 2022-03-24 Sold (Public Records) $145,000 Public Records
- 2022-03-24 Sold (MLS) $145,000 TMLS
- 2022-03-24 Sold (MLS) $145,000 LPRMLS
- 2021-12-30 Listed $175,000 TMLS
- 2021-12-30 Listed $175,000 LPRMLS
- 2021-11-09 Listed $175,000 LPRMLS
- 2018-10-03 Sold (Public Records) $119,000 Public Records
- 2018-10-02 Sold (MLS) $118,800 LPRMLS
- 2018-06-21 Listed $125,900 LPRMLS
Property tax history
+4.3%/yrLatest (2025): $2,780 · +30.2% YoY. Source: county tax records.
Cash-flow waterfall
monthlySold comps — $/sqft
last 12 mo · ≤1 miLoading sold comps…