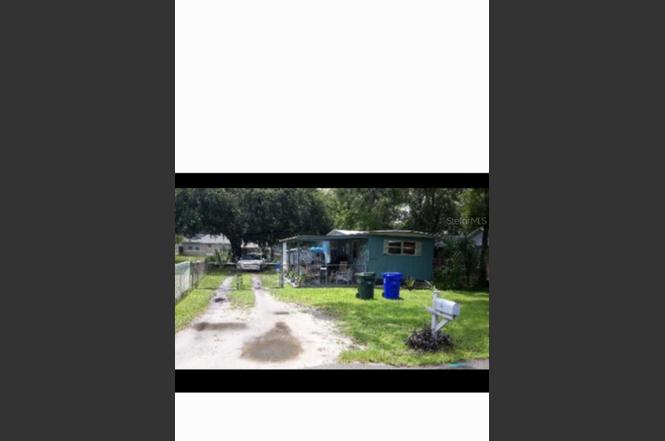
1402 W Patterson St · Lakeland, FL
Flood risk 1/10 · Minimal
- FEMA flood zone
- X (unshaded)
- Chance of flooding over 30 yrs
- 0.0%
- Est. flood insurance / yr
- $507 – $1,088
Fire risk 2/10 · Minimal
- Est. fire insurance / yr
- $947 – $1,759
Heat risk 8/10 · Major
- Hot days now (above 108°F)
- 5 days/yr
- Hot days in 30 yrs
- 16 days/yr
Wind risk 9/10 · Severe
- Chance of severe wind over 30 yrs
- 99.0%
Air-quality risk 2/10 · Minimal
- Unhealthy air days now
- 1 days/yr
- Unhealthy air days in 30 yrs
- 2 days/yr
Risk factors via First Street. Map © Google.
Why this score? — see what drove the A- grade
The composite is a weighted blend of 9 inputs, each scored 0–100. Each bar is that input's sub-score; the figure is the points it added to the 100-point composite (weight × sub-score).
- Cash flow +30.0/30.0
- 1% rule +10.0/10.0
- DSCR +10.0/10.0
- Appreciation +10.0/10.0
- ARV discount +7.5/15.0
- Rent growth +4.0/5.0
- Livability +3.9/5.0
- Schools +3.5/10.0
- Condition / age +2.5/5.0
$70,000
🖨 Deal sheet (PDF) 📄 Offer letter ✓ Due diligence
Listing remarks MLS
Great rental MH in west Lakeland. Tenant occupied and will stay if buyer want to build their portfolio. Seller has another similar MH available "Trenton" and will accept a reduced sale. Seller will sell both for $58000.00
Key facts
- 6,499 sq ft lot
- Built 1972
- Listed 212 days
Property features AI
Finance
- Other: Lot size about 0.15 acres (50 x 130); Total acreage less than 1/4 acre
- Financial info: No investor or income/expense details listed
- HOA & community: No HOA
Exterior
- Parking: No parking details listed
- Security: No security features listed
- Utilities: Public water; Public utilities; Sewer: Other
- Home design: Mobile home (single wide); Residential property; One level; Faces east
- Construction: Frame construction; Slate roof; Built on foundation type not specified; Approximately 199? (year built not provided)
- Exterior features: Dog run; Asphalt road access
Interior
- Kitchen: No appliances listed
- Bedrooms: 2 bedrooms
- Flooring: Carpet flooring
- Bathrooms: 1 full bathroom
- Heating & cooling: No heating listed; No cooling listed
- Interior features: No interior features listed
- Laundry & utility: No laundry facilities (none listed)
Neighborhood map
What this means for you Summary
Snapshot
- This is a 2-bed/1.0-bath manufactured listed at $70k.
Deal economics
- At list price, monthly cash flow is $594 ($7k/yr) — positive.
- The deal already cash-flows at list — no discount required.
- Meets the 1% rule at list price ($1k rent vs $70k).
- Recommended offer: $62k (12.0% below list) — sets the bar for market timing.
Location & tenants
- Location reads 77/100 on livability (#206 in FL, #3,179 nationally) — a middle-class / working-renter tenant base. Strengths: cost of living A+, housing A+, health & safety A+; Watch: employment D+, amenities F, commute F.
- Polk (suburban): math 39% / reading 43% proficiency, ranked #62 of 73 in FL (top 85%) — families likely to look elsewhere, expect single-tenant / working-renter base with shorter leases.
- Zoned schools: Jesse Keen Elementary School (math 20% / reading 21%, grade F, #2,094 of 2,144 statewide, top 98%, 649 students, 67% FRL); Sleepy Hill Middle School (math 29% / reading 34%, grade F, #453 of 571 statewide, top 81%, 1,090 students, 66% FRL); Kathleen Senior High School (math 19% / reading 31%, grade F, #501 of 667 statewide, top 75%, 2,051 students, 59% FRL) — zoned schools at 64% FRL track the district average.
- Zoned-school proficiency averages 26% at this address vs 41% district-wide (-15 pts) — the specific schools serving this property underperform the Polk average; the district grade overstates school quality for this exact location.
- Market conditions: Rents rising fast (+6.1%/yr); 74 active listings in the ZIP; 13 comparable units currently listed for rent nearby; rentals at typical pace (median 21d on market — plan ~3-4 weeks tenant-placement turnaround); lower-income renter base — watch delinquency; 10,384 units permitted in Polk County in 2024 (1,716 in 5+ unit buildings).
Forward outlook
- In year one you build about $7k of equity ($484 loan paydown + $7k appreciation (10.0% local appreciation)).
- Polk County population projected at +33% by 2050 — long-run rental-demand tailwind backs the buy-and-hold thesis.
- At projected returns (10.0% appreciation + 6.1% rent growth), your $20k cash investment doubles in ~2 years — after that, you're playing with house money.
- By year 5, paydown + projected appreciation supports a ~$35k cash-out refi (75% LTV) — recoverable capital for the next deal without selling this one.
Negotiation context
- It's been on market 212 days — a 12% lower offer ($62k) is reasonable based on typical stale-listing flexibility.
- 6 sale attempts since 9y ago; this cycle's ask has dropped $19k (21%) from the opening price — seller is motivated, your offer sets the floor, not the list.
- Current owner paid $28k; list at $70k implies a 146% gain — meaningful room to come down on a strong offer.
Risks & watch-outs
- Climate carrying-cost: severe wind risk, 99% chance of damaging wind over 30y; extreme-heat days projected 5→16/yr by 2055 (HVAC capex compounding) — expect insurance premiums to compound above CPI over the hold.
Questions for the listing agent
- It's been on market 212 days. Have you received any prior offers? Is the seller open to a 12% concession, seller financing, or rate buy-down credit?
- Built in 1972 — when were the roof, HVAC, electrical panel, plumbing, and water heater last replaced?
- Why hasn't it sold? Are there any deal-killer items the seller is aware of (foundation, flood, title, zoning, code violations)?
- Is there a deadline driving the sale (1031 exchange, divorce, estate, relocation)? That informs how much negotiation room exists.
- What's the average days-on-market for RENTAL listings here right now (not sales)? A rising rental-DOM trend means longer vacancies and softer asking-rent achievability than the comps imply.
- What's the recent tenant-quality profile in this submarket — average credit score on applications, eviction rate, late-payment / NSF rate, and stable-employment percentage? A property-management company in the area should have these aggregated.
- How much new for-sale + rental construction is in the pipeline within 1–3 miles? Heavy new supply typically softens prices + rents 12–24 months out; constrained supply supports both.
Investment metrics
- 1% rule
- 1.98% ✓
- Cap rate
- 16.48%
- Cash-on-cash
- 36.39%
- DSCR
- 2.62
- GRM
- 4.2
CMA / ARV
No comps found within radius.
Projected returns pro-forma
10.0% appreciation · 6.14% rent growth · sell at horizon
- IRR
- 54.4%
- Equity multiple
- 5.11×
- Total profit
- $80,534
- Equity at exit
- $63,062
- IRR
- 49.3%
- Equity multiple
- 12.12×
- Total profit
- $217,871
- Equity at exit
- $135,995
Cash invested: $19,600 (down + closing). Projections, not guarantees.
Landlord ↔ Tenant lean methodology
- Overall (STATE)
- 87 Strongly Landlord-Friendly
- State Florida
- 87 Strongly Landlord-Friendly · R+3
- County
- — inherits STATE
- City
- — inherits STATE
ZIP-level market 33815
- Home prices YoY
- 12.6%
- Rents YoY
- 6.1%
- Active inventory
- 74
- Price-to-rent
- 4.2×
Monthly cashflow live
- Estimated rent
- $1,388 high interval (Pro) →
- Mortgage (P&I)
- −$367
- Tax from tax record
- −$106 /mo · $1,271/yr
- Insurance
- −$29
- HOA
- −$0
- Vacancy / Maint / Mgmt
- −$291
- Net cashflow
- $594
Break-even live
Sensitivity live
| Price | -10% $634 | -5% $614 | +0% $594 | +5% $575 | +10% $555 |
|---|---|---|---|---|---|
| Rent | -10% $485 | -5% $540 | +0% $594 | +5% $649 | +10% $704 |
| Rate | -1.0pp $630 | -0.5pp $612 | base $594 | +0.5pp $576 | +1.0pp $558 |
UW: 25.0% down · 7.5% · 30yr · 1.5% tax · 5.0% vac · 8.0% maint · 8.0% mgmt
Financing live
Cash to close
- Down payment
- $17,500
- Closing costs
- $2,100
- Reserves months
- —
- Total cash needed
- —
Loan-product check · same deal, 3 products live
Conventional
25% down · 7.5% · 30yr
- Down + closing
- —
- Monthly P&I
- —
- Monthly cashflow
- —
- DSCR
- —
- Eligible?
- —
Personal DTI + credit; lowest rate.
DSCR
20% down · 8.5% · 30yr
- Down + closing
- —
- Monthly P&I
- —
- Monthly cashflow
- —
- DSCR
- —
- Eligible?
- —
No personal income docs; deal must DSCR.
Hard money
10% down · 12.0% · 12mo
- Down + closing
- —
- Monthly P&I
- —
- Monthly cashflow
- —
- DSCR
- —
- Eligible?
- —
Short-term bridge; refi at stabilization.
Rent comps 13 comps
| Address | Beds | Baths | Sqft | Rent | $/sqft | DOM | Units | Dist |
|---|---|---|---|---|---|---|---|---|
| 1113 S Central Ave Lakeland, FL | 3.0 | 1.0 | 672 | $1,700 | $2.53 | 13d | 1 | 0.20mi |
| 808 S Central Ave Lakeland, FL | 2.0 | 1.0 | 700 | $1,100 | $1.57 | 25d | 1 | 0.48mi |
| 457 Arapahoe Ave Lakeland, FL | 2.0 | 1.0 | 750 | $1,095 | $1.46 | 4d | 1 | 0.80mi |
| 455 Arapahoe Ave Lakeland, FL | 2.0 | 1.0 | 750 | $1,199 | $1.60 | 20d | 1 | 0.81mi |
| 830 W Beacon Rd #13 Lakeland, FL | 2.0 | 1.0 | 750 | $1,295 | $1.73 | 13d | 1 | 0.96mi |
| 830 W Beacon Rd Lakeland, FL | 1.0–2.0 | 1.0 | 690 | $1,295 | $1.88 | 25d | 2 | 0.96mi |
| 115 Cresap St Unit 11 1-12 Lakeland, FL | 1.0 | 1.0 | 575 | $950 | $1.65 | 16d | 1 | 1.21mi |
| 711 S Missouri Ave Lakeland, FL | 1.0 | 1.0 | 650 | $1,175 | $1.81 | 5d | 1 | 1.24mi |
| 400 W Beacon Rd Lakeland, FL | 1.0–2.0 | 1.0–2.0 | 862 | $2,001 | $2.32 | 5d | 6 | 1.27mi |
| 2245 New Tampa Hwy Lakeland, FL | 1.0 | 1.0 | 500 | $977 | $1.95 | 25d | 1 | 1.33mi |
| 118 Riggins St Lakeland, FL | 1.0 | 1.0 | 700 | $1,150 | $1.64 | 25d | 1 | 1.33mi |
| 1112 South Blvd Unit E Lakeland, FL | 2.0 | 1.0 | 729 | $1,250 | $1.71 | 25d | 1 | 1.41mi |
| 214 N Chestnut Rd Lakeland, FL | 1.0 | 1.0 | 500 | $1,000 | $2.00 | 25d | 1 | 1.42mi |
Listing history 46 events
-
2026-06-22days on market $70,000 Active 212 DOM
-
2026-06-18days on market $70,000 Active 209 DOM
-
2026-06-17days on market $70,000 Active 208 DOM
-
2026-06-16days on market $70,000 Active 207 DOM
-
2026-06-15days on market $70,000 Active 206 DOM
-
2026-06-13days on market $70,000 Active 204 DOM
-
2026-06-10days on market $70,000 Active 201 DOM
-
2026-06-09days on market $70,000 Active 200 DOM
-
2026-06-08days on market $70,000 Active 199 DOM
-
2026-06-07days on market $70,000 Active 198 DOM
-
2026-06-05days on market $70,000 Active 195 DOM
-
2026-06-03days on market $70,000 Active 193 DOM
-
2026-06-01days on market $70,000 Active 192 DOM
-
2026-05-31days on market $70,000 Active 191 DOM
-
2026-04-30price $70,000
-
2026-04-15price $79,000
-
2026-03-20price $70,000
-
2026-03-14price $79,000
-
2026-01-28price $66,000
-
2026-01-22price $70,000
-
2026-01-02price $75,000
-
2025-12-29price $79,000
-
2025-12-23price $70,000
-
2025-11-25price $79,000
-
2025-11-21$89,000 Active
-
2020-05-26historical
-
2019-11-20price $59,000
-
2019-08-31price $45,000
-
2019-07-23price $49,999
-
2019-07-18$59,000 Active
-
2018-06-26soldstatus $28,500 Sold 231-char remark
Show marketing remark (231 chars)
Great rental MH in west Lakeland. Tenant occupied and will stay if buyer want to build their portfolio. Seller has another similar MH available "Trenton" and will accept a reduced sale. Seller will sell both for $58000.00
-
2018-06-22status Pending 231-char remark
Show marketing remark (231 chars)
Great rental MH in west Lakeland. Tenant occupied and will stay if buyer want to build their portfolio. Seller has another similar MH available "Trenton" and will accept a reduced sale. Seller will sell both for $58000.00
-
2018-06-22price $29,900 231-char remark
Show marketing remark (231 chars)
Great rental MH in west Lakeland. Tenant occupied and will stay if buyer want to build their portfolio. Seller has another similar MH available "Trenton" and will accept a reduced sale. Seller will sell both for $58000.00
-
2018-06-21status Active 231-char remark
Show marketing remark (231 chars)
Great rental MH in west Lakeland. Tenant occupied and will stay if buyer want to build their portfolio. Seller has another similar MH available "Trenton" and will accept a reduced sale. Seller will sell both for $58000.00
-
2018-05-10status Pending 231-char remark
Show marketing remark (231 chars)
Great rental MH in west Lakeland. Tenant occupied and will stay if buyer want to build their portfolio. Seller has another similar MH available "Trenton" and will accept a reduced sale. Seller will sell both for $58000.00
-
2018-03-06$36,500 Active 231-char remark
Show marketing remark (231 chars)
Great rental MH in west Lakeland. Tenant occupied and will stay if buyer want to build their portfolio. Seller has another similar MH available "Trenton" and will accept a reduced sale. Seller will sell both for $58000.00
-
2018-03-02historical
-
2018-02-15price $36,000
-
2017-10-25price $35,750
-
2017-10-23status Active
-
2017-10-03historical
-
2017-08-28price $36,000
-
2017-08-16price $37,200
-
2017-05-02price $37,500
-
2017-03-03$39,900 Active
-
1998-12-28soldstatus $8,000
ⓘ Source: listings_history table (triggers on properties + properties_extension) + one-shot
backfill from property_details.listing_events for pre-trigger history.
Tax reassessment forecast FL · Resets to sale price
- Current annual tax
- $1,271 · $106/mo
- Projected year-2 tax
- $1,271 · $106/mo
- Expected delta
- $0/yr ($0/mo · 0.0%)
ⓘ Screening estimate from a state-policy table — verify with the county assessor before closing.
Climate risk First Street
- Flood 1/10 Low FEMA zone X (unshaded) · 0% chance over 30 yrs
- Wildfire 2/10 Low
- Heat 8/10 Severe 5 d/yr ≥108°F today · 16 d/yr by 30 yrs out
- Wind 9/10 Extreme 99% chance of damaging wind over 30 yrs
- Air quality 2/10 Low 1 unhealthy d/yr today · 2 by 30 yrs out
Nearby sold comps map
Loading sold comps map…
Walkable amenities ~0.75 mi
Loading nearby amenities…
Taxation est. · year 1
- Rental income
- $16,656
- − Mortgage interest
- −$3,921
- − Property taxes
- −$1,271
- − Insurance
- −$350
- − Repairs & maintenance
- −$1,333
- − Management
- −$1,333
- − Depreciation
- −$2,036
- Taxable income
- $6,413
- Est. tax owed @ 24.0%
- −$1,539
- After-tax cash flow
- $5,593/yr
For passive investors: Depreciation is non-cash, so a rental often shows a tax loss while cash-flowing — sheltering income. Rental losses are passive: they offset passive income freely, and up to $25,000/yr can offset ordinary (W-2) income if you actively participate and your MAGI is under $100k (phasing out to $0 by $150k); unused losses carry forward. On sale, claimed depreciation is recaptured at up to 25%, and gains may owe capital-gains tax (a 1031 exchange can defer both). Figures are a year-1 estimate at your 24.0% rate — not tax advice; consult a CPA.
Schools (NCES district)
- District
- Polk
- NCES district ID
- 1201590
- Math proficiency
- 39% ▼ -11.00%
- Reading proficiency
- 43% ▼ -4.00%
- Median HH income
- $43,979
- Composite
- 34.74/100
- National rank
- #5132
- State rank
- #62 of 73 in FL
Livability — Lakeland
- Score
- 77/100
- State rank
- #206
- US rank
- #3179
Category grades
Schools grade is shown separately in the Schools card above.
Census & demographics
- Census place
- Lakeland, FL
- County
- Polk County · 740,051 people
- City population
- 277,690
- Metro
- Lakeland-Winter Haven, FL
- Population (ZIP)
- 13,975
- Household income
- $37,487
- Rent vs Own
- Severe rent burden
- 700.0
Population outlook (Polk County) Hauer SSP2
- Today (2025)
- 752,975 people
- By 2030
- 804,621 · +6.9%
- By 2040
- 906,117 · +20.3%
- By 2050
- 1,000,476 · +32.9%
- By 2075
- 1,197,520 · +59.0%
- By 2100
- 1,271,518 · +68.9%
Race, ethnicity, and origin ACS 2023
- Neighborhood character
- Diverse neighborhood (Simpson 0.67)
- Race & ethnicity
- White 43% Black 27% Hispanic / Latino 26% Two or more races 10% Asian 1%
- Hispanic origin (detail)
- Mexican 12% Puerto Rican 10%
- Common ancestry
- Romanian 1% German 1% Lithuanian 1%
- Foreign-born
- 11% · Canada, Jamaica, China
- Languages at home
- 75% English-only · Spanish 23% German/W. Germanic 1%
Political lean MEDSL · Polk
- 2024 margin
- Strong R (+20.7) · D 39.2% · R 59.9%
- 2008→2024 swing
- -14.6pp toward R · 2008: -6.1pp · 2024: -20.7pp
- All cycles
- 2024: R+20.7 2020: R+14.4 2016: R+14.1 2012: R+6.8 2008: R+6.1
Not yet ingested
- Civics
- —
Market trends
- HPI YoY
- ▲ 47.45%
- Current HPI
- 424.0956
- Rent YoY
- ▲ 6.14%
- Metro
- Lakeland-Winter Haven, FL
- State GDP YoY
- ▲ 3.28%
- F500 in state
- 36
Industry mix (Fortune 500 HQ in FL)
| Industry | F500 HQs | Revenue |
|---|---|---|
| Industrial Technology | 2 | $29B |
|
||
| Insurance | 2 | $17B |
|
||
| Retail | 1 | $60B |
|
||
| Technology Distribution | 1 | $58B |
|
||
| Homebuilding | 1 | $35B |
|
||
| Technology Manufacturing | 1 | $35B |
|
||
Price history
+775.0% since first listed32 events — show timeline
- 2026-04-30 Price Changed $70,000 Stellar MLS as Distributed by MLS Grid
- 2026-04-15 Price Changed $79,000 Stellar MLS as Distributed by MLS Grid
- 2026-03-20 Price Changed $70,000 Stellar MLS as Distributed by MLS Grid
- 2026-03-14 Price Changed $79,000 Stellar MLS as Distributed by MLS Grid
- 2026-01-28 Price Changed $66,000 Stellar MLS as Distributed by MLS Grid
- 2026-01-22 Price Changed $70,000 Stellar MLS as Distributed by MLS Grid
- 2026-01-02 Price Changed $75,000 Stellar MLS as Distributed by MLS Grid
- 2025-12-29 Price Changed $79,000 Stellar MLS as Distributed by MLS Grid
- 2025-12-23 Price Changed $70,000 Stellar MLS as Distributed by MLS Grid
- 2025-11-25 Price Changed $79,000 Stellar MLS as Distributed by MLS Grid
- 2025-11-21 Listed $89,000 Stellar MLS as Distributed by MLS Grid
- 2020-05-26 Listing Removed — Stellar MLS as Distributed by MLS Grid
- 2019-11-20 Price Changed $59,000 Stellar MLS as Distributed by MLS Grid
- 2019-08-31 Price Changed $45,000 Stellar MLS as Distributed by MLS Grid
- 2019-07-23 Price Changed $49,999 Stellar MLS as Distributed by MLS Grid
- 2019-07-18 Listed $59,000 Stellar MLS as Distributed by MLS Grid
- 2018-06-26 Sold (MLS) $28,500 Stellar MLS as Distributed by MLS Grid
- 2018-06-22 Pending — Stellar MLS as Distributed by MLS Grid
- 2018-06-22 Price Changed $29,900 Stellar MLS as Distributed by MLS Grid
- 2018-06-21 Relisted — Stellar MLS as Distributed by MLS Grid
- 2018-05-10 Pending — Stellar MLS as Distributed by MLS Grid
- 2018-03-06 Listed $36,500 Stellar MLS as Distributed by MLS Grid
- 2018-03-02 Listing Removed — Stellar MLS as Distributed by MLS Grid
- 2018-02-15 Price Changed $36,000 Stellar MLS as Distributed by MLS Grid
- 2017-10-25 Price Changed $35,750 Stellar MLS as Distributed by MLS Grid
- 2017-10-23 Relisted — Stellar MLS as Distributed by MLS Grid
- 2017-10-03 Listing Removed — Stellar MLS as Distributed by MLS Grid
- 2017-08-28 Price Changed $36,000 Stellar MLS as Distributed by MLS Grid
- 2017-08-16 Price Changed $37,200 Stellar MLS as Distributed by MLS Grid
- 2017-05-02 Price Changed $37,500 Stellar MLS as Distributed by MLS Grid
- 2017-03-03 Listed $39,900 Stellar MLS as Distributed by MLS Grid
- 1998-12-28 Sold (Public Records) $8,000 Public Records
Property tax history
+15.2%/yrLatest (2025): $1,271 · -0.0% YoY. Source: county tax records.
Cash-flow waterfall
monthlySold comps — $/sqft
last 12 mo · ≤1 miLoading sold comps…