117 W Choctaw Ave · Marble City, OK
Flood risk No data
- FEMA flood zone
- —
- Chance of flooding over 30 yrs
- —
- Est. flood insurance / yr
- —
Fire risk No data
- Est. fire insurance / yr
- —
Heat risk No data
- Hot days now (above threshold)
- —
- Hot days in 30 yrs
- —
Wind risk No data
- Chance of severe wind over 30 yrs
- —
Air-quality risk No data
- Unhealthy air days now
- —
- Unhealthy air days in 30 yrs
- —
Risk factors via First Street. Map © Google.
Why this score? — see what drove the D grade
The composite is a weighted blend of 9 inputs, each scored 0–100. Each bar is that input's sub-score; the figure is the points it added to the 100-point composite (weight × sub-score).
- Cash flow +13.9/30.0
- ARV discount +7.5/15.0
- Appreciation +5.0/10.0
- DSCR +4.2/10.0
- 1% rule +3.9/10.0
- Livability +2.7/5.0
- Rent growth +2.5/5.0
- Condition / age +2.5/5.0
- Schools +1.6/10.0
$95,700
🖨 Deal sheet 📄 Offer letter ✓ Due diligence
Listing remarks
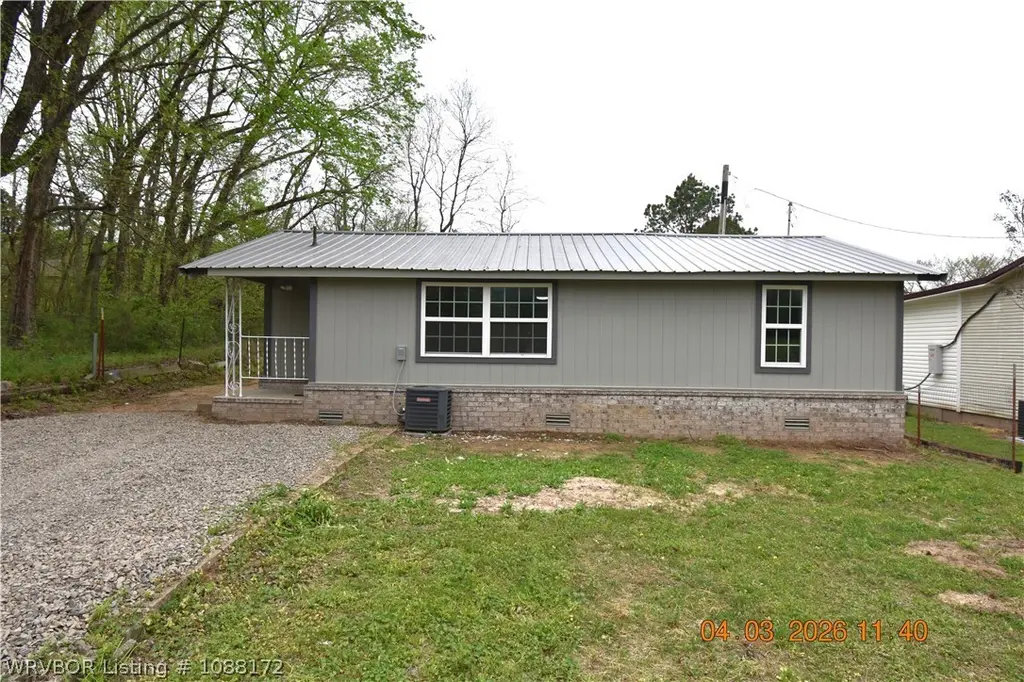
This property has been completely gone through and updated and ready for a new owner. Adorable 3 bedroom and 1 bath. Great large back yard. Metal Roof , Newer windows. Central Heat and Air. New brick Wainscot and Smart Siding. LVT flooring. New paint. Located in Cookson Hills , Marble City is a growing community with its Multi million dollar New infrastructure and New Cherokee Nation Offices. New plans and development in the works and Just 10 miles or 11 minutes from Sallisaw 35 Minutes to Tahlequah. 6 minute's to Brushy Lake and less than mile to Sallisaw Creek. Cookson Hills Electric and wifi.
Key facts
- Metal roof
- Smart siding
- Central heat and air
Tags
Property features AI
Exterior
- Parking: Gravel parking
- Utilities: Public water; Electricity available; Sewer available; Water available
- Home design: Single family residence; One story; House
- Construction: Brick and other exterior materials (see remarks); Shingle roof
- Exterior features: Covered patio/porch; Partial fencing; Cleared lot; County road frontage
Interior
- Kitchen: Electric water heater
- Flooring: Laminate; Simulated wood
- Bathrooms: 1 full bathroom
- Heating & cooling: Central heating (electric); Central air (electric)
- Interior features: Blinds; Smoke detector(s)
- Laundry & utility: Electric dryer hookup
Neighborhood map
What this means for you Summary
Snapshot
- This is a 2-bed/1.0-bath single-family listed at $96k.
Deal economics
- At list price, monthly cash flow is $11 ($132/yr) — positive.
- The deal already cash-flows at list — no discount required.
- To meet the 1% rule (rent ≥ 1% of price), the offer needs to be $85k (11.1% below list).
- Recommended offer: $85k (11.1% below list) — sets the bar for 1% rule.
Location & tenants
- Location reads 54/100 on livability (#580 in OK) — a working-class tenant base; expect higher turnover. Strengths: crime A+, cost of living A+; Watch: employment D, amenities F, commute F.
- Marble City (rural): math 20% / reading 11% proficiency, ranked #469 of 513 in OK (top 91%) — low school quality limits family demand, transient renter base, plan for 1-2y turnover; 78% free/reduced lunch — lower-income household profile, screen leases tightly.
- Zoned schools: Marble City Public School (math 15% / reading 15%, grade F, #591 of 845 statewide, top 71%, 86 students, 0% FRL) — zoned schools average 0% FRL vs 78% district-wide (78 pts lower); this property's tenant base skews higher-income than the district average.
- Market conditions: 8 active listings in the ZIP; 125 units permitted in Sequoyah County in 2024 (0 in 5+ unit buildings).
Forward outlook
- In year one you build about $4k of equity ($662 loan paydown + $3k appreciation (3.0% local appreciation)).
- Sequoyah County population projected at -16% by 2050 — secular population decline; favor cash flow + early exit over multi-decade hold.
- At projected returns (3.0% appreciation + 3.0% rent growth), your $27k cash investment doubles in ~6 years — after that, you're playing with house money.
- By year 9, paydown + projected appreciation supports a ~$30k cash-out refi (75% LTV) — recoverable capital for the next deal without selling this one.
Negotiation context
- It's been on market 73 days — a 6% lower offer ($90k) is reasonable based on typical stale-listing flexibility.
Questions for the listing agent
- It's been on market 73 days. Have you received any prior offers? Is the seller open to a 11% concession, seller financing, or rate buy-down credit?
- Built in 1964 — when were the roof, HVAC, electrical panel, plumbing, and water heater last replaced?
- Why hasn't it sold? Are there any deal-killer items the seller is aware of (foundation, flood, title, zoning, code violations)?
- Is there a deadline driving the sale (1031 exchange, divorce, estate, relocation)? That informs how much negotiation room exists.
- Schools are F-rated, which usually means shorter tenancies and higher turnover. Who's the typical renter profile here, and what's been the actual vacancy rate?
- The area grade is low — what's the realistic commute time and amenity access for the typical tenant pool here? Any planned neighborhood developments (good or bad) we should know about?
- What's the average days-on-market for RENTAL listings here right now (not sales)? A rising rental-DOM trend means longer vacancies and softer asking-rent achievability than the comps imply.
- What's the recent tenant-quality profile in this submarket — average credit score on applications, eviction rate, late-payment / NSF rate, and stable-employment percentage? A property-management company in the area should have these aggregated.
- How much new for-sale + rental construction is in the pipeline within 1–3 miles? Heavy new supply typically softens prices + rents 12–24 months out; constrained supply supports both.
Investment metrics
- 1% rule
- 0.89% ✗
- Cap rate
- 6.43%
- Cash-on-cash
- 0.49%
- DSCR
- 1.02
- GRM
- 9.4
CMA / ARV
No comps found within radius.
Projected returns pro-forma
3.0% appreciation · 3.0% rent growth · sell at horizon
- IRR
- 8.0%
- Equity multiple
- 1.46×
- Total profit
- $12,244
- Equity at exit
- $43,031
- IRR
- 10.6%
- Equity multiple
- 2.59×
- Total profit
- $42,636
- Equity at exit
- $66,316
Cash invested: $26,796 (down + closing). Projections, not guarantees.
Landlord ↔ Tenant lean methodology
- Overall (STATE)
- 83 Strongly Landlord-Friendly
- State Oklahoma
- 83 Strongly Landlord-Friendly · R+20
- County
- — inherits STATE
- City
- — inherits STATE
ZIP-level market 74945
- Active inventory
- 8
- Price-to-rent
- 9.4×
Monthly cashflow live
- Estimated rent
- $851 medium interval (Pro) →
- Mortgage (P&I)
- −$502
- Tax est. 1.5%
- −$120 /mo · $1,436/yr
- Insurance
- −$40
- HOA
- −$0
- Vacancy / Maint / Mgmt
- −$179
- Net cashflow
- $11
Break-even live
UW: 25.0% down · 7.5% · 30yr · 1.5% tax · 5.0% vac · 8.0% maint · 8.0% mgmt
Financing live
Cash to close
- Down payment
- $23,925
- Closing costs
- $2,871
- Reserves months
- —
- Total cash needed
- —
Loan-product check · same deal, 3 products live
Conventional
25% down · 7.5% · 30yr
- Down + closing
- —
- Monthly P&I
- —
- Monthly cashflow
- —
- DSCR
- —
- Eligible?
- —
Personal DTI + credit; lowest rate.
DSCR
20% down · 8.5% · 30yr
- Down + closing
- —
- Monthly P&I
- —
- Monthly cashflow
- —
- DSCR
- —
- Eligible?
- —
No personal income docs; deal must DSCR.
Hard money
10% down · 12.0% · 12mo
- Down + closing
- —
- Monthly P&I
- —
- Monthly cashflow
- —
- DSCR
- —
- Eligible?
- —
Short-term bridge; refi at stabilization.
Listing history 15 events
-
2026-06-18days on market $95,700 Active 73 DOM
-
2026-06-17days on market $95,700 Active 72 DOM
-
2026-06-16days on market $95,700 Active 71 DOM
-
2026-06-15days on market $95,700 Active 70 DOM
-
2026-06-13days on market $95,700 Active 68 DOM
-
2026-06-12days on market $95,700 Active 67 DOM
-
2026-06-09days on market $95,700 Active 64 DOM
-
2026-06-08days on market $95,700 Active 63 DOM
-
2026-06-08days on market $95,700 Active 62 DOM
-
2026-06-05days on market $95,700 Active 60 DOM
-
2026-06-04days on market $95,700 Active 58 DOM
-
2026-06-02days on market $95,700 Active 57 DOM
-
2026-06-01days on market $95,700 Active 56 DOM
-
2026-05-31days on market $95,700 Active 55 DOM
-
2026-04-06$95,700 Active
ⓘ Source: listings_history table (triggers on properties + properties_extension) + one-shot
backfill from property_details.listing_events for pre-trigger history.
Nearby sold comps map
Loading sold comps map…
Walkable amenities ~0.75 mi
Loading nearby amenities…
Taxation est. · year 1
- Rental income
- $10,214
- − Mortgage interest
- −$5,361
- − Property taxes
- −$1,436
- − Insurance
- −$478
- − Repairs & maintenance
- −$817
- − Management
- −$817
- − Depreciation
- −$2,784
- Taxable loss
- −$1,479
- Est. tax savings @ 24.0%
- +$355
- After-tax cash flow
- $487/yr
For passive investors: Depreciation is non-cash, so a rental often shows a tax loss while cash-flowing — sheltering income. Rental losses are passive: they offset passive income freely, and up to $25,000/yr can offset ordinary (W-2) income if you actively participate and your MAGI is under $100k (phasing out to $0 by $150k); unused losses carry forward. On sale, claimed depreciation is recaptured at up to 25%, and gains may owe capital-gains tax (a 1031 exchange can defer both). Figures are a year-1 estimate at your 24.0% rate — not tax advice; consult a CPA.
Schools (NCES district)
- District
- Marble City
- NCES district ID
- 4018960
- Math proficiency
- 20% ▼ -10.00%
- Reading proficiency
- 11% ▼ -9.00%
- Median HH income
- $36,384
- Composite
- 16.33/100
- National rank
- #14266
- State rank
- #469 of 513 in OK
Livability — Marble City
- Score
- 54/100
- State rank
- #580
- US rank
- #23845
Category grades
Schools grade is shown separately in the Schools card above.
Census & demographics
- Census place
- Marble City, OK
- City population
- 161
- Population (ZIP)
- 161
Population outlook (Sequoyah County) Hauer SSP2
- Today (2025)
- 39,398 people
- By 2030
- 38,215 · -3.0%
- By 2040
- 35,625 · -9.6%
- By 2050
- 32,943 · -16.4%
- By 2075
- 27,805 · -29.4%
- By 2100
- 23,311 · -40.8%
Race, ethnicity, and origin ACS 2023
- Neighborhood character
- Highly diverse neighborhood (Simpson 0.88)
- Race & ethnicity
- Native American 50% White 35% Two or more races 14%
Political lean MEDSL · Sequoyah
- 2024 margin
- Solid R (+61.5) · D 18.6% · R 80.2% · Other 1.2%
- 2008→2024 swing
- -25.5pp toward R · 2008: -36.0pp · 2024: -61.5pp
- All cycles
- 2024: R+61.5 2020: R+59.0 2016: R+54.2 2012: R+39.1 2008: R+36.0
Not yet ingested
- Civics
- —
Market trends
- HPI YoY
- —
- Current HPI
- —
- Rent YoY
- —
- Metro
- —
- State GDP YoY
- ▲ 1.55%
- F500 in state
- 6
Industry mix (Fortune 500 HQ in OK)
| Industry | F500 HQs | Revenue |
|---|---|---|
| Energy | 3 | $48B |
|
||
Price history
1 event — show timeline
- 2026-04-06 Listed $95,700 WRVBOR
Property tax history
+2.7%/yrLatest (2025): $187 · +5.1% YoY. Source: county tax records.
Cash-flow waterfall
monthlySold comps — $/sqft
last 12 mo · ≤1 miLoading sold comps…