350 N George Washington Blvd #9 · Yuba City, CA
Flood risk No data
- FEMA flood zone
- —
- Chance of flooding over 30 yrs
- —
- Est. flood insurance / yr
- —
Fire risk No data
- Est. fire insurance / yr
- —
Heat risk No data
- Hot days now (above threshold)
- —
- Hot days in 30 yrs
- —
Wind risk No data
- Chance of severe wind over 30 yrs
- —
Air-quality risk No data
- Unhealthy air days now
- —
- Unhealthy air days in 30 yrs
- —
Risk factors via First Street. Map © Google.
Why this score? — see what drove the D- grade
The composite is a weighted blend of 9 inputs, each scored 0–100. Each bar is that input's sub-score; the figure is the points it added to the 100-point composite (weight × sub-score).
- Cash flow +15.0/30.0
- 1% rule +5.0/10.0
- DSCR +5.0/10.0
- Schools +4.2/10.0
- Livability +3.8/5.0
- Rent growth +2.5/5.0
- Condition / age +2.5/5.0
- ARV discount +0.0/15.0
- Appreciation +0.0/10.0
$34,000
🖨 Deal sheet 📄 Offer letter ✓ Due diligence
Listing remarks
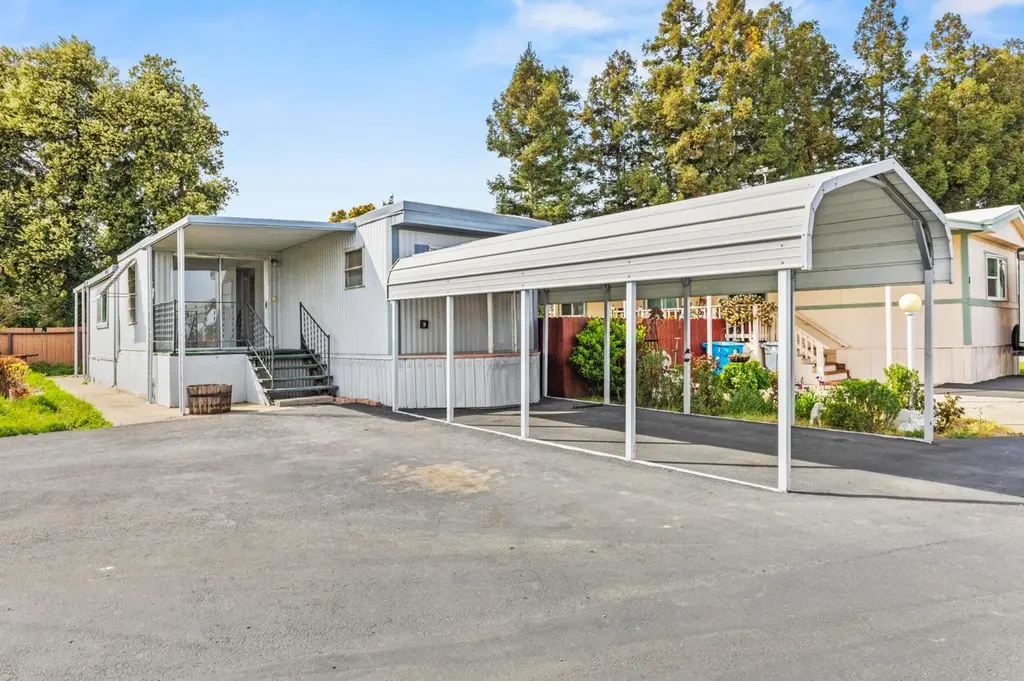
Discover the potential awaiting at 350 N George Washington Blvd #9, Yuba City, CA, a 55+ mobile home community in Sutter County. The kitchen can be a central point for gathering and creating in your new home. The patio provides an outdoor extension of your living space, a place to enjoy the California sunshine and fresh air. This mobile home offers a unique chance to shape your dreams into reality.
Key facts
- Parking
- Built 1967
- Listed 41 days
Property features AI
Finance
- Other: Located at 350 N George Washington Blvd #9, Yuba City, CA 95993; Park located on the corner of George Washington and Franklin
- HOA & community: No homeowners association; Located in a senior community; No land lease
Exterior
- Parking: Covered parking, no garage
- Utilities: Cable available; Natural gas connected; Public water; Public sewer; 220 volts in laundry
- Home design: Manufactured in park (single wide); Fixer condition; Made by Fleetwood; Built in 1967
- Construction: Wood skirting; Foam roof
- Exterior features: Garden; Shed(s)
Interior
- Kitchen: Free-standing gas range; Free-standing refrigerator; Hood over range; Ice maker; Dishwasher; Microwave; Stone and laminate countertops; Dining space in kitchen
- Bedrooms: 2 bedrooms
- Flooring: Carpet; Vinyl; Wood
- Bathrooms: 1 full bathroom; Tub with shower over
- Heating & cooling: Central heating; Wall and window cooling units
- Interior features: Great room living area; Porch with steps; Window coverings; Unfurnished
- Laundry & utility: Interior laundry room with hookups; Electric laundry; 220-volt outlet in laundry
Neighborhood map
What this means for you Summary
Snapshot
- This is a 2-bed/1.0-bath manufactured listed at $34k.
Deal economics
- At list price, monthly cash flow is $1k ($14k/yr) — positive.
- The deal already cash-flows at list — no discount required.
- Meets the 1% rule at list price ($2k rent vs $34k).
- Recommended offer: $33k (3.0% below list) — sets the bar for market timing.
- Cap rate 46.4% vs local median 3.6% in Yuba City — top-decile yield for the area; either an underpriced asset or a hidden risk that comps aren't pricing in. Stress-test before assuming the spread holds.
Location & tenants
- Location reads 75/100 on livability (#111 in CA, #3,863 nationally) — a middle-class / working-renter tenant base. Strengths: commute A+, housing A+, health & safety A+; Watch: crime D+, schools D, cost of living F.
- Sutter Union High (rural): math 30% / reading 60% proficiency, ranked #526 of 1,400 in CA (top 38%) — families likely to look elsewhere, expect single-tenant / working-renter base with shorter leases.
- Market conditions: 176 active listings in the ZIP; solid renter incomes; 73 units permitted in Sutter County in 2024 (0 in 5+ unit buildings).
Forward outlook
- Local home prices are declining (-3.0%/yr); year-one equity from $235 of loan paydown is wiped out by about $1k of value loss. Plan a longer hold.
- Sutter County population projected to shrink 4% by 2050 — rents likely to lag national; underwrite the cash flow, not the appreciation.
- At projected returns (-3.0% appreciation + 3.0% rent growth), your $10k cash investment doubles in ~1 year — after that, you're playing with house money.
Negotiation context
- It's been on market 41 days — a 3% lower offer ($33k) is reasonable based on typical stale-listing flexibility.
Questions for the listing agent
- It's been on market 41 days. Have you received any prior offers? Is the seller open to a 3% concession, seller financing, or rate buy-down credit?
- Built in 1967 — when were the roof, HVAC, electrical panel, plumbing, and water heater last replaced?
- Is there a deadline driving the sale (1031 exchange, divorce, estate, relocation)? That informs how much negotiation room exists.
- Schools are D-rated, which usually means shorter tenancies and higher turnover. Who's the typical renter profile here, and what's been the actual vacancy rate?
- Crime grade is D in this area — have there been break-ins, vandalism, or insurance claims at this property in the last 3 years? What carrier currently insures it and at what premium?
- The area grade is low — what's the realistic commute time and amenity access for the typical tenant pool here? Any planned neighborhood developments (good or bad) we should know about?
- What's the average days-on-market for RENTAL listings here right now (not sales)? A rising rental-DOM trend means longer vacancies and softer asking-rent achievability than the comps imply.
- What's the recent tenant-quality profile in this submarket — average credit score on applications, eviction rate, late-payment / NSF rate, and stable-employment percentage? A property-management company in the area should have these aggregated.
- How much new for-sale + rental construction is in the pipeline within 1–3 miles? Heavy new supply typically softens prices + rents 12–24 months out; constrained supply supports both.
Investment metrics
- 1% rule
- 5.11% ✓
- Cap rate
- 46.40%
- Cash-on-cash
- 143.26%
- DSCR
- 7.37
- GRM
- 1.6
CMA / ARV
- ARV (on-the-fly)
- $27,846
- Comps found
- 1
Show comp detail 1 sale within ~0.75 mi
| Address | Dist | Beds/Ba | Sqft | Sold | Price | $/sf | Match |
|---|---|---|---|---|---|---|---|
| 350 N George Washington Blvd #9 | 0.00mi | 2/1.0 | 546 (0%) | 0mo | $28,000 | $51 | 100 |
Match score weights: distance 35% · size 25% · config 20% · recency 20%. Top-matched comps best support the ARV.
Projected returns pro-forma
-3.0% appreciation · 3.0% rent growth · sell at horizon
- IRR
- —
- Equity multiple
- 8.03×
- Total profit
- $66,901
- Equity at exit
- $5,070
- IRR
- —
- Equity multiple
- 16.92×
- Total profit
- $151,570
- Equity at exit
- $2,940
Cash invested: $9,520 (down + closing). Projections, not guarantees.
Landlord ↔ Tenant lean methodology
- Overall (STATE)
- 18 Strongly Tenant-Friendly
- State California
- 18 Strongly Tenant-Friendly · D+13
- County
- — inherits STATE
- City
- — inherits STATE
ZIP-level market 95993
- Active inventory
- 176
- Price-to-rent
- 1.6×
Monthly cashflow live
- Estimated rent
- $1,736 medium interval (Pro) →
- Mortgage (P&I)
- −$178
- Tax est. 1.5%
- −$42 /mo · $510/yr
- Insurance
- −$14
- HOA
- −$0
- Vacancy / Maint / Mgmt
- −$365
- Net cashflow
- $1,137
Break-even live
UW: 25.0% down · 7.5% · 30yr · 1.5% tax · 5.0% vac · 8.0% maint · 8.0% mgmt
Financing live
Cash to close
- Down payment
- $8,500
- Closing costs
- $1,020
- Reserves months
- —
- Total cash needed
- —
Loan-product check · same deal, 3 products live
Conventional
25% down · 7.5% · 30yr
- Down + closing
- —
- Monthly P&I
- —
- Monthly cashflow
- —
- DSCR
- —
- Eligible?
- —
Personal DTI + credit; lowest rate.
DSCR
20% down · 8.5% · 30yr
- Down + closing
- —
- Monthly P&I
- —
- Monthly cashflow
- —
- DSCR
- —
- Eligible?
- —
No personal income docs; deal must DSCR.
Hard money
10% down · 12.0% · 12mo
- Down + closing
- —
- Monthly P&I
- —
- Monthly cashflow
- —
- DSCR
- —
- Eligible?
- —
Short-term bridge; refi at stabilization.
Listing history 4 events
-
2026-06-02status $34,000 Pending 41 DOM
-
2026-06-01days on market $34,000 Active 41 DOM
-
2026-05-31days on market $34,000 Active 40 DOM
-
2026-05-30days on market $34,000 Active 39 DOM
ⓘ Source: listings_history table (triggers on properties + properties_extension) + one-shot
backfill from property_details.listing_events for pre-trigger history.
Nearby sold comps map
Loading sold comps map…
Walkable amenities ~0.75 mi
Loading nearby amenities…
Taxation est. · year 1
- Rental income
- $20,832
- − Mortgage interest
- −$1,905
- − Property taxes
- −$510
- − Insurance
- −$170
- − Repairs & maintenance
- −$1,667
- − Management
- −$1,667
- − Depreciation
- −$989
- Taxable income
- $13,926
- Est. tax owed @ 24.0%
- −$3,342
- After-tax cash flow
- $10,296/yr
For passive investors: Depreciation is non-cash, so a rental often shows a tax loss while cash-flowing — sheltering income. Rental losses are passive: they offset passive income freely, and up to $25,000/yr can offset ordinary (W-2) income if you actively participate and your MAGI is under $100k (phasing out to $0 by $150k); unused losses carry forward. On sale, claimed depreciation is recaptured at up to 25%, and gains may owe capital-gains tax (a 1031 exchange can defer both). Figures are a year-1 estimate at your 24.0% rate — not tax advice; consult a CPA.
Schools (NCES district)
- District
- Sutter Union High
- NCES district ID
- 0638610
- Math proficiency
- 30% ▲ 5.00%
- Reading proficiency
- 60% ▲ 5.00%
- Median HH income
- $66,773
- Composite
- 42.4/100
- National rank
- #6913
- State rank
- #526 of 1400 in CA
Livability — Yuba City
- Score
- 75/100
- State rank
- #111
- US rank
- #3863
Category grades
Schools grade is shown separately in the Schools card above.
Census & demographics
- Census place
- Yuba City, CA
- County
- Sutter County · 81,625 people
- City population
- 81,625
- Metro
- Yuba City, CA
- Population (ZIP)
- 39,046
- Household income
- $93,763
- Rent vs Own
- Severe rent burden
- 738.0
Population outlook (Sutter County) Hauer SSP2
- Today (2025)
- 97,244 people
- By 2030
- 97,170 · -0.1%
- By 2040
- 96,137 · -1.1%
- By 2050
- 93,604 · -3.7%
- By 2075
- 85,008 · -12.6%
- By 2100
- 71,584 · -26.4%
Race, ethnicity, and origin ACS 2023
- Neighborhood character
- Diverse neighborhood (Simpson 0.68)
- Race & ethnicity
- White 45% Asian 25% Hispanic / Latino 23% Two or more races 12% Black 1%
- Hispanic origin (detail)
- Mexican 21%
- Common ancestry
- Slovak 2% Italian 1% Russian 1%
- Foreign-born
- 23% · Canada, Vietnam
- Languages at home
- 65% English-only · Other Indo-European 20% Spanish 12% Other Asian/Pacific 1%
Political lean MEDSL · Sutter
- 2024 margin
- Solid R (+31.4) · D 33.1% · R 64.5% · Other 2.4%
- 2008→2024 swing
- -14.7pp toward R · 2008: -16.7pp · 2024: -31.4pp
- All cycles
- 2024: R+31.4 2020: R+16.4 2016: R+16.3 2012: R+21.8 2008: R+16.7
Not yet ingested
- Civics
- —
Market trends
- HPI YoY
- ▼ -280.05%
- Current HPI
- 210.9131
- Rent YoY
- —
- Metro
- Yuba City, CA
- State GDP YoY
- ▲ 3.21%
- F500 in state
- 116
Industry mix (Fortune 500 HQ in CA)
| Industry | F500 HQs | Revenue |
|---|---|---|
| Technology | 27 | $1,492B |
|
||
| Financial Services | 3 | $174B |
|
||
| Retail | 3 | $44B |
|
||
| Insurance | 3 | $26B |
|
||
| Media / Entertainment | 2 | $115B |
|
||
| Pharmaceuticals / Biotech | 2 | $62B |
|
||
Cash-flow waterfall
monthlySold comps — $/sqft
last 12 mo · ≤1 miLoading sold comps…