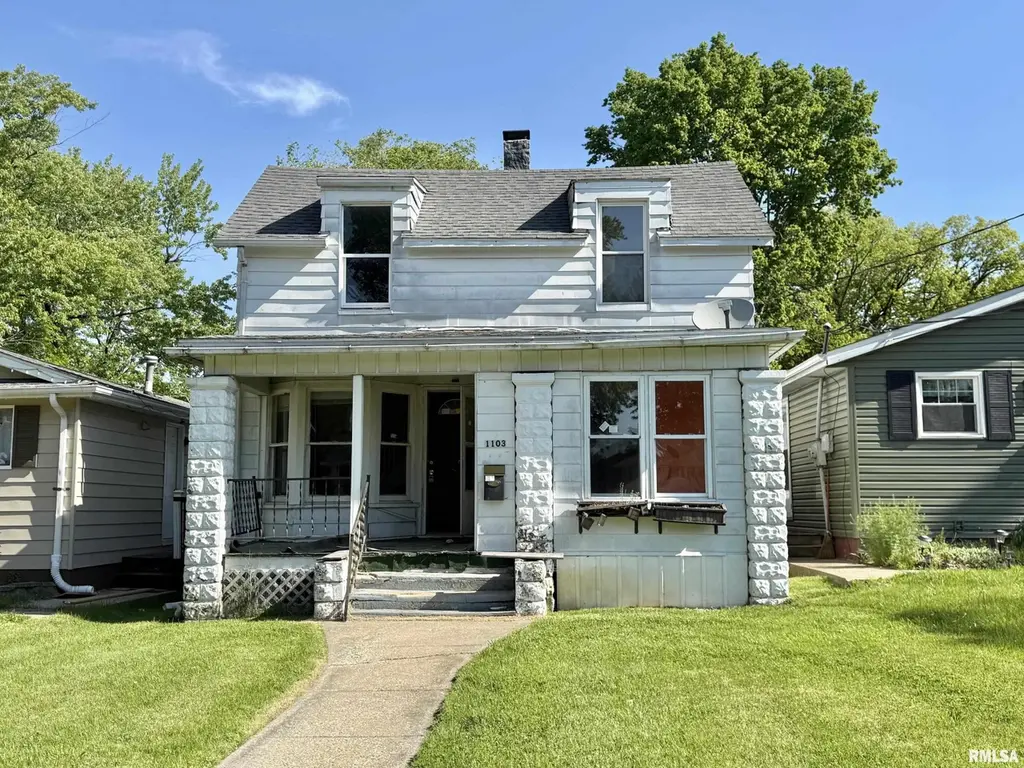
1103 E Maywood Ave · Peoria, IL
Flood risk 1/10 · Minimal
- FEMA flood zone
- X
- Chance of flooding over 30 yrs
- 0.0%
- Est. flood insurance / yr
- $473 – $860
Fire risk 1/10 · Minimal
- Est. fire insurance / yr
- $804 – $1,492
Heat risk 3/10 · Minor
- Hot days now (above 105°F)
- 7 days/yr
- Hot days in 30 yrs
- 18 days/yr
Wind risk 2/10 · Minimal
- Chance of severe wind over 30 yrs
- 1.0%
Air-quality risk 3/10 · Minor
- Unhealthy air days now
- 1 days/yr
- Unhealthy air days in 30 yrs
- 3 days/yr
Risk factors via First Street. Map © Google.
Why this score? — see what drove the B- grade
The composite is a weighted blend of 9 inputs, each scored 0–100. Each bar is that input's sub-score; the figure is the points it added to the 100-point composite (weight × sub-score).
- Cash flow +30.0/30.0
- 1% rule +10.0/10.0
- DSCR +10.0/10.0
- ARV discount +7.5/15.0
- Livability +3.7/5.0
- Rent growth +3.4/5.0
- Condition / age +2.5/5.0
- Schools +1.1/10.0
- Appreciation +0.0/10.0
$29,900
🖨 Deal sheet 📄 Offer letter ✓ Due diligence
Listing remarks
Fixer upper with lots of potential. 3 bed with one on the main floor. 2 car garage with alley access in rear. Sunroom 10 Day Exposure Period: PNC Bank prefers that properties receive a minimum of 10 days exposure to the market before considering purchase offers. However, this isn't a requirement and purchase offers may be accepted anytime by the Seller. If you do not, however, receive a response to a submitted offer, it may be that the property is new to the market and the seller is allowing for market exposure.
Key facts
- Alley access
- Sunroom
- 3,920 sq ft lot
Tags
Property features AI
Exterior
- Parking: Detached 2-car garage
- Security: No specific security features reported
- Utilities: Public water; Public sewer
- Home design: Single family residence; Two levels
- Construction: Built in 1920
- Exterior features: Level lot; Paved road access; Shingle roof
Interior
- Kitchen: Kitchen on main level
- Bedrooms: 3 bedrooms (Bedroom 1 on main level, Bedroom 2 on upper level, Bedroom 3 on upper level); Egress windows in bedrooms
- Flooring: Hardwood flooring in two upper-level bedrooms; Carpet in primary bedroom, living room and sunroom; Laminate flooring in kitchen
- Bathrooms: 1 full bathroom
- Heating & cooling: Forced air heating; Central air conditioning
- Interior features: Full unfinished basement; No fireplaces reported
- Laundry & utility: Utility/laundry locations not specified
Neighborhood map
What this means for you Summary
Snapshot
- This is a 3-bed/1.0-bath single-family listed at $30k.
Deal economics
- At list price, monthly cash flow is $646 ($8k/yr) — positive.
- The deal already cash-flows at list — no discount required.
- Meets the 1% rule at list price ($1k rent vs $30k).
- Recommended offer: $29k (1.5% below list) — sets the bar for market timing.
- Cap rate 32.2% vs local median 5.6% in Peoria — top-decile yield for the area; either an underpriced asset or a hidden risk that comps aren't pricing in. Stress-test before assuming the spread holds.
Location & tenants
- Location reads 73/100 on livability (#270 in IL) — a middle-class / working-renter tenant base. Strengths: commute A+, cost of living A+, housing A+; Watch: employment D+, crime F.
- Peoria SD 150 (urban): math 11% / reading 14% proficiency, ranked #554 of 620 in IL (top 89%) — low school quality limits family demand, transient renter base, plan for 1-2y turnover; 70% free/reduced lunch — lower-income household profile, screen leases tightly.
- Zoned schools: Peoria High School (math 4% / reading 7%, grade F, #609 of 693 statewide, top 88%, 1,447 students, 0% FRL) — zoned schools average 0% FRL vs 70% district-wide (70 pts lower); this property's tenant base skews higher-income than the district average.
- Market conditions: Rents rising (+3.5%/yr); 104 active listings in the ZIP; 17 comparable units currently listed for rent nearby; rentals leasing fast (median 13d on market — plan ~1-2 weeks tenant-placement turnaround); lower-income renter base — watch delinquency; 73 units permitted in Peoria County in 2024 (0 in 5+ unit buildings).
- This rent runs 31% of the median local income ($42k/yr) — at the standard rent-burdened threshold; future hikes will face affordability resistance.
Forward outlook
- Local home prices are declining (-3.0%/yr); year-one equity from $207 of loan paydown is wiped out by about $897 of value loss. Plan a longer hold.
- Peoria County population projected at -11% by 2050 — secular population decline; favor cash flow + early exit over multi-decade hold.
- At projected returns (-3.0% appreciation + 3.5% rent growth), your $8k cash investment doubles in ~2 years — after that, you're playing with house money.
Negotiation context
- It's been on market 21 days — a 2% lower offer ($29k) is reasonable based on typical stale-listing flexibility.
- 3 sale attempts since 23y ago with the ask held roughly flat each time — persistent listings suggest the price (not the market) is what's stuck; bring a comps-based counter.
Risks & watch-outs
- Watch-outs: built in 1920 — expect roof / HVAC / electrical / plumbing capex.
Questions for the listing agent
- Built in 1920 — when were the roof, HVAC, electrical panel, plumbing, and water heater last replaced?
- Is there a deadline driving the sale (1031 exchange, divorce, estate, relocation)? That informs how much negotiation room exists.
- Schools are F-rated, which usually means shorter tenancies and higher turnover. Who's the typical renter profile here, and what's been the actual vacancy rate?
- Crime grade is F in this area — have there been break-ins, vandalism, or insurance claims at this property in the last 3 years? What carrier currently insures it and at what premium?
- What's the average days-on-market for RENTAL listings here right now (not sales)? A rising rental-DOM trend means longer vacancies and softer asking-rent achievability than the comps imply.
- What's the recent tenant-quality profile in this submarket — average credit score on applications, eviction rate, late-payment / NSF rate, and stable-employment percentage? A property-management company in the area should have these aggregated.
- How much new for-sale + rental construction is in the pipeline within 1–3 miles? Heavy new supply typically softens prices + rents 12–24 months out; constrained supply supports both.
Investment metrics
- 1% rule
- 3.61% ✓
- Cap rate
- 32.24%
- Cash-on-cash
- 92.66%
- DSCR
- 5.12
- GRM
- 2.3
CMA / ARV
- ARV (median comp)
- $78,555
- List price
- $29,900
- Delta
- -61.94%
- Verdict
- UNDERPRICED
- Comps
- 20 within 1.0 mi
Show comp detail 12 sales within ~0.75 mi
| Address | Dist | Beds/Ba | Sqft | Sold | Price | $/sf | Match |
|---|---|---|---|---|---|---|---|
| 1002 E Willcox Ave | 0.17mi | 3/2.0 | 1,023 (-7%) | 1mo | $89,000 | $87 | 75 |
| 924 E Maywood Ave | 0.12mi | 2/1.0 (-1) | 1,000 (-9%) | 3mo | $70,000 | $70 | 71 |
| 718 E London Ave | 0.50mi | 2/1.0 (-1) | 1,103 (-0%) | 1mo | $67,000 | $61 | 70 |
| 222 E Odell Pl | 0.65mi | 3/1.0 | 1,088 (-1%) | 1mo | $98,000 | $90 | 67 |
| 1118 E London Ave | 0.48mi | 2/2.0 (-1) | 1,116 (+1%) | 2mo | $139,900 | $125 | 66 |
| 1015 E Fairoaks Ave | 0.32mi | 3/2.0 | 1,200 (+9%) | 3mo | $148,000 | $123 | 64 |
| 1026 E Richwoods Blvd | 0.26mi | 4/1.5 (+1) | 1,226 (+11%) | 1mo | $132,000 | $108 | 62 |
| 315 E Elmhurst Ave | 0.59mi | 3/1.5 | 1,046 (-5%) | 1mo | $111,000 | $106 | 60 |
| 624 E Paris Ave | 0.60mi | 2/1.0 (-1) | 1,074 (-3%) | 2mo | $67,000 | $62 | 60 |
| 2206 N Wisconsin Ave | 0.63mi | 3/2.0 | 1,217 (+10%) | 0mo | $30,000 | $25 | 49 |
| 603 E Thrush Ave | 0.73mi | 3/1.0 | 960 (-13%) | 3mo | $30,000 | $31 | 42 |
| 606 E Arcadia Ave | 0.70mi | 4/1.0 (+1) | 962 (-13%) | 2mo | $38,000 | $40 | 39 |
Match score weights: distance 35% · size 25% · config 20% · recency 20%. Top-matched comps best support the ARV.
Projected returns pro-forma
-3.0% appreciation · 3.49% rent growth · sell at horizon
- IRR
- 94.0%
- Equity multiple
- 5.41×
- Total profit
- $36,879
- Equity at exit
- $4,458
- IRR
- 96.9%
- Equity multiple
- 11.44×
- Total profit
- $87,413
- Equity at exit
- $2,585
Cash invested: $8,372 (down + closing). Projections, not guarantees.
Landlord ↔ Tenant lean methodology
- Overall (STATE)
- 43 Moderately Tenant-Leaning
- State Illinois
- 43 Moderately Tenant-Leaning · D+7
- County
- — inherits STATE
- City
- — inherits STATE
ZIP-level market 61603
- Home prices YoY
- -31.8%
- Rents YoY
- 3.5%
- Active inventory
- 104
- Price-to-rent
- 2.3×
Monthly cashflow live
- Estimated rent
- $1,080 high interval (Pro) →
- Mortgage (P&I)
- −$157
- Tax est. 1.5%
- −$37 /mo · $448/yr
- Insurance
- −$12
- HOA
- −$0
- Vacancy / Maint / Mgmt
- −$227
- Net cashflow
- $646
Break-even live
UW: 25.0% down · 7.5% · 30yr · 1.5% tax · 5.0% vac · 8.0% maint · 8.0% mgmt
Financing live
Cash to close
- Down payment
- $7,475
- Closing costs
- $897
- Reserves months
- —
- Total cash needed
- —
Loan-product check · same deal, 3 products live
Conventional
25% down · 7.5% · 30yr
- Down + closing
- —
- Monthly P&I
- —
- Monthly cashflow
- —
- DSCR
- —
- Eligible?
- —
Personal DTI + credit; lowest rate.
DSCR
20% down · 8.5% · 30yr
- Down + closing
- —
- Monthly P&I
- —
- Monthly cashflow
- —
- DSCR
- —
- Eligible?
- —
No personal income docs; deal must DSCR.
Hard money
10% down · 12.0% · 12mo
- Down + closing
- —
- Monthly P&I
- —
- Monthly cashflow
- —
- DSCR
- —
- Eligible?
- —
Short-term bridge; refi at stabilization.
Rent comps 17 comps
| Address | Beds | Baths | Sqft | Rent | $/sqft | DOM | Units | Dist |
|---|---|---|---|---|---|---|---|---|
| 737 E Gift Ave Unit 737 Peoria, IL | 2.0 | 1.0 | 800 | $1,125 | $1.41 | 43d | 1 | 0.37mi |
| 505 E Virginia Ave Peoria, IL | 2.0 | 2.0 | 1204 | $758 | $0.63 | 13d | 1 | 0.59mi |
| 2121 N Prospect Rd Peoria, IL | 3.0 | 1.0 | 946 | $802 | $0.85 | 13d | 1 | 0.67mi |
| 308 E Archer Ave Peoria, IL | 3.0 | 1.0 | 1444 | $950 | $0.66 | 13d | 1 | 0.78mi |
| 3912 N Atlantic Ave Peoria Heights, IL | 2.0 | 1.0 | 825 | $1,100 | $1.33 | 43d | 1 | 0.84mi |
| 2210 Knoxville Ave #2212 Peoria, IL | 2.0 | 1.0 | 1284 | $950 | $0.74 | 43d | 1 | 0.94mi |
| 526 Fairholm Ave Peoria, IL | 3.0 | 2.0 | 1174 | $925 | $0.79 | 43d | 1 | 0.98mi |
| 2302 NE Monroe St Peoria, IL | 3.0 | 1.0 | 1100 | $875 | $0.80 | 13d | 1 | 1.06mi |
| 813 E Sciota Ave Peoria Heights, IL | 2.0 | 2.0 | 800 | $1,400 | $1.75 | 13d | 1 | 1.20mi |
| 506 Caroline St Unit B Peoria, IL | 2.0 | 1.0 | 1000 | $900 | $0.90 | 13d | 1 | 1.26mi |
| 126 E Lake Ave Peoria, IL | 2.0 | 1.0 | 950 | $1,050 | $1.11 | 13d | 9 | 1.31mi |
| 228 E Oak Cliff Ct Unit A2 Peoria, IL | 2.0 | 1.0 | 1000 | $1,050 | $1.05 | 13d | 1 | 1.32mi |
| 905 E Marietta Ave Unit A Peoria Heights, IL | 2.0 | 2.0 | 1200 | $1,600 | $1.33 | 13d | 1 | 1.33mi |
| 901 NE Glen Oak Ave Unit 2 Peoria, IL | 3.0 | 1.0 | 1120 | $1,200 | $1.07 | 20d | 1 | 1.34mi |
| 2207 N Ellis St Peoria, IL | 2.0 | 1.0 | 864 | $999 | $1.16 | 13d | 1 | 1.37mi |
| 814 W McClure Ave Peoria, IL | 3.0 | 1.0 | 1148 | $1,100 | $0.96 | 43d | 1 | 1.46mi |
| 812 W Macqueen Ave Peoria, IL | 2.0 | 1.0 | 822 | $795 | $0.97 | 43d | 1 | 1.47mi |
Listing history 13 events
-
2026-06-03status $29,900 Pending 21 DOM
-
2026-06-02days on market $29,900 Active 21 DOM
-
2026-06-01days on market $29,900 Active 20 DOM
-
2026-05-31days on market $29,900 Active 19 DOM
-
2026-05-30days on market $29,900 Active 18 DOM
-
2026-05-12$29,900 Active 521-char remark
-
2021-08-06historical
-
2021-08-06historical
-
2005-11-03soldstatus $68,000
-
2005-10-28soldstatus $68,000
-
2005-07-29$69,900
-
2003-03-10soldstatus $23,500
-
2003-02-13$23,900
ⓘ Source: listings_history table (triggers on properties + properties_extension) + one-shot
backfill from property_details.listing_events for pre-trigger history.
Climate risk First Street
- Flood 1/10 Low FEMA zone X · 0% chance over 30 yrs
- Wildfire 1/10 Low
- Heat 3/10 Moderate 7 d/yr ≥105°F today · 18 d/yr by 30 yrs out
- Wind 2/10 Low 100% chance of damaging wind over 30 yrs
- Air quality 3/10 Moderate 1 unhealthy d/yr today · 3 by 30 yrs out
Nearby sold comps map
Loading sold comps map…
Walkable amenities ~0.75 mi
Loading nearby amenities…
Taxation est. · year 1
- Rental income
- $12,958
- − Mortgage interest
- −$1,675
- − Property taxes
- −$448
- − Insurance
- −$150
- − Repairs & maintenance
- −$1,037
- − Management
- −$1,037
- − Depreciation
- −$870
- Taxable income
- $7,742
- Est. tax owed @ 24.0%
- −$1,858
- After-tax cash flow
- $5,899/yr
For passive investors: Depreciation is non-cash, so a rental often shows a tax loss while cash-flowing — sheltering income. Rental losses are passive: they offset passive income freely, and up to $25,000/yr can offset ordinary (W-2) income if you actively participate and your MAGI is under $100k (phasing out to $0 by $150k); unused losses carry forward. On sale, claimed depreciation is recaptured at up to 25%, and gains may owe capital-gains tax (a 1031 exchange can defer both). Figures are a year-1 estimate at your 24.0% rate — not tax advice; consult a CPA.
Schools (NCES district)
- District
- Peoria SD 150
- NCES district ID
- 1731230
- Math proficiency
- 11% ▼ -5.00%
- Reading proficiency
- 14% ▼ -4.00%
- Median HH income
- $41,951
- Composite
- 10.92/100
- National rank
- #9751
- State rank
- #554 of 620 in IL
Livability — Peoria
- Score
- 73/100
- State rank
- #270
- US rank
- #5096
Category grades
Schools grade is shown separately in the Schools card above.
Census & demographics
- Census place
- Peoria, IL
- County
- Peoria County · 120,495 people
- City population
- 114,670
- Metro
- Peoria, IL
- Population (ZIP)
- 15,356
- Household income
- $41,618
- Rent vs Own
- Severe rent burden
- 849.0
Population outlook (Peoria County) Hauer SSP2
- Today (2025)
- 183,007 people
- By 2030
- 179,643 · -1.8%
- By 2040
- 171,782 · -6.1%
- By 2050
- 163,508 · -10.7%
- By 2075
- 140,178 · -23.4%
- By 2100
- 114,493 · -37.4%
Race, ethnicity, and origin ACS 2023
- Neighborhood character
- Diverse neighborhood (Simpson 0.68)
- Race & ethnicity
- Black 43% White 36% Two or more races 12% Hispanic / Latino 10% Asian 1%
- Hispanic origin (detail)
- Mexican 7%
- Common ancestry
- Italian 2% Slovak 1% Lithuanian 1%
- Foreign-born
- 7% · Canada
- Languages at home
- 91% English-only · Spanish 6% Tagalog/Filipino 1%
Political lean MEDSL · Peoria
- 2024 margin
- Toss-up / Even · D 51.5% · R 46.9% · Other 1.6%
- 2008→2024 swing
- -9.2pp toward R · 2008: 13.9pp · 2024: 4.7pp
- All cycles
- 2024: D+4.7 2020: D+6.3 2016: D+2.8 2012: D+4.4 2008: D+13.9
Not yet ingested
- Civics
- —
Market trends
- HPI YoY
- ▼ -65.98%
- Current HPI
- 141.5343
- Rent YoY
- ▲ 3.49%
- Metro
- Peoria, IL
- State GDP YoY
- ▲ 1.59%
- F500 in state
- 60
Industry mix (Fortune 500 HQ in IL)
| Industry | F500 HQs | Revenue |
|---|---|---|
| Insurance | 4 | $201B |
|
||
| Consumer Goods | 4 | $87B |
|
||
| Industrial Machinery | 3 | $64B |
|
||
| Healthcare | 2 | $55B |
|
||
| Retail / Pharmacy | 1 | $148B |
|
||
| Agriculture / Food | 1 | $86B |
|
||
Price history
+25.1% since first listed9 events — show timeline
- 2026-06-02 Pending — RMLSA as Distributed by MLS Grid
- 2026-05-12 Listed $29,900 RMLSA as Distributed by MLS Grid
- 2021-08-06 Listing Removed — RMLSA as Distributed by MLS Grid
- 2021-08-06 Listing Removed — RMLSA as Distributed by MLS Grid
- 2005-11-03 Sold (Public Records) $68,000 Public Records
- 2005-10-28 Sold (MLS) $68,000 RMLSA as Distributed by MLS Grid
- 2005-07-29 Listed $69,900 RMLSA as Distributed by MLS Grid
- 2003-03-10 Sold (MLS) $23,500 RMLSA as Distributed by MLS Grid
- 2003-02-13 Listed $23,900 RMLSA as Distributed by MLS Grid
Property tax history
+2.5%/yrLatest (2025): $1,705 · +9.5% YoY. Source: county tax records.
Cash-flow waterfall
monthlySold comps — $/sqft
last 12 mo · ≤1 miLoading sold comps…