 🏗️ New Construction
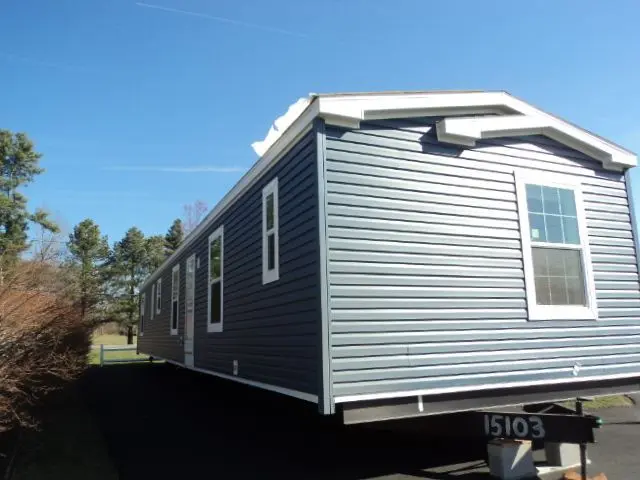
Champion 80 D & R Village Plan · Clifton Gardens, NY
Flood risk 1/10 · Minimal
- FEMA flood zone
- X
- Chance of flooding over 30 yrs
- 0.0%
- Est. flood insurance / yr
- $507 – $1,088
Fire risk 4/10 · Minor
- Est. fire insurance / yr
- $691 – $1,283
Heat risk 3/10 · Minor
- Hot days now (above 96°F)
- 7 days/yr
- Hot days in 30 yrs
- 16 days/yr
Wind risk 3/10 · Minor
- Chance of severe wind over 30 yrs
- 5.0%
Air-quality risk 2/10 · Minimal
- Unhealthy air days now
- 0 days/yr
- Unhealthy air days in 30 yrs
- 1 days/yr
Risk factors via First Street. Map © Google.
Why this score? — see what drove the B grade
The composite is a weighted blend of 9 inputs, each scored 0–100. Each bar is that input's sub-score; the figure is the points it added to the 100-point composite (weight × sub-score).
- Cash flow +30.0/30.0
- 1% rule +10.0/10.0
- DSCR +10.0/10.0
- ARV discount +7.5/15.0
- Schools +6.5/10.0
- Condition / age +4.0/5.0
- Rent growth +3.7/5.0
- Livability +2.5/5.0
- Appreciation +0.0/10.0
$127,349
🖨 Deal sheet 📄 Offer letter ✓ Due diligence
Listing remarks MLS
SALE PENDING! Coming Spring 2026 - new home ordered will arrive in April 2026.
Key facts
- Listed 108 days
Neighborhood map
What this means for you Summary
Snapshot
- This is a 3-bed/2.0-bath manufactured listed at $127k. Condition is rated good.
Deal economics
- At list price, monthly cash flow is $689 ($8k/yr) — positive.
- The deal already cash-flows at list — no discount required.
- Meets the 1% rule at list price ($2k rent vs $127k).
- Recommended offer: $116k (9.0% below list) — sets the bar for market timing.
- Cap rate 12.8% vs local median 3.3% in Clifton Gardens — top-decile yield for the area; either an underpriced asset or a hidden risk that comps aren't pricing in. Stress-test before assuming the spread holds.
Location & tenants
- Location reads: area grade B — affects rentability + tenant quality, not the cash-flow math above.
- Shenendehowa Central School District (suburban): math 72% / reading 73% proficiency, ranked #98 of 590 in NY (top 17%) — strong family-tenant draw, lease renewals of 3-5y typical; only 10% free/reduced lunch — higher-income household profile.
- Market conditions: Rents rising fast (+4.7%/yr); 265 active listings in the ZIP; 4 comparable units currently listed for rent nearby; rentals at typical pace (median 15d on market — plan ~3-4 weeks tenant-placement turnaround); high-income renter base; 1,132 units permitted in Saratoga County in 2024 (378 in 5+ unit buildings).
Forward outlook
- Local home prices are declining (-3.0%/yr); year-one equity from $881 of loan paydown is wiped out by about $4k of value loss. Plan a longer hold.
- Saratoga County population projected at +4% by 2050 — modest demand growth; plan on rents tracking national, not racing it.
- At projected returns (-3.0% appreciation + 4.7% rent growth), your $36k cash investment doubles in ~5 years — after that, you're playing with house money.
Negotiation context
- It's been on market 108 days — a 9% lower offer ($116k) is reasonable based on typical stale-listing flexibility.
Questions for the listing agent
- It's been on market 108 days. Have you received any prior offers? Is the seller open to a 9% concession, seller financing, or rate buy-down credit?
- Why hasn't it sold? Are there any deal-killer items the seller is aware of (foundation, flood, title, zoning, code violations)?
- Is there a deadline driving the sale (1031 exchange, divorce, estate, relocation)? That informs how much negotiation room exists.
- What's the average days-on-market for RENTAL listings here right now (not sales)? A rising rental-DOM trend means longer vacancies and softer asking-rent achievability than the comps imply.
- What's the recent tenant-quality profile in this submarket — average credit score on applications, eviction rate, late-payment / NSF rate, and stable-employment percentage? A property-management company in the area should have these aggregated.
- How much new for-sale + rental construction is in the pipeline within 1–3 miles? Heavy new supply typically softens prices + rents 12–24 months out; constrained supply supports both.
Investment metrics
- 1% rule
- 1.56% ✓
- Cap rate
- 12.79%
- Cash-on-cash
- 23.20%
- DSCR
- 2.03
- GRM
- 5.3
CMA / ARV
No comps found within radius.
Projected returns pro-forma
-3.0% appreciation · 4.65% rent growth · sell at horizon
- IRR
- 18.1%
- Equity multiple
- 1.75×
- Total profit
- $26,654
- Equity at exit
- $18,988
- IRR
- 27.7%
- Equity multiple
- 3.64×
- Total profit
- $94,098
- Equity at exit
- $11,011
Cash invested: $35,658 (down + closing). Projections, not guarantees.
Landlord ↔ Tenant lean methodology
- Overall (STATE)
- 15 Strongly Tenant-Friendly
- State New York
- 15 Strongly Tenant-Friendly · D+10
- County
- — inherits STATE
- City
- — inherits STATE
ZIP-level market 12065
- Rents YoY
- 4.7%
- Active inventory
- 265
- Price-to-rent
- 5.3×
Monthly cashflow live
- Estimated rent
- $1,987 medium interval (Pro) →
- Mortgage (P&I)
- −$668
- Tax est. 1.5%
- −$159 /mo · $1,910/yr
- Insurance
- −$53
- HOA
- −$0
- Vacancy / Maint / Mgmt
- −$417
- Net cashflow
- $689
Break-even live
UW: 25.0% down · 7.5% · 30yr · 1.5% tax · 5.0% vac · 8.0% maint · 8.0% mgmt
Financing live
Cash to close
- Down payment
- $31,837
- Closing costs
- $3,820
- Reserves months
- —
- Total cash needed
- —
Loan-product check · same deal, 3 products live
Conventional
25% down · 7.5% · 30yr
- Down + closing
- —
- Monthly P&I
- —
- Monthly cashflow
- —
- DSCR
- —
- Eligible?
- —
Personal DTI + credit; lowest rate.
DSCR
20% down · 8.5% · 30yr
- Down + closing
- —
- Monthly P&I
- —
- Monthly cashflow
- —
- DSCR
- —
- Eligible?
- —
No personal income docs; deal must DSCR.
Hard money
10% down · 12.0% · 12mo
- Down + closing
- —
- Monthly P&I
- —
- Monthly cashflow
- —
- DSCR
- —
- Eligible?
- —
Short-term bridge; refi at stabilization.
Rent comps 4 comps
| Address | Beds | Baths | Sqft | Rent | $/sqft | DOM | Units | Dist |
|---|---|---|---|---|---|---|---|---|
| 1688 U.S. 9 Clifton Park, NY | 1.0–2.0 | 1.0 | 750 | $1,840 | $2.45 | 14d | 10 | 0.91mi |
| 37 Squire Ln Clifton Park, NY | 1.0–2.0 | 1.0 | 857 | $1,761 | $2.05 | 14d | 5 | 1.06mi |
| 1 Lakeview Dr Clifton Park, NY | 1.0–3.0 | 1.0–2.0 | 1119 | $2,302 | $2.06 | 14d | 25 | 1.10mi |
| 147 Anthony Rd Halfmoon, NY | 3.0 | 1.0 | 1209 | $2,000 | $1.65 | 23d | 1 | 1.27mi |
Listing history 16 events
-
2026-06-18days on market $127,349 Active 108 DOM
-
2026-06-17days on market $127,349 Active 107 DOM
-
2026-06-16days on market $127,349 Active 106 DOM
-
2026-06-15days on market $127,349 Active 105 DOM
-
2026-06-14days on market $127,349 Active 103 DOM
-
2026-06-13days on market $127,349 Active 102 DOM
-
2026-06-10days on market $127,349 Active 100 DOM
-
2026-06-09days on market $127,349 Active 99 DOM
-
2026-06-08days on market $127,349 Active 98 DOM
-
2026-06-07days on market $127,349 Active 97 DOM
-
2026-06-03days on market $127,349 Active 93 DOM
-
2026-06-02days on market $127,349 Active 92 DOM
-
2026-06-01days on market $127,349 Active 91 DOM
-
2026-05-31days on market $127,349 Active 90 DOM
-
2026-05-31days on market $127,349 Active 89 DOM
-
2026-03-02$127,349 Active 78-char remark
Show marketing remark (78 chars)
SALE PENDING! Coming Spring 2026 - new home ordered will arrive in April 2026.
ⓘ Source: listings_history table (triggers on properties + properties_extension) + one-shot
backfill from property_details.listing_events for pre-trigger history.
Climate risk First Street
- Flood 1/10 Low FEMA zone X · 0% chance over 30 yrs
- Wildfire 4/10 Moderate
- Heat 3/10 Moderate 7 d/yr ≥96°F today · 16 d/yr by 30 yrs out
- Wind 3/10 Moderate 5% chance of damaging wind over 30 yrs
- Air quality 2/10 Low 0 unhealthy d/yr today · 1 by 30 yrs out
Nearby sold comps map
Loading sold comps map…
Walkable amenities ~0.75 mi
Loading nearby amenities…
Taxation est. · year 1
- Rental income
- $23,840
- − Mortgage interest
- −$7,134
- − Property taxes
- −$1,910
- − Insurance
- −$637
- − Repairs & maintenance
- −$1,907
- − Management
- −$1,907
- − Depreciation
- −$3,705
- Taxable income
- $6,641
- Est. tax owed @ 24.0%
- −$1,594
- After-tax cash flow
- $6,679/yr
For passive investors: Depreciation is non-cash, so a rental often shows a tax loss while cash-flowing — sheltering income. Rental losses are passive: they offset passive income freely, and up to $25,000/yr can offset ordinary (W-2) income if you actively participate and your MAGI is under $100k (phasing out to $0 by $150k); unused losses carry forward. On sale, claimed depreciation is recaptured at up to 25%, and gains may owe capital-gains tax (a 1031 exchange can defer both). Figures are a year-1 estimate at your 24.0% rate — not tax advice; consult a CPA.
Condition & rehab AI · 12 photos
This manufactured home is in excellent condition with new appliances, cabinets, countertops, and fixtures. It is move-in ready and has a good curb appeal.
Value-add opportunities
- Both Paint exterior and interior — Enhances curb appeal and interior aesthetics
- Both Install smart home devices — Improves energy efficiency and convenience
- Both Add smart thermostat — Saves energy and improves comfort
- Both Install smart lighting — Saves energy and enhances ambiance
Renovation cost estimate screening
Value-add ROI direction
- Both Paint exterior and interior — Enhances curb appeal and interior aesthetics ↑
- Both Install smart home devices — Improves energy efficiency and convenience ↑
- Both Add smart thermostat — Saves energy and improves comfort ↑
- Both Install smart lighting — Saves energy and enhances ambiance ↑
ⓘ Cost ranges are severity-bucket heuristics (US national rule-of-thumb). Get contractor quotes + a written scope before underwriting a rehab budget.
Schools (NCES district)
- District
- Shenendehowa Central School District
- NCES district ID
- 3626670
- Math proficiency
- 72% ▼ -6.00%
- Reading proficiency
- 73% ▲ 3.00%
- Median HH income
- $82,933
- Composite
- 64.59/100
- National rank
- #531
- State rank
- #98 of 590 in NY
Livability — Clifton Gardens
No livability data for this city. (Only ~50 U.S. cities are tracked.)
Census & demographics
- County
- Saratoga County · 166,192 people
- City population
- 44,726
- Metro
- Albany-Schenectady-Troy, NY
- Population (ZIP)
- 45,116
- Household income
- $113,873
- Rent vs Own
- Severe rent burden
- 1040.0
Population outlook (Saratoga County) Hauer SSP2
- Today (2025)
- 238,889 people
- By 2030
- 243,681 · +2.0%
- By 2040
- 249,118 · +4.3%
- By 2050
- 248,638 · +4.1%
- By 2075
- 241,675 · +1.2%
- By 2100
- 213,150 · -10.8%
Race, ethnicity, and origin ACS 2023
- Neighborhood character
- Predominantly White (81%)
- Race & ethnicity
- White 81% Asian 7% Two or more races 7% Hispanic / Latino 4% Black 2%
- Common ancestry
- Romanian 6% Lithuanian 5% Italian 2%
- Foreign-born
- 12% · Canada, China, Jamaica
- Languages at home
- 86% English-only · Other Indo-European 4% Russian/Polish/Slavic 2% Spanish 2%
Political lean MEDSL · Saratoga
- 2024 margin
- Toss-up / Even · D 50.9% · R 49.1%
- 2008→2024 swing
- -1.6pp toward R · 2008: 3.4pp · 2024: 1.8pp
- All cycles
- 2024: D+1.8 2020: D+5.4 2016: R+4.4 2012: D+2.1 2008: D+3.4
Not yet ingested
- Civics
- —
Market trends
- HPI YoY
- ▼ -201.12%
- Current HPI
- 318.0765
- Rent YoY
- ▲ 4.65%
- Metro
- Albany-Schenectady-Troy, NY
- State GDP YoY
- ▲ 2.60%
- F500 in state
- 92
Industry mix (Fortune 500 HQ in NY)
| Industry | F500 HQs | Revenue |
|---|---|---|
| Financial Services | 10 | $950B |
|
||
| Consumer Goods | 9 | $162B |
|
||
| Insurance | 4 | $225B |
|
||
| Telecommunications | 2 | $144B |
|
||
| Pharmaceuticals | 2 | $112B |
|
||
| Media / Entertainment | 2 | $69B |
|
||
Price history
1 event — show timeline
- 2026-03-02 Listed $127,349 Zillow
Cash-flow waterfall
monthlySold comps — $/sqft
last 12 mo · ≤1 miLoading sold comps…