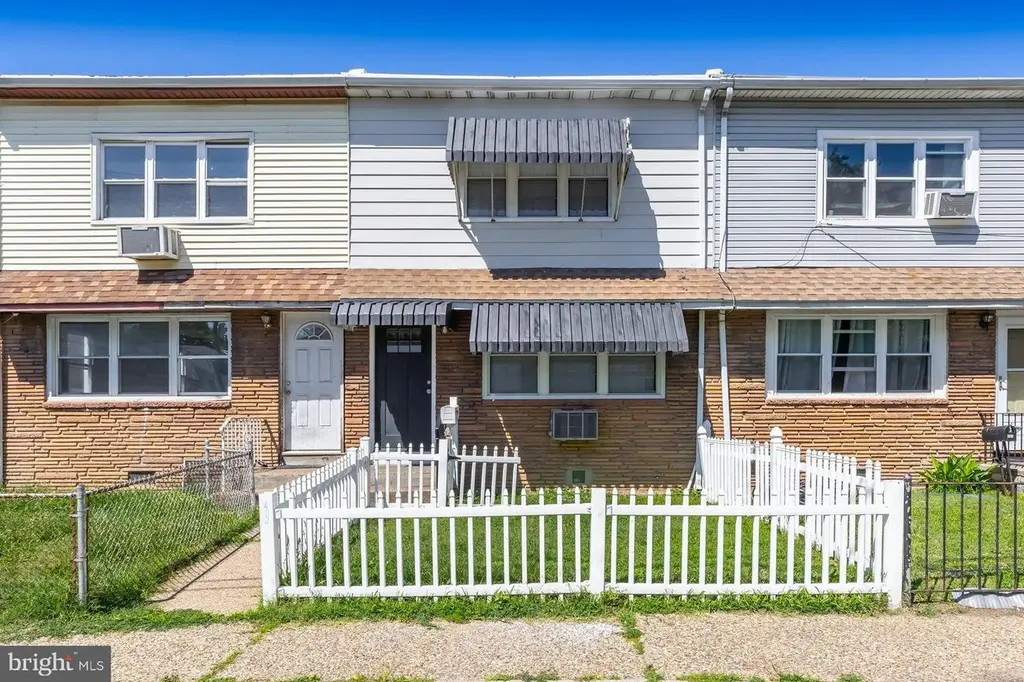
403 Bergen St · Gloucester City, NJ
Flood risk 1/10 · Minimal
- FEMA flood zone
- X (unshaded)
- Chance of flooding over 30 yrs
- 0.0%
- Est. flood insurance / yr
- $507 – $1,088
Fire risk 1/10 · Minimal
- Est. fire insurance / yr
- $526 – $976
Heat risk 7/10 · Major
- Hot days now (above 103°F)
- 7 days/yr
- Hot days in 30 yrs
- 15 days/yr
Wind risk 6/10 · Moderate
- Chance of severe wind over 30 yrs
- 40.0%
Air-quality risk 4/10 · Minor
- Unhealthy air days now
- 5 days/yr
- Unhealthy air days in 30 yrs
- 6 days/yr
Risk factors via First Street. Map © Google.
Why this score? — see what drove the D grade
The composite is a weighted blend of 9 inputs, each scored 0–100. Each bar is that input's sub-score; the figure is the points it added to the 100-point composite (weight × sub-score).
- Cash flow +15.5/30.0
- ARV discount +9.1/15.0
- DSCR +4.8/10.0
- 1% rule +4.3/10.0
- Livability +3.6/5.0
- Rent growth +2.5/5.0
- Condition / age +2.5/5.0
- Schools +2.0/10.0
- Appreciation +0.0/10.0
$215,000
🖨 Deal sheet (PDF) 📄 Offer letter ✓ Due diligence
Listing remarks MLS
Public:Your monthly payments will be less than your rent! Best Deal in all of Gloucester City. Come see this renovated home on lovely Bergen Street. New kitchen with beautiful granite counters, new white cabinets and ceramic tile flooring. The original hardwood floors have been restored throughout the living room and dining area and throughout the upstairs. There's also new ceramic tile in the bathroom. Refrigerator, Washer & Dryer are all included. Brand new heater and central air-conditioning! Freshly painted throughout. Available immediately. NOT a short sale! Come see and make an offer!
Key facts
- Remodeled bathroom
- 15 x 9 patio
- Wood cabinetry
Tags
Property features AI
Finance
- Other: Fee simple ownership; Property listed in very good condition
Exterior
- Parking: On-street parking
- Utilities: Public water; Public sewer; Electric service with circuit breakers; Above-ground utilities
- Home design: Interior townhouse/rowhouse; Middle-of-block location; Fronting on Broadway/Bergen area
- Construction: Frame construction with aluminum siding and stone accents; Flat roof; Crawl space foundation; Double-hung, double-pane vinyl-clad replacement windows; Pets allowed with no pet restrictions; Built year per assessor
- Exterior features: Patio; Awnings; Open, level front and rear yard
Interior
- Kitchen: Gas oven/range
- Bedrooms: Three bedrooms on the upper level
- Flooring: Luxury vinyl plank; Ceramic tile
- Bathrooms: One full bathroom
- Heating & cooling: Forced air heating (natural gas); Window air conditioning units (electric)
- Interior features: Tub/shower; Ceiling fans; Eat-in kitchen; Drywall walls and ceilings; Not furnished
- Laundry & utility: Main floor laundry; Water heater (natural gas)
Neighborhood map
What this means for you Summary
Snapshot
- This is a 3-bed/1.0-bath townhouse listed at $215k.
Deal economics
- At list price, monthly cash flow is $88 ($1k/yr) — positive.
- The deal already cash-flows at list — no discount required.
- To meet the 1% rule (rent ≥ 1% of price), the offer needs to be $200k (7.1% below list).
- Recommended offer: $200k (7.1% below list) — sets the bar for 1% rule.
Location & tenants
- Location reads 72/100 on livability (#215 in NJ) — a middle-class / working-renter tenant base. Strengths: housing A+, health & safety B+; Watch: amenities F, commute F.
- Gloucester City Public School District (suburban): math 11% / reading 34% proficiency, ranked #413 of 472 in NJ (top 88%) — low school quality limits family demand, transient renter base, plan for 1-2y turnover.
- Zoned schools: Cold Springs School (math 8% / reading 17%, grade F, #1,172 of 1,303 statewide, top 91%, 842 students, 68% FRL); Gloucester City Middle School (math 8% / reading 36%, grade F, #383 of 431 statewide, top 90%, 779 students, 65% FRL); Gloucester City High School (math 21% / reading 42%, grade F, #275 of 399 statewide, top 69%, 702 students, 59% FRL).
- Market conditions: 92 active listings in the ZIP; 17 comparable units currently listed for rent nearby; rentals at typical pace (median 26d on market — plan ~3-4 weeks tenant-placement turnaround); 1,018 units permitted in Camden County in 2024 (509 in 5+ unit buildings).
- This rent runs 38% of the median local income ($63k/yr) — at the standard rent-burdened threshold; future hikes will face affordability resistance.
Forward outlook
- Local home prices are declining (-3.0%/yr); year-one equity from $1k of loan paydown is wiped out by about $6k of value loss. Plan a longer hold.
- Camden County population projected to shrink 8% by 2050 — rents likely to lag national; underwrite the cash flow, not the appreciation.
Negotiation context
- Only 2 days on market — expect competitive offers; lowballing is unlikely to land.
- 7 sale attempts since 17y ago with the ask held roughly flat each time — persistent listings suggest the price (not the market) is what's stuck; bring a comps-based counter.
- Current owner paid $57k; list at $215k implies a 277% gain — meaningful room to come down on a strong offer.
Risks & watch-outs
- Watch-outs: built in 1950 — expect roof / HVAC / electrical / plumbing capex.
- Climate carrying-cost: major wind risk, 40% chance of damaging wind over 30y; extreme-heat days projected 7→15/yr by 2055 (HVAC capex compounding) — expect insurance premiums to compound above CPI over the hold.
Questions for the listing agent
- Built in 1950 — when were the roof, HVAC, electrical panel, plumbing, and water heater last replaced?
- Is there a deadline driving the sale (1031 exchange, divorce, estate, relocation)? That informs how much negotiation room exists.
- The area grade is low — what's the realistic commute time and amenity access for the typical tenant pool here? Any planned neighborhood developments (good or bad) we should know about?
- What's the average days-on-market for RENTAL listings here right now (not sales)? A rising rental-DOM trend means longer vacancies and softer asking-rent achievability than the comps imply.
- What's the recent tenant-quality profile in this submarket — average credit score on applications, eviction rate, late-payment / NSF rate, and stable-employment percentage? A property-management company in the area should have these aggregated.
- How much new for-sale + rental construction is in the pipeline within 1–3 miles? Heavy new supply typically softens prices + rents 12–24 months out; constrained supply supports both.
Investment metrics
- 1% rule
- 0.93% ✗
- Cap rate
- 6.79%
- Cash-on-cash
- 1.76%
- DSCR
- 1.08
- GRM
- 9.0
CMA / ARV
- ARV (on-the-fly)
- $222,768
- Comps found
- 12
Show comp detail 12 sales within ~0.75 mi
| Address | Dist | Beds/Ba | Sqft | Sold | Price | $/sf | Match |
|---|---|---|---|---|---|---|---|
| 407 Bergen St | 0.01mi | 3/1.0 | 1,224 (0%) | 1mo | $221,800 | $181 | 99 |
| 404 Hudson St | 0.02mi | 3/1.0 | 1,224 (0%) | 3mo | $212,000 | $173 | 97 |
| 319 Bergen St | 0.06mi | 3/1.0 | 1,248 (+2%) | 3mo | $245,140 | $196 | 92 |
| 508 Essex St | 0.24mi | 3/1.0 | 1,200 (-2%) | 2mo | $230,000 | $192 | 84 |
| 313 Hudson St | 0.08mi | 3/1.0 | 1,128 (-8%) | 4mo | $205,000 | $182 | 80 |
| 414 Middlesex St | 0.07mi | 3/1.0 | 1,078 (-12%) | 1mo | $199,900 | $185 | 76 |
| 530 Bergen St | 0.17mi | 3/1.5 | 1,126 (-8%) | 1mo | $225,000 | $200 | 76 |
| 108 S Sussex St | 0.16mi | 4/1.5 (+1) | 1,302 (+6%) | 1mo | $235,000 | $180 | 74 |
| 500 Essex St | 0.23mi | 3/1.5 | 1,288 (+5%) | 5mo | $212,900 | $165 | 74 |
| 601 Hunter St | 0.36mi | 3/1.0 | 1,164 (-5%) | 3mo | $235,000 | $202 | 72 |
| 323 Morris St | 0.18mi | 3/1.5 | 1,326 (+8%) | 5mo | $220,000 | $166 | 71 |
| 3028 Fenwick Rd | 0.71mi | 3/1.5 | 1,272 (+4%) | 3mo | $200,000 | $157 | 56 |
Match score weights: distance 35% · size 25% · config 20% · recency 20%. Top-matched comps best support the ARV.
Projected returns pro-forma
-3.0% appreciation · 3.0% rent growth · sell at horizon
- IRR
- -13.5%
- Equity multiple
- 0.52×
- Total profit
- $-29,179
- Equity at exit
- $32,057
- IRR
- -4.6%
- Equity multiple
- 0.70×
- Total profit
- $-18,031
- Equity at exit
- $18,589
Cash invested: $60,200 (down + closing). Projections, not guarantees.
Landlord ↔ Tenant lean methodology
- Overall (STATE)
- 21 Tenant-Leaning
- State New Jersey
- 21 Tenant-Leaning · D+6
- County
- — inherits STATE
- City
- — inherits STATE
ZIP-level market 08030
- Home prices YoY
- -27.9%
- Active inventory
- 92
- Price-to-rent
- 9.0×
Monthly cashflow live
- Estimated rent
- $1,996 high interval (Pro) →
- Mortgage (P&I)
- −$1,127
- Tax from tax record
- −$272 /mo · $3,260/yr
- Insurance
- −$90
- HOA
- −$0
- Vacancy / Maint / Mgmt
- −$419
- Net cashflow
- $88
Break-even live
Sensitivity live
| Price | -10% $210 | -5% $149 | +0% $88 | +5% $28 | +10% $-33 |
|---|---|---|---|---|---|
| Rent | -10% $-69 | -5% $10 | +0% $88 | +5% $167 | +10% $246 |
| Rate | -1.0pp $197 | -0.5pp $143 | base $88 | +0.5pp $33 | +1.0pp $-24 |
UW: 25.0% down · 7.5% · 30yr · 1.5% tax · 5.0% vac · 8.0% maint · 8.0% mgmt
Financing live
Cash to close
- Down payment
- $53,750
- Closing costs
- $6,450
- Reserves months
- —
- Total cash needed
- —
Loan-product check · same deal, 3 products live
Conventional
25% down · 7.5% · 30yr
- Down + closing
- —
- Monthly P&I
- —
- Monthly cashflow
- —
- DSCR
- —
- Eligible?
- —
Personal DTI + credit; lowest rate.
DSCR
20% down · 8.5% · 30yr
- Down + closing
- —
- Monthly P&I
- —
- Monthly cashflow
- —
- DSCR
- —
- Eligible?
- —
No personal income docs; deal must DSCR.
Hard money
10% down · 12.0% · 12mo
- Down + closing
- —
- Monthly P&I
- —
- Monthly cashflow
- —
- DSCR
- —
- Eligible?
- —
Short-term bridge; refi at stabilization.
Rent comps 17 comps
| Address | Beds | Baths | Sqft | Rent | $/sqft | DOM | Units | Dist |
|---|---|---|---|---|---|---|---|---|
| 334 Middlesex St Gloucester City, NJ | 3.0 | 1.0 | 896 | $1,800 | $2.01 | 26d | 1 | 0.08mi |
| 534 Bergen St Gloucester City, NJ | 3.0 | 1.0 | 1246 | $2,000 | $1.61 | 20d | 1 | 0.19mi |
| 231 3rd St Gloucester City, NJ | 3.0 | 2.0 | 1376 | $2,150 | $1.56 | 26d | 1 | 0.33mi |
| 602 Powell St Gloucester City, NJ | 3.0 | 1.0 | 1170 | $1,850 | $1.58 | 26d | 1 | 0.33mi |
| 604 Hunter St Gloucester City, NJ | 3.0 | 1.0 | 1066 | $1,900 | $1.78 | 6d | 1 | 0.38mi |
| 227 S Broadway Gloucester City, NJ | 3.0 | 1.0 | 1123 | $1,775 | $1.58 | 26d | 1 | 0.43mi |
| 917 Koehler St Gloucester City, NJ | 3.0 | 1.0 | 916 | $1,800 | $1.97 | 20d | 1 | 0.75mi |
| 1063 S Merrimac Rd Camden, NJ | 4.0 | 1.0 | 1024 | $1,900 | $1.86 | 26d | 1 | 0.79mi |
| 3136 Tuckahoe Rd Camden, NJ | 2.0 | 1.0 | 800 | $1,350 | $1.69 | 26d | 1 | 0.79mi |
| 1021 Monitor Rd Camden, NJ | 3.0 | 1.0 | 1012 | $1,710 | $1.69 | 26d | 1 | 0.83mi |
| 2829 Idaho Rd Camden, NJ | 3.0 | 1.5 | 1048 | $1,700 | $1.62 | 26d | 1 | 1.00mi |
| 3079 Alabama Rd Camden, NJ | 2.0 | 1.0 | 832 | $1,700 | $2.04 | 26d | 1 | 1.13mi |
| 5 Meadow Ln Gloucester City, NJ | 1.0–2.0 | 1.0–2.0 | 833 | $2,385 | $2.86 | 26d | 8 | 1.15mi |
| 2892 N Constitution Rd Camden, NJ | 3.0 | 1.0 | 1040 | $2,000 | $1.92 | 26d | 1 | 1.16mi |
| 3132 Independence Rd Camden, NJ | 3.0 | 1.5 | 1168 | $1,595 | $1.37 | 24d | 1 | 1.21mi |
| 108 New Broadway Unit 120 Brooklawn, NJ | 2.0 | 1.0 | 800 | $1,800 | $2.25 | 26d | 1 | 1.30mi |
| 3255 Crescent Dr Unit 03-3220 Camden, NJ | 2.0 | 1.0 | 700 | $1,350 | $1.93 | 26d | 1 | 1.38mi |
Listing history 2 events
-
2026-06-21remarks 699-char remark
-
2026-06-21$215,000 Active 2 DOM
ⓘ Source: listings_history table (triggers on properties + properties_extension) + one-shot
backfill from property_details.listing_events for pre-trigger history.
Tax reassessment forecast NJ · Partial reset (capped growth)
- Current annual tax
- $3,260 · $272/mo
- Projected year-2 tax
- $4,307 · $359/mo
- Expected delta
- +$1,047/yr (+$87/mo · 32.1%)
ⓘ Screening estimate from a state-policy table — verify with the county assessor before closing.
Climate risk First Street
- Flood 1/10 Low FEMA zone X (unshaded) · 0% chance over 30 yrs
- Wildfire 1/10 Low
- Heat 7/10 Severe 7 d/yr ≥103°F today · 15 d/yr by 30 yrs out
- Wind 6/10 Major 40% chance of damaging wind over 30 yrs
- Air quality 4/10 Moderate 5 unhealthy d/yr today · 6 by 30 yrs out
Nearby sold comps map
Loading sold comps map…
Walkable amenities ~0.75 mi
Loading nearby amenities…
Taxation est. · year 1
- Rental income
- $23,957
- − Mortgage interest
- −$12,043
- − Property taxes
- −$3,260
- − Insurance
- −$1,075
- − Repairs & maintenance
- −$1,917
- − Management
- −$1,917
- − Depreciation
- −$6,255
- Taxable loss
- −$2,510
- Est. tax savings @ 24.0%
- +$602
- After-tax cash flow
- $1,663/yr
For passive investors: Depreciation is non-cash, so a rental often shows a tax loss while cash-flowing — sheltering income. Rental losses are passive: they offset passive income freely, and up to $25,000/yr can offset ordinary (W-2) income if you actively participate and your MAGI is under $100k (phasing out to $0 by $150k); unused losses carry forward. On sale, claimed depreciation is recaptured at up to 25%, and gains may owe capital-gains tax (a 1031 exchange can defer both). Figures are a year-1 estimate at your 24.0% rate — not tax advice; consult a CPA.
Schools (NCES district)
- District
- Gloucester City Public School District
- NCES district ID
- 3406000
- Math proficiency
- 11% ▼ -21.00%
- Reading proficiency
- 34% ▼ -15.00%
- Median HH income
- $51,231
- Composite
- 20.01/100
- National rank
- #8664
- State rank
- #413 of 472 in NJ
Livability — Gloucester City
- Score
- 72/100
- State rank
- #215
- US rank
- #5984
Category grades
Schools grade is shown separately in the Schools card above.
Census & demographics
- Census place
- Gloucester City, NJ
- County
- Camden County · 407,624 people
- City population
- 13,217
- Metro
- Philadelphia-Camden-Wilmington, PA-NJ-DE-MD
- Population (ZIP)
- 13,217
- Household income
- $63,384
- Rent vs Own
- Severe rent burden
- 431.0
Population outlook (Camden County) Hauer SSP2
- Today (2025)
- 507,964 people
- By 2030
- 502,182 · -1.1%
- By 2040
- 485,602 · -4.4%
- By 2050
- 465,630 · -8.3%
- By 2075
- 419,986 · -17.3%
- By 2100
- 369,492 · -27.3%
Race, ethnicity, and origin ACS 2023
- Neighborhood character
- Predominantly White (68%)
- Race & ethnicity
- White 68% Hispanic / Latino 18% Black 7% Asian 5% Two or more races 5%
- Hispanic origin (detail)
- Mexican 4% Puerto Rican 10%
- Common ancestry
- Romanian 4% Lithuanian 3% Hispanic 2%
- Foreign-born
- 8% · Canada, Jamaica, China
- Languages at home
- 81% English-only · Spanish 13% Other Indo-European 4% Arabic 1%
Political lean MEDSL · Camden
- 2024 margin
- Strong D (+27.4) · D 63.0% · R 35.5% · Other 1.5%
- 2008→2024 swing
- -8.8pp toward R · 2008: 36.2pp · 2024: 27.4pp
- All cycles
- 2024: D+27.4 2020: D+33.5 2016: D+32.4 2012: D+36.6 2008: D+36.2
Not yet ingested
- Civics
- —
Market trends
- HPI YoY
- ▼ -115.59%
- Current HPI
- 298.9139
- Rent YoY
- —
- Metro
- Philadelphia-Camden-Wilmington, PA-NJ-DE-MD
- State GDP YoY
- ▲ 2.05%
- F500 in state
- 34
Industry mix (Fortune 500 HQ in NJ)
| Industry | F500 HQs | Revenue |
|---|---|---|
| Consumer Goods | 3 | $31B |
|
||
| Pharmaceuticals | 2 | $153B |
|
||
| Technology | 2 | $21B |
|
||
| Insurance | 2 | $20B |
|
||
| Healthcare | 2 | $19B |
|
||
| Financial Services | 1 | $70B |
|
||
Price history
+115.2% since first listed19 events — show timeline
- 2026-06-19 Listed $215,000 BRIGHT MLS
- 2014-12-23 Sold (Public Records) $57,000 Public Records
- 2014-12-05 Delisted — TREND
- 2014-12-05 Sold (MLS) $57,000 BRIGHT MLS
- 2014-12-05 Sold (MLS) $57,000 TREND
- 2014-12-02 Pending — TREND
- 2014-11-13 Listing Removed — BRIGHT MLS
- 2014-10-27 Listed $70,000 TREND
- 2014-10-27 Listed $70,000 BRIGHT MLS
- 2014-09-23 Listing Removed — BRIGHT MLS
- 2012-06-22 Listed $72,900 BRIGHT MLS
- 2011-09-27 Sold (Public Records) $48,000 Public Records
- 2011-09-15 Sold (MLS) $48,000 TREND
- 2011-09-15 Sold (MLS) $48,000 BRIGHT MLS
- 2011-07-29 Listing Removed — BRIGHT MLS
- 2011-05-06 Listed $50,000 TREND
- 2011-05-06 Listed $50,000 BRIGHT MLS
- 2011-03-18 Listing Removed — BRIGHT MLS
- 2009-06-26 Listed $99,900 BRIGHT MLS
Property tax history
+2.1%/yrLatest (2025): $3,260 · +5.6% YoY. Source: county tax records.
Cash-flow waterfall
monthlySold comps — $/sqft
last 12 mo · ≤1 miLoading sold comps…