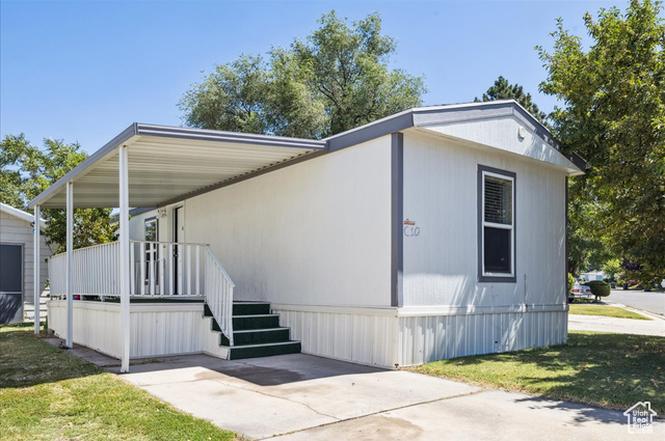
3860 Midland Dr Unit C10 · Roy, UT
Flood risk 1/10 · Minimal
- FEMA flood zone
- X (unshaded)
- Chance of flooding over 30 yrs
- 0.0%
- Est. flood insurance / yr
- $507 – $1,088
Fire risk 1/10 · Minimal
- Est. fire insurance / yr
- $453 – $841
Heat risk 4/10 · Minor
- Hot days now (above 94°F)
- 6 days/yr
- Hot days in 30 yrs
- 15 days/yr
Wind risk 1/10 · Minimal
- Chance of severe wind over 30 yrs
- —
Air-quality risk 4/10 · Minor
- Unhealthy air days now
- 4 days/yr
- Unhealthy air days in 30 yrs
- 5 days/yr
Risk factors via First Street. Map © Google.
Why this score? — see what drove the C- grade
The composite is a weighted blend of 9 inputs, each scored 0–100. Each bar is that input's sub-score; the figure is the points it added to the 100-point composite (weight × sub-score).
- Cash flow +16.8/30.0
- 1% rule +10.0/10.0
- ARV discount +7.5/15.0
- DSCR +5.2/10.0
- Livability +4.0/5.0
- Schools +3.2/10.0
- Condition / age +2.5/5.0
- Rent growth +2.4/5.0
- Appreciation +0.0/10.0
$55,000
🖨 Deal sheet 📄 Offer letter ✓ Due diligence
Listing remarks
* * Updated Price! * * This charming 3-bedroom, 2-bathroom home in Roy is move-in ready and filled with updates you'll love - new carpet, appliances included, and an open layout. Enjoy community amenities like a pool, playground, and RV parking for all your summer toys. Plus, its convenient location near highways, schools, and the FrontRunner Station makes daily life that much easier. Schedule your private tour today! Please note: Photos have been virtually staged to show potential.
Key facts
- Rv parking
- New carpet
- Park amenities
Tags
Property features AI
Finance
- Other: Residential current use
- HOA & community: Homeowners association with monthly fee; Association fee covers sewer, trash and water; Community amenities include clubhouse, management, snow removal and storage
Exterior
- Utilities: Sewer service included in association; Water service included in association; Trash service included in association
- Home design: Mobile home; Built and currently standing; Zoned for multi-family
- Construction: Asphalt roof
- Exterior features: 0.1-acre lot; Clubhouse within the community
Interior
- Kitchen: Refrigerator
- Bedrooms: 3 main-level bedrooms
- Flooring: Carpet
- Bathrooms: 2 full bathrooms
- Heating & cooling: Gas central heating; Central air conditioning
- Interior features: Blinds on windows; Carpet flooring; One fireplace
- Laundry & utility: Washer; Dryer
Neighborhood map
What this means for you Summary
Snapshot
- This is a 3-bed/2.0-bath manufactured listed at $55k.
Deal economics
- At list price, monthly cash flow is $35 ($421/yr) — positive.
- The deal already cash-flows at list — no discount required.
- Meets the 1% rule at list price ($2k rent vs $55k).
- Recommended offer: $48k (12.0% below list) — sets the bar for market timing.
Location & tenants
- Location reads 81/100 on livability (#32 in UT, #1,449 nationally) — a professional / high-income tenant draw. Strengths: housing A+, health & safety A+, commute A; Watch: amenities F.
- Weber District (suburban): math 36% / reading 35% proficiency, ranked #56 of 80 in UT (top 70%) — families likely to look elsewhere, expect single-tenant / working-renter base with shorter leases.
- Zoned schools: Midland School (math 37% / reading 28%, grade F, #416 of 585 statewide, top 71%, 568 students, 29% FRL); Sand Ridge Jr High (math 26% / reading 26%, grade F, #119 of 138 statewide, top 87%, 857 students, 40% FRL); Roy High (math 15% / reading 39%, grade F, #131 of 171 statewide, top 79%, 1,834 students, 28% FRL).
- Market conditions: Rents soft (-0.5%/yr); 203 active listings in the ZIP; 11 comparable units currently listed for rent nearby; rentals at typical pace (median 14d on market — plan ~3-4 weeks tenant-placement turnaround); solid renter incomes; 1,630 units permitted in Weber County in 2024 (521 in 5+ unit buildings).
Forward outlook
- Local home prices are declining (-3.0%/yr); year-one equity from $380 of loan paydown is wiped out by about $2k of value loss. Plan a longer hold.
- Weber County population projected at +24% by 2050 — long-run rental-demand tailwind backs the buy-and-hold thesis.
Negotiation context
- It's been on market 318 days — a 12% lower offer ($48k) is reasonable based on typical stale-listing flexibility.
- 2 sale attempts; this cycle's ask has dropped $30k (35%) from the opening price — seller is motivated, your offer sets the floor, not the list.
Risks & watch-outs
- Watch-outs: HOA is 54% of rent.
Questions for the listing agent
- It's been on market 318 days. Have you received any prior offers? Is the seller open to a 12% concession, seller financing, or rate buy-down credit?
- What does the HOA fee cover, when was the last increase, and are there any pending special assessments or reserve-fund shortfalls?
- Why hasn't it sold? Are there any deal-killer items the seller is aware of (foundation, flood, title, zoning, code violations)?
- Is there a deadline driving the sale (1031 exchange, divorce, estate, relocation)? That informs how much negotiation room exists.
- Schools are D-rated, which usually means shorter tenancies and higher turnover. Who's the typical renter profile here, and what's been the actual vacancy rate?
- What's the average days-on-market for RENTAL listings here right now (not sales)? A rising rental-DOM trend means longer vacancies and softer asking-rent achievability than the comps imply.
- What's the recent tenant-quality profile in this submarket — average credit score on applications, eviction rate, late-payment / NSF rate, and stable-employment percentage? A property-management company in the area should have these aggregated.
- How much new for-sale + rental construction is in the pipeline within 1–3 miles? Heavy new supply typically softens prices + rents 12–24 months out; constrained supply supports both.
Investment metrics
- 1% rule
- 3.00% ✓
- Cap rate
- 7.06%
- Cash-on-cash
- 2.73%
- DSCR
- 1.12
- GRM
- 2.8
CMA / ARV
No comps found within radius.
Projected returns pro-forma
-3.0% appreciation · 0.0% rent growth · sell at horizon
- IRR
- -22.5%
- Equity multiple
- 0.29×
- Total profit
- $-10,948
- Equity at exit
- $8,201
- IRR
- —
- Equity multiple
- -0.50×
- Total profit
- $-23,045
- Equity at exit
- $4,755
Cash invested: $15,400 (down + closing). Projections, not guarantees.
Landlord ↔ Tenant lean methodology
- Overall (STATE)
- 86 Strongly Landlord-Friendly
- State Utah
- 86 Strongly Landlord-Friendly · R+15
- County
- — inherits STATE
- City
- — inherits STATE
ZIP-level market 84067
- Rents YoY
- -0.5%
- Active inventory
- 203
- Price-to-rent
- 2.8×
Monthly cashflow live
- Estimated rent
- $1,652 high interval (Pro) →
- Mortgage (P&I)
- −$288
- Tax est. 1.5%
- −$69 /mo · $825/yr
- Insurance
- −$23
- HOA
- −$890
- Vacancy / Maint / Mgmt
- −$347
- Net cashflow
- $35
Break-even live
UW: 25.0% down · 7.5% · 30yr · 1.5% tax · 5.0% vac · 8.0% maint · 8.0% mgmt
Financing live
Cash to close
- Down payment
- $13,750
- Closing costs
- $1,650
- Reserves months
- —
- Total cash needed
- —
Loan-product check · same deal, 3 products live
Conventional
25% down · 7.5% · 30yr
- Down + closing
- —
- Monthly P&I
- —
- Monthly cashflow
- —
- DSCR
- —
- Eligible?
- —
Personal DTI + credit; lowest rate.
DSCR
20% down · 8.5% · 30yr
- Down + closing
- —
- Monthly P&I
- —
- Monthly cashflow
- —
- DSCR
- —
- Eligible?
- —
No personal income docs; deal must DSCR.
Hard money
10% down · 12.0% · 12mo
- Down + closing
- —
- Monthly P&I
- —
- Monthly cashflow
- —
- DSCR
- —
- Eligible?
- —
Short-term bridge; refi at stabilization.
Rent comps 11 comps
| Address | Beds | Baths | Sqft | Rent | $/sqft | DOM | Units | Dist |
|---|---|---|---|---|---|---|---|---|
| 2405 Hinckley Dr Unit L203 West Haven, UT | 2.0 | 2.0 | 988 | $1,416 | $1.43 | 23d | 1 | 0.18mi |
| 3560 Midland Dr West Haven, UT | 1.0–3.0 | 1.0–2.0 | 932 | $1,599 | $1.71 | 14d | 22 | 0.43mi |
| 3405 S 2400 W West Haven, UT | 1.0–3.0 | 1.0–2.0 | 978 | $1,800 | $1.84 | 23d | 5 | 0.55mi |
| 3330 S Midland Dr West Haven, UT | 1.0–3.0 | 1.0–2.5 | 1000 | $1,750 | $1.75 | 14d | 3 | 0.77mi |
| 2112 W 3300 S West Haven, UT | 1.0–3.0 | 1.0–2.0 | 975 | $1,772 | $1.82 | 14d | 15 | 0.87mi |
| 4449 S 1900 W Roy, UT | 2.0 | 1.0 | 620 | $999 | $1.61 | 14d | 3 | 0.97mi |
| 4449 S 1900 W Unit 4 Roy, UT | 2.0 | 1.0 | 900 | $999 | $1.11 | 23d | 1 | 0.97mi |
| 4499 S 1930 W Roy, UT | 1.0–3.0 | 1.0–2.5 | 1106 | $2,162 | $1.95 | 14d | 11 | 1.02mi |
| 3330 W 4000 S West Haven, UT | 1.0–3.0 | 1.0–2.0 | 1048 | $2,072 | $1.98 | 14d | 22 | 1.18mi |
| 2002 W 4700 S Apt 2 Roy, UT | 2.0 | 1.0 | 837 | $1,185 | $1.42 | 23d | 1 | 1.19mi |
| 90 West Roy, UT | 1.0–3.0 | 1.0–2.0 | 1075 | $1,635 | $1.52 | 14d | 11 | 1.34mi |
HOA detail
- Monthly dues
- $890 · $10,680/yr
- Likely covers
- pool
Listing history 24 events
-
2026-06-18days on market $55,000 Active 318 DOM
-
2026-06-17days on market $55,000 Active 317 DOM
-
2026-06-16days on market $55,000 Active 316 DOM
-
2026-06-15days on market $55,000 Active 315 DOM
-
2026-06-14days on market $55,000 Active 313 DOM
-
2026-06-10days on market $55,000 Active 310 DOM
-
2026-06-09days on market $55,000 Active 309 DOM
-
2026-06-08days on market $55,000 Active 308 DOM
-
2026-06-07days on market $55,000 Active 307 DOM
-
2026-06-05days on market $55,000 Active 304 DOM
-
2026-06-03days on market $55,000 Active 303 DOM
-
2026-06-02days on market $55,000 Active 302 DOM
-
2026-06-01days on market $55,000 Active 301 DOM
-
2026-05-31days on market $55,000 Active 300 DOM
-
2026-05-31days on market $55,000 Active 299 DOM
-
2026-04-11price $59,000
-
2026-03-01price $64,000
-
2025-12-30price $65,000
-
2025-12-26status Active
-
2025-12-23status Under Contract
-
2025-11-09price $70,000
-
2025-09-13price $75,000
-
2025-08-16price $80,000
-
2025-08-01$85,000 Active
ⓘ Source: listings_history table (triggers on properties + properties_extension) + one-shot
backfill from property_details.listing_events for pre-trigger history.
Climate risk First Street
- Flood 1/10 Low FEMA zone X (unshaded) · 0% chance over 30 yrs
- Wildfire 1/10 Low
- Heat 4/10 Moderate 6 d/yr ≥94°F today · 15 d/yr by 30 yrs out
- Wind 1/10 Low
- Air quality 4/10 Moderate 4 unhealthy d/yr today · 5 by 30 yrs out
Nearby sold comps map
Loading sold comps map…
Walkable amenities ~0.75 mi
Loading nearby amenities…
Taxation est. · year 1
- Rental income
- $19,825
- − Mortgage interest
- −$3,081
- − Property taxes
- −$825
- − Insurance
- −$275
- − Repairs & maintenance
- −$1,586
- − Management
- −$1,586
- − HOA
- −$10,680
- − Depreciation
- −$1,600
- Taxable income
- $192
- Est. tax owed @ 24.0%
- −$46
- After-tax cash flow
- $375/yr
For passive investors: Depreciation is non-cash, so a rental often shows a tax loss while cash-flowing — sheltering income. Rental losses are passive: they offset passive income freely, and up to $25,000/yr can offset ordinary (W-2) income if you actively participate and your MAGI is under $100k (phasing out to $0 by $150k); unused losses carry forward. On sale, claimed depreciation is recaptured at up to 25%, and gains may owe capital-gains tax (a 1031 exchange can defer both). Figures are a year-1 estimate at your 24.0% rate — not tax advice; consult a CPA.
Schools (NCES district)
- District
- Weber District
- NCES district ID
- 4901200
- Math proficiency
- 36% ▼ -4.00%
- Reading proficiency
- 35% ▼ -5.00%
- Median HH income
- $65,750
- Composite
- 32.28/100
- National rank
- #5757
- State rank
- #56 of 80 in UT
Livability — Roy
- Score
- 81/100
- State rank
- #32
- US rank
- #1449
Category grades
Schools grade is shown separately in the Schools card above.
Census & demographics
- Census place
- Roy, UT
- County
- Weber County · 260,557 people
- City population
- 38,794
- Metro
- Ogden-Clearfield, UT
- Population (ZIP)
- 38,794
- Household income
- $91,115
- Rent vs Own
- Severe rent burden
- 216.0
Population outlook (Weber County) Hauer SSP2
- Today (2025)
- 274,329 people
- By 2030
- 288,577 · +5.2%
- By 2040
- 314,848 · +14.8%
- By 2050
- 338,710 · +23.5%
- By 2075
- 384,412 · +40.1%
- By 2100
- 409,305 · +49.2%
Race, ethnicity, and origin ACS 2023
- Neighborhood character
- Predominantly White (73%)
- Race & ethnicity
- White 73% Hispanic / Latino 19% Two or more races 8% Asian 2%
- Hispanic origin (detail)
- Mexican 14%
- Common ancestry
- Slovak 4% Italian 4% Portuguese 3%
- Foreign-born
- 6% · Canada
- Languages at home
- 86% English-only · Spanish 11% Other Asian/Pacific 1% Tagalog/Filipino 1%
Political lean MEDSL · Weber
- 2024 margin
- Strong R (+23.5) · D 36.8% · R 60.3% · Other 2.9%
- 2008→2024 swing
- +4.1pp toward D · 2008: -27.6pp · 2024: -23.5pp
- All cycles
- 2024: R+23.5 2020: R+22.7 2016: R+20.0 2012: R+46.0 2008: R+27.6
Not yet ingested
- Civics
- —
Market trends
- HPI YoY
- ▼ -284.84%
- Current HPI
- 323.642
- Rent YoY
- ▼ -0.45%
- Metro
- Ogden-Clearfield, UT
- State GDP YoY
- ▲ 3.54%
- F500 in state
- 2
Industry mix (Fortune 500 HQ in UT)
| Industry | F500 HQs | Revenue |
|---|---|---|
| Financial Services | 1 | $3B |
|
||
Price history
-30.6% since first listed9 events — show timeline
- 2026-04-11 Price Changed $59,000 WFRMLS
- 2026-03-01 Price Changed $64,000 WFRMLS
- 2025-12-30 Price Changed $65,000 WFRMLS
- 2025-12-26 Relisted — WFRMLS
- 2025-12-23 Pending — WFRMLS
- 2025-11-09 Price Changed $70,000 WFRMLS
- 2025-09-13 Price Changed $75,000 WFRMLS
- 2025-08-16 Price Changed $80,000 WFRMLS
- 2025-08-01 Listed $85,000 WFRMLS
Cash-flow waterfall
monthlySold comps — $/sqft
last 12 mo · ≤1 miLoading sold comps…