 Duplex
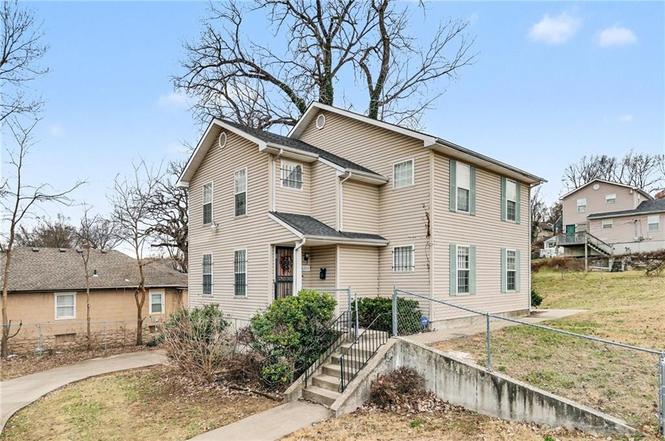
4200-4202 Flora Ave · Kansas City, MO
Flood risk 9/10 · Severe
- FEMA flood zone
- X (unshaded)
- Chance of flooding over 30 yrs
- 0.99%
- Est. flood insurance / yr
- $473 – $860
Fire risk 1/10 · Minimal
- Est. fire insurance / yr
- $1,054 – $1,958
Heat risk 4/10 · Minor
- Hot days now (above 106°F)
- 7 days/yr
- Hot days in 30 yrs
- 17 days/yr
Wind risk 2/10 · Minimal
- Chance of severe wind over 30 yrs
- —
Air-quality risk 3/10 · Minor
- Unhealthy air days now
- 2 days/yr
- Unhealthy air days in 30 yrs
- 3 days/yr
Risk factors via First Street. Map © Google.
Why this score? — see what drove the C grade
The composite is a weighted blend of 9 inputs, each scored 0–100. Each bar is that input's sub-score; the figure is the points it added to the 100-point composite (weight × sub-score).
- Cash flow +24.5/30.0
- DSCR +7.9/10.0
- ARV discount +7.5/15.0
- 1% rule +5.6/10.0
- Livability +3.9/5.0
- Rent growth +3.5/5.0
- Condition / age +2.5/5.0
- Schools +1.5/10.0
- Appreciation +0.0/10.0
$320,000
🖨 Deal sheet (PDF) 📄 Offer letter ✓ Due diligence
Multi-family units
County records classify this as Multi-Family (2-4 Unit). Listing-text estimate: 2 units. confirmed
Listing remarks MLS
The address is 4200 and 4202 Flora Ave. Kansas City, MO. Very nice side by side duplex. New Roof - May 2021. 4200 Flora has new AC unit June 2019. Both units have: 4 bedrooms and 2 full baths with a bedroom and bath on the main level. Kitchen equipped with gas stove, refrigerator and dishwasher. 4200 Flora also has washer and dryer. 4202 Flora has washer and dryer hookups. Both units have ADT alarm system and 1 car garage. Vinyl siding and fenced yard. Well maintained income producing property. The property will be sold in its present condition.
Key facts
- Spacious layouts
- Ample natural light
- Recent updates
Tags
Neighborhood map
What this means for you Summary
Snapshot
- This is a 2 × 4-bed/2.0-bath units multifamily listed at $320k.
Deal economics
- At list price, monthly cash flow is $600 ($7k/yr) — positive. Per door: $300/mo.
- The deal already cash-flows at list — no discount required.
- Meets the 1% rule at list price ($3k rent vs $320k).
- Recommended offer: $291k (9.0% below list) — sets the bar for market timing.
- Cap rate 8.8% vs local median 3.9% in Kansas City — top-decile yield for the area; either an underpriced asset or a hidden risk that comps aren't pricing in. Stress-test before assuming the spread holds.
Location & tenants
- Location reads 78/100 on livability (#28 in MO, #2,671 nationally) — a middle-class / working-renter tenant base. Strengths: amenities A+, commute A+, cost of living A+; Watch: schools C-, crime F.
- Kansas City 33 (urban): math 12% / reading 24% proficiency, ranked #308 of 324 in MO (top 95%) — low school quality limits family demand, transient renter base, plan for 1-2y turnover; 75% free/reduced lunch — lower-income household profile, screen leases tightly.
- Market conditions: Rents rising (+4.0%/yr); tight market (median 1 DOM); 126 active listings in the ZIP; 17 comparable units currently listed for rent nearby; rentals at typical pace (median 25d on market — plan ~3-4 weeks tenant-placement turnaround); 47% of comp listings sitting > 30 days — soft ceiling on asking rent; 4,002 units permitted in Jackson County in 2024 (2,271 in 5+ unit buildings).
- At $3,379/mo this rent would consume 64% of the median local household income ($63k/yr) (locally 962% of renters already pay >50% of income on rent) — very limited rent-growth headroom before tenants either downsize or default.
Forward outlook
- Local home prices are declining (-3.0%/yr); year-one equity from $2k of loan paydown is wiped out by about $10k of value loss. Plan a longer hold.
- Jackson County population projected at +4% by 2050 — modest demand growth; plan on rents tracking national, not racing it.
Negotiation context
- It's been on market 100 days — a 9% lower offer ($291k) is reasonable based on typical stale-listing flexibility.
- 7 sale attempts since 10y ago; this cycle's ask has dropped $105k (25%) from the opening price — seller is motivated, your offer sets the floor, not the list.
Risks & watch-outs
- Watch-outs: flood insurance adds $56/mo.
- Climate carrying-cost: severe flood risk — expect insurance premiums to compound above CPI over the hold.
Questions for the listing agent
- It's been on market 100 days. Have you received any prior offers? Is the seller open to a 9% concession, seller financing, or rate buy-down credit?
- Can we see the unit-by-unit rent roll, current vacancy, and any below-market leases? What's the average tenancy length?
- What capital expenditures (roof, boiler, parking lot, exteriors) have been made in the last 5 years, and what's planned in the next 2?
- What's the actual annual flood-insurance premium (NFIP or private), and is the property in a SFHA with mandatory coverage?
- Why hasn't it sold? Are there any deal-killer items the seller is aware of (foundation, flood, title, zoning, code violations)?
- Is there a deadline driving the sale (1031 exchange, divorce, estate, relocation)? That informs how much negotiation room exists.
- Crime grade is F in this area — have there been break-ins, vandalism, or insurance claims at this property in the last 3 years? What carrier currently insures it and at what premium?
- What's the average days-on-market for RENTAL listings here right now (not sales)? A rising rental-DOM trend means longer vacancies and softer asking-rent achievability than the comps imply.
- What's the recent tenant-quality profile in this submarket — average credit score on applications, eviction rate, late-payment / NSF rate, and stable-employment percentage? A property-management company in the area should have these aggregated.
- How much new apartment / multifamily construction is in the pipeline within 1–3 miles? Heavy new supply (>2% of stock underway) typically softens rents 12–24 months out; light construction supports rent growth.
Investment metrics
- 1% rule
- 1.06% ✓
- Cap rate
- 8.75%
- Cash-on-cash
- 8.79%
- DSCR
- 1.39
- GRM
- 7.9
CMA / ARV
No comps found within radius.
Projected returns pro-forma
-3.0% appreciation · 3.95% rent growth · sell at horizon
- IRR
- -3.1%
- Equity multiple
- 0.88×
- Total profit
- $-10,388
- Equity at exit
- $47,713
- IRR
- 7.6%
- Equity multiple
- 1.60×
- Total profit
- $53,688
- Equity at exit
- $27,668
Cash invested: $89,600 (down + closing). Projections, not guarantees.
Landlord ↔ Tenant lean methodology
- Overall (STATE)
- 81 Strongly Landlord-Friendly
- State Missouri
- 81 Strongly Landlord-Friendly · R+10
- County
- — inherits STATE
- City
- — inherits STATE
ZIP-level market 64110
- Rents YoY
- 4.0%
- Median DOM (111 sales)
- 1 d
- Active inventory
- 126
- Price-to-rent
- 15.8×
Monthly cashflow live
- Estimated rent
- $3,379 high interval (Pro) →
- Mortgage (P&I)
- −$1,678
- Tax from tax record
- −$202 /mo · $2,424/yr
- Insurance
- −$133
- Flood insurance flood zone
- −$56 /mo · $666/yr
- HOA
- −$0
- Vacancy / Maint / Mgmt
- −$710
- Net cashflow
- $600
Break-even live
Sensitivity live
| Price | -10% $782 | -5% $691 | +0% $600 | +5% $510 | +10% $419 |
|---|---|---|---|---|---|
| Rent | -10% $333 | -5% $467 | +0% $600 | +5% $734 | +10% $867 |
| Rate | -1.0pp $762 | -0.5pp $682 | base $600 | +0.5pp $518 | +1.0pp $433 |
2-unit breakdown (identical units grouped — click to expand)
| Units | Beds | Baths | Est. rent |
|---|---|---|---|
| 2× units | 4 | 2 | $3,378 |
| #1 | 4 | 2 | $1,689 |
| #2 | 4 | 2 | $1,689 |
| Total (2 units) | $3,379 | ||
UW: 25.0% down · 7.5% · 30yr · 1.5% tax · 5.0% vac · 8.0% maint · 8.0% mgmt
Financing live
Cash to close
- Down payment
- $80,000
- Closing costs
- $9,600
- Reserves months
- —
- Total cash needed
- —
Loan-product check · same deal, 3 products live
Conventional
25% down · 7.5% · 30yr
- Down + closing
- —
- Monthly P&I
- —
- Monthly cashflow
- —
- DSCR
- —
- Eligible?
- —
Personal DTI + credit; lowest rate.
DSCR
20% down · 8.5% · 30yr
- Down + closing
- —
- Monthly P&I
- —
- Monthly cashflow
- —
- DSCR
- —
- Eligible?
- —
No personal income docs; deal must DSCR.
Hard money
10% down · 12.0% · 12mo
- Down + closing
- —
- Monthly P&I
- —
- Monthly cashflow
- —
- DSCR
- —
- Eligible?
- —
Short-term bridge; refi at stabilization.
Rent comps 17 comps
| Address | Beds | Baths | Sqft | Rent | $/sqft | DOM | Units | Dist |
|---|---|---|---|---|---|---|---|---|
| 4211 Woodland Ave Kansas City, MO | 4.0 | 2.5 | 1926 | $2,010 | $1.04 | 17d | 1 | 0.22mi |
| 4440 Troost Ave Kansas City, MO | 5.0 | 2.0 | 2400 | $2,250 | $0.94 | 44d | 1 | 0.44mi |
| 4444 Troost Ave Kansas City, MO | 5.0 | 2.0 | 2400 | $2,250 | $0.94 | 44d | 1 | 0.45mi |
| 4031 Campbell St Kansas City, MO | 4.0 | 1.5 | 2074 | $2,500 | $1.21 | 17d | 1 | 0.46mi |
| 3839 Harrison Blvd Kansas City, MO | 5.0 | 2.5 | 2709 | $2,950 | $1.09 | 44d | 1 | 0.54mi |
| 4511 Park Ave Kansas City, MO | 4.0 | 2.5 | 1915 | $1,982 | $1.03 | 24d | 1 | 0.65mi |
| 4018 Prospect Ave Kansas City, MO | 4.0 | 1.5 | 1900 | $1,695 | $0.89 | 44d | 1 | 0.73mi |
| 4138 Locust St Kansas City, MO | 4.0 | 2.0 | 1763 | $2,600 | $1.47 | 8d | 1 | 0.75mi |
| 3434 Olive St Kansas City, MO | 3.0 | 2.0 | 2020 | $1,445 | $0.72 | 44d | 1 | 1.09mi |
| 3606 S Benton Ave Kansas City, MO | 5.0 | 3.0 | 2800 | $2,000 | $0.71 | 44d | 1 | 1.14mi |
| 1330 Rockhurst Rd Kansas City, MO | 4.0 | 2.0 | 1984 | $2,500 | $1.26 | 44d | 1 | 1.19mi |
| 5218 Highland Ave Kansas City, MO | 5.0 | 2.0 | 2300 | $1,995 | $0.87 | 8d | 1 | 1.29mi |
| 5017 Grand Ave Kansas City, MO | 4.0 | 4.5 | 2000 | $4,600 | $2.30 | 22d | 1 | 1.36mi |
| 551 W 44th St Kansas City, MO | 1.0–3.0 | 1.0–3.5 | 1293 | $4,866 | $3.76 | 3d | 12 | 1.41mi |
| 3317 Agnes Ave Kansas City, MO | 5.0 | 2.0 | 2872 | $1,795 | $0.62 | 24d | 1 | 1.47mi |
| 912 E 31st St Kansas City, MO | 5.0 | 1.5 | 2200 | $1,800 | $0.82 | 17d | 1 | 1.48mi |
| 908 E 31st St Kansas City, MO | 5.0 | 1.5 | 2100 | $1,800 | $0.86 | 44d | 1 | 1.48mi |
Listing history 18 events
-
2026-04-28status Pending
-
2026-04-03price $320,000
-
2026-03-29price $350,000
-
2026-03-13price $380,000
-
2026-01-17$425,000 Active
-
2025-06-08historical $1,350
-
2025-05-22$1,350
-
2025-04-04historical $1,350
-
2025-03-27$1,350
-
2021-07-13soldstatus Closed 553-char remark
Show marketing remark (553 chars)
The address is 4200 and 4202 Flora Ave. Kansas City, MO. Very nice side by side duplex. New Roof - May 2021. 4200 Flora has new AC unit June 2019. Both units have: 4 bedrooms and 2 full baths with a bedroom and bath on the main level. Kitchen equipped with gas stove, refrigerator and dishwasher. 4200 Flora also has washer and dryer. 4202 Flora has washer and dryer hookups. Both units have ADT alarm system and 1 car garage. Vinyl siding and fenced yard. Well maintained income producing property. The property will be sold in its present condition.
-
2021-06-04status Pending 553-char remark
Show marketing remark (553 chars)
The address is 4200 and 4202 Flora Ave. Kansas City, MO. Very nice side by side duplex. New Roof - May 2021. 4200 Flora has new AC unit June 2019. Both units have: 4 bedrooms and 2 full baths with a bedroom and bath on the main level. Kitchen equipped with gas stove, refrigerator and dishwasher. 4200 Flora also has washer and dryer. 4202 Flora has washer and dryer hookups. Both units have ADT alarm system and 1 car garage. Vinyl siding and fenced yard. Well maintained income producing property. The property will be sold in its present condition.
-
2021-05-30$245,000 Active 553-char remark
Show marketing remark (553 chars)
The address is 4200 and 4202 Flora Ave. Kansas City, MO. Very nice side by side duplex. New Roof - May 2021. 4200 Flora has new AC unit June 2019. Both units have: 4 bedrooms and 2 full baths with a bedroom and bath on the main level. Kitchen equipped with gas stove, refrigerator and dishwasher. 4200 Flora also has washer and dryer. 4202 Flora has washer and dryer hookups. Both units have ADT alarm system and 1 car garage. Vinyl siding and fenced yard. Well maintained income producing property. The property will be sold in its present condition.
-
2019-02-06historical
-
2018-12-07status Active
-
2018-11-16status Pending
-
2018-09-04$225,000 Active
-
2017-05-29historical
-
2016-05-30$225,000 Active
ⓘ Source: listings_history table (triggers on properties + properties_extension) + one-shot
backfill from property_details.listing_events for pre-trigger history.
Tax reassessment forecast MO · Resets to sale price
- Current annual tax
- $2,424 · $202/mo
- Projected year-2 tax
- $3,104 · $259/mo
- Expected delta
- +$680/yr (+$57/mo · 28.1%)
ⓘ Screening estimate from a state-policy table — verify with the county assessor before closing.
Climate risk First Street
- Flood 9/10 Extreme FEMA zone X (unshaded) · 99% chance over 30 yrs
- Wildfire 1/10 Low
- Heat 4/10 Moderate 7 d/yr ≥106°F today · 17 d/yr by 30 yrs out
- Wind 2/10 Low
- Air quality 3/10 Moderate 2 unhealthy d/yr today · 3 by 30 yrs out
Nearby sold comps map
Loading sold comps map…
Walkable amenities ~0.75 mi
Loading nearby amenities…
Taxation est. · year 1
- Rental income
- $40,548
- − Mortgage interest
- −$17,925
- − Property taxes
- −$2,424
- − Insurance
- −$2,266
- − Repairs & maintenance
- −$3,244
- − Management
- −$3,244
- − Depreciation
- −$9,309
- Taxable income
- $2,136
- Est. tax owed @ 24.0%
- −$513
- After-tax cash flow
- $6,693/yr
For passive investors: Depreciation is non-cash, so a rental often shows a tax loss while cash-flowing — sheltering income. Rental losses are passive: they offset passive income freely, and up to $25,000/yr can offset ordinary (W-2) income if you actively participate and your MAGI is under $100k (phasing out to $0 by $150k); unused losses carry forward. On sale, claimed depreciation is recaptured at up to 25%, and gains may owe capital-gains tax (a 1031 exchange can defer both). Figures are a year-1 estimate at your 24.0% rate — not tax advice; consult a CPA.
Schools (NCES district)
- District
- Kansas City 33
- NCES district ID
- 2916400
- Math proficiency
- 12% ▼ -8.00%
- Reading proficiency
- 24% ▬ 0.00%
- Median HH income
- $35,227
- Composite
- 14.8/100
- National rank
- #9387
- State rank
- #308 of 324 in MO
Livability — Kansas City
- Score
- 78/100
- State rank
- #28
- US rank
- #2671
Category grades
Schools grade is shown separately in the Schools card above.
Census & demographics
- Census place
- Kansas City, MO
- County
- Jackson County · 687,798 people
- City population
- 439,467
- Metro
- Kansas City, MO-KS
- Population (ZIP)
- 16,878
- Household income
- $63,044
- Rent vs Own
- Severe rent burden
- 962.0
Population outlook (Jackson County) Hauer SSP2
- Today (2025)
- 719,589 people
- By 2030
- 731,456 · +1.6%
- By 2040
- 746,689 · +3.8%
- By 2050
- 749,289 · +4.1%
- By 2075
- 736,227 · +2.3%
- By 2100
- 668,210 · -7.1%
Race, ethnicity, and origin ACS 2023
- Neighborhood character
- Diverse neighborhood (Simpson 0.63)
- Race & ethnicity
- White 49% Black 34% Two or more races 10% Hispanic / Latino 9% Asian 2%
- Hispanic origin (detail)
- Mexican 6%
- Common ancestry
- Romanian 2% Lithuanian 2% Italian 2%
- Foreign-born
- 4% · Canada
- Languages at home
- 92% English-only · Spanish 6% French/Haitian/Cajun 1% Other Indo-European 1%
Political lean MEDSL · Jackson
- 2024 margin
- D (+19.3) · D 58.9% · R 39.5% · Other 1.6%
- 2008→2024 swing
- -6.1pp toward R · 2008: 25.4pp · 2024: 19.3pp
- All cycles
- 2024: D+19.3 2020: D+22.0 2016: D+16.6 2012: D+19.0 2008: D+25.4
Not yet ingested
- Civics
- —
Market trends
- HPI YoY
- ▼ -514.37%
- Current HPI
- 371.8501
- Rent YoY
- ▲ 3.95%
- Metro
- Kansas City, MO-KS
- State GDP YoY
- ▲ 1.84%
- F500 in state
- 20
Industry mix (Fortune 500 HQ in MO)
| Industry | F500 HQs | Revenue |
|---|---|---|
| Healthcare | 1 | $163B |
|
||
| Insurance | 1 | $21B |
|
||
| Industrial Technology | 1 | $17B |
|
||
| Retail | 1 | $16B |
|
||
| Industrial Distribution | 1 | $10B |
|
||
| Utilities | 1 | $9B |
|
||
Price history
+42.2% since first listed18 events — show timeline
- 2026-04-28 Pending — Heartland MLS as Distributed by MLS Grid
- 2026-04-03 Price Changed $320,000 Heartland MLS as Distributed by MLS Grid
- 2026-03-29 Price Changed $350,000 Heartland MLS as Distributed by MLS Grid
- 2026-03-13 Price Changed $380,000 Heartland MLS as Distributed by MLS Grid
- 2026-01-17 Listed $425,000 Heartland MLS as Distributed by MLS Grid
- 2025-06-08 Rental Removed $1,350 SHOWMOJO
- 2025-05-22 Listed for Rent $1,350 SHOWMOJO
- 2025-04-04 Rental Removed $1,350 SHOWMOJO
- 2025-03-27 Listed for Rent $1,350 SHOWMOJO
- 2021-07-13 Sold (MLS) — Heartland MLS as Distributed by MLS Grid
- 2021-06-04 Pending — Heartland MLS as Distributed by MLS Grid
- 2021-05-30 Listed $245,000 Heartland MLS as Distributed by MLS Grid
- 2019-02-06 Listing Removed — Heartland MLS as Distributed by MLS Grid
- 2018-12-07 Relisted — Heartland MLS as Distributed by MLS Grid
- 2018-11-16 Pending — Heartland MLS as Distributed by MLS Grid
- 2018-09-04 Listed $225,000 Heartland MLS as Distributed by MLS Grid
- 2017-05-29 Listing Removed — Heartland MLS as Distributed by MLS Grid
- 2016-05-30 Listed $225,000 Heartland MLS as Distributed by MLS Grid
Property tax history
+5.2%/yrLatest (2025): $2,424 · -39.4% YoY. Source: county tax records.
Cash-flow waterfall
monthlySold comps — $/sqft
last 12 mo · ≤1 miLoading sold comps…