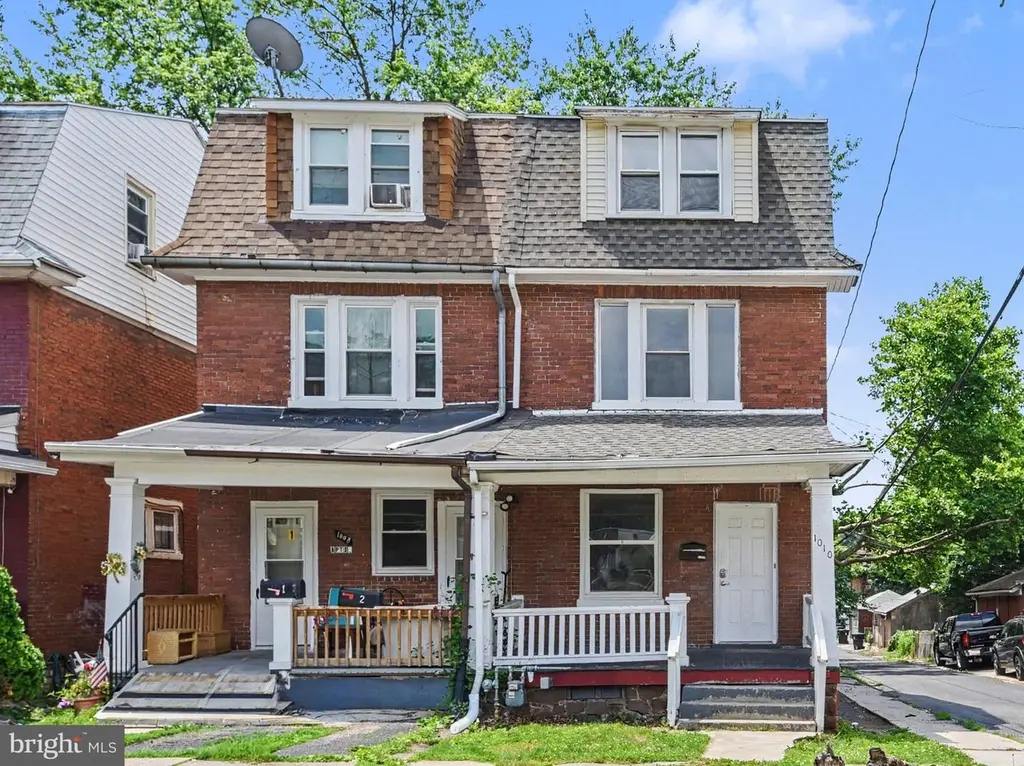
1010 N 18th St · Harrisburg, PA
Flood risk 1/10 · Minimal
- FEMA flood zone
- X (unshaded)
- Chance of flooding over 30 yrs
- 0.0%
- Est. flood insurance / yr
- $473 – $860
Fire risk 1/10 · Minimal
- Est. fire insurance / yr
- $511 – $949
Heat risk 5/10 · Moderate
- Hot days now (above 100°F)
- 7 days/yr
- Hot days in 30 yrs
- 15 days/yr
Wind risk 3/10 · Minor
- Chance of severe wind over 30 yrs
- 5.0%
Air-quality risk 2/10 · Minimal
- Unhealthy air days now
- 1 days/yr
- Unhealthy air days in 30 yrs
- 3 days/yr
Risk factors via First Street. Map © Google.
Why this score? — see what drove the C+ grade
The composite is a weighted blend of 9 inputs, each scored 0–100. Each bar is that input's sub-score; the figure is the points it added to the 100-point composite (weight × sub-score).
- Cash flow +25.2/30.0
- ARV discount +8.5/15.0
- DSCR +8.3/10.0
- 1% rule +6.9/10.0
- Rent growth +4.8/5.0
- Livability +4.2/5.0
- Condition / age +2.5/5.0
- Schools +0.8/10.0
- Appreciation +0.0/10.0
$160,000
🖨 Deal sheet 📄 Offer letter ✓ Due diligence
Listing remarks MLS
Nice end unit row home ready for its next family. Conveniently located to the Farm show complex, down town HBG, and interstates. The home features original hard wood floors through out, Updated Kitchen and bath, Newer windows, and appliances. 1st floor is the living room, dining room, kitchen. and laundry room off of the kitchen. 2nd floor has 3 bedrooms and a full bath. the 3rd floor is one large bedroom. Plenty of room to spread out.
Key facts
- Main level living
- Own balcony
- Dining spaces
Tags
Property features AI
Exterior
- Parking: On-street parking
- Utilities: Natural gas heating and hot water; Public water; Public septic
- Home design: End of row townhouse; Fee simple ownership
- Construction: Brick construction; Permanent foundation; Above grade and below grade structures; Built (year source: assessor)
- Exterior features: Not in a federal flood zone
Interior
- Kitchen: Kitchen
- Bedrooms: Three bedrooms on the first upper level; Two bedrooms on the second upper level; Master bedroom
- Bathrooms: One full bathroom
- Heating & cooling: Steam heating; Natural gas hot water
- Interior features: Full basement; Two or more access exits; Living Room; Dining Room
- Laundry & utility: Laundry
Neighborhood map
What this means for you Summary
Snapshot
- This is a 5-bed/1.0-bath townhouse listed at $160k.
Deal economics
- At list price, monthly cash flow is $360 ($4k/yr) — positive.
- The deal already cash-flows at list — no discount required.
- Meets the 1% rule at list price ($2k rent vs $160k).
- Cap rate 9.0% vs local median 6.6% in Harrisburg — top-decile yield for the area; either an underpriced asset or a hidden risk that comps aren't pricing in. Stress-test before assuming the spread holds.
Location & tenants
- Location reads 84/100 on livability (#107 in PA, #826 nationally) — a professional / high-income tenant draw. Strengths: amenities A+, commute A+, cost of living A+; Watch: employment D, crime F.
- Harrisburg City SD (urban): math 6% / reading 13% proficiency, ranked #535 of 539 in PA (top 99%) — low school quality limits family demand, transient renter base, plan for 1-2y turnover; 82% free/reduced lunch — lower-income household profile, screen leases tightly.
- Zoned schools: Harrisburg Hs (math 24% / reading 10%, grade F, #399 of 437 statewide, top 92%, 1,230 students, 100% FRL) — zoned schools average 100% FRL vs 82% district-wide (18 pts higher); higher-poverty schools than district average — tighter screening recommended.
- Market conditions: Rents rising fast (+9.1%/yr); 66 active listings in the ZIP; 16 comparable units currently listed for rent nearby; rentals at typical pace (median 24d on market — plan ~3-4 weeks tenant-placement turnaround); lower-income renter base — watch delinquency; 540 units permitted in Dauphin County in 2024 (194 in 5+ unit buildings).
- At $1,901/mo this rent would consume 57% of the median local household income ($40k/yr) (locally 1014% of renters already pay >50% of income on rent) — very limited rent-growth headroom before tenants either downsize or default.
Forward outlook
- Local home prices are declining (-3.0%/yr); year-one equity from $1k of loan paydown is wiped out by about $5k of value loss. Plan a longer hold.
- At projected returns (-3.0% appreciation + 8.0% rent growth), your $45k cash investment doubles in ~8 years — after that, you're playing with house money.
Negotiation context
- Only 6 days on market — expect competitive offers; lowballing is unlikely to land.
- 7 sale attempts since 17y ago with the ask held roughly flat each time — persistent listings suggest the price (not the market) is what's stuck; bring a comps-based counter.
- Current owner paid $87k; list at $160k implies a 84% gain — meaningful room to come down on a strong offer.
Risks & watch-outs
- Watch-outs: built in 1916 — expect roof / HVAC / electrical / plumbing capex.
- Climate carrying-cost: extreme-heat days projected 7→15/yr by 2055 (HVAC capex compounding) — expect insurance premiums to compound above CPI over the hold.
Questions for the listing agent
- Built in 1916 — when were the roof, HVAC, electrical panel, plumbing, and water heater last replaced?
- Is there a deadline driving the sale (1031 exchange, divorce, estate, relocation)? That informs how much negotiation room exists.
- Crime grade is F in this area — have there been break-ins, vandalism, or insurance claims at this property in the last 3 years? What carrier currently insures it and at what premium?
- What's the average days-on-market for RENTAL listings here right now (not sales)? A rising rental-DOM trend means longer vacancies and softer asking-rent achievability than the comps imply.
- What's the recent tenant-quality profile in this submarket — average credit score on applications, eviction rate, late-payment / NSF rate, and stable-employment percentage? A property-management company in the area should have these aggregated.
- How much new for-sale + rental construction is in the pipeline within 1–3 miles? Heavy new supply typically softens prices + rents 12–24 months out; constrained supply supports both.
Investment metrics
- 1% rule
- 1.19% ✓
- Cap rate
- 8.99%
- Cash-on-cash
- 9.64%
- DSCR
- 1.43
- GRM
- 7.0
CMA / ARV
- ARV (on-the-fly)
- $163,800
- Comps found
- 12
Show comp detail 12 sales within ~0.75 mi
| Address | Dist | Beds/Ba | Sqft | Sold | Price | $/sf | Match |
|---|---|---|---|---|---|---|---|
| 1204 N 16th St | 0.19mi | 6/— (+1) | 2,246 (-4%) | 1mo | $177,000 | $79 | 79 |
| 1641 Market St | 0.60mi | 5/1.0 | 2,316 (-1%) | 3mo | $150,000 | $65 | 68 |
| 1614 Herr St | 0.12mi | 5/1.5 | 2,039 (-13%) | 8mo | $155,000 | $76 | 65 |
| 1624 State St | 0.29mi | 4/3.5 (-1) | 2,313 (-1%) | 7mo | $200,000 | $86 | 64 |
| 1500 State St | 0.35mi | 4/2.5 (-1) | 2,499 (+7%) | 2mo | $150,000 | $60 | 60 |
| 1726 North St | 0.18mi | 6/3.5 (+1) | 2,120 (-9%) | 6mo | $215,000 | $101 | 56 |
| 142 Balm St | 0.58mi | 4/1.0 (-1) | 2,430 (+4%) | 7mo | $75,000 | $31 | 56 |
| 208 N 15th St | 0.48mi | 5/1.0 | 2,080 (-11%) | 5mo | $80,001 | $38 | 55 |
| 1625 Market St | 0.61mi | 4/1.5 (-1) | 2,256 (-4%) | 8mo | $189,900 | $84 | 52 |
| 48 N 17th St | 0.49mi | 5/1.0 | 2,016 (-14%) | 9mo | $100,000 | $50 | 47 |
| 22 S 17th St | 0.64mi | 4/2.0 (-1) | 2,137 (-9%) | 1mo | $150,000 | $70 | 46 |
| 26 N 16th St | 0.55mi | 5/2.0 | 2,051 (-12%) | 11mo | $112,000 | $55 | 41 |
Match score weights: distance 35% · size 25% · config 20% · recency 20%. Top-matched comps best support the ARV.
Projected returns pro-forma
-3.0% appreciation · 8.0% rent growth · sell at horizon
- IRR
- 3.9%
- Equity multiple
- 1.16×
- Total profit
- $7,089
- Equity at exit
- $23,857
- IRR
- 17.7%
- Equity multiple
- 2.82×
- Total profit
- $81,615
- Equity at exit
- $13,834
Cash invested: $44,800 (down + closing). Projections, not guarantees.
Landlord ↔ Tenant lean methodology
- Overall (STATE)
- 62 Landlord-Friendly
- State Pennsylvania
- 62 Landlord-Friendly · EVEN
- County
- — inherits STATE
- City
- — inherits STATE
ZIP-level market 17103
- Rents YoY
- 9.1%
- Active inventory
- 66
- Price-to-rent
- 7.0×
Monthly cashflow live
- Estimated rent
- $1,901 high interval (Pro) →
- Mortgage (P&I)
- −$839
- Tax from tax record
- −$236 /mo · $2,833/yr
- Insurance
- −$67
- HOA
- −$0
- Vacancy / Maint / Mgmt
- −$399
- Net cashflow
- $360
Break-even live
UW: 25.0% down · 7.5% · 30yr · 1.5% tax · 5.0% vac · 8.0% maint · 8.0% mgmt
Financing live
Cash to close
- Down payment
- $40,000
- Closing costs
- $4,800
- Reserves months
- —
- Total cash needed
- —
Loan-product check · same deal, 3 products live
Conventional
25% down · 7.5% · 30yr
- Down + closing
- —
- Monthly P&I
- —
- Monthly cashflow
- —
- DSCR
- —
- Eligible?
- —
Personal DTI + credit; lowest rate.
DSCR
20% down · 8.5% · 30yr
- Down + closing
- —
- Monthly P&I
- —
- Monthly cashflow
- —
- DSCR
- —
- Eligible?
- —
No personal income docs; deal must DSCR.
Hard money
10% down · 12.0% · 12mo
- Down + closing
- —
- Monthly P&I
- —
- Monthly cashflow
- —
- DSCR
- —
- Eligible?
- —
Short-term bridge; refi at stabilization.
Rent comps 16 comps
| Address | Beds | Baths | Sqft | Rent | $/sqft | DOM | Units | Dist |
|---|---|---|---|---|---|---|---|---|
| 1708 State St Harrisburg, PA | 5.0 | 1.5 | 2320 | $1,745 | $0.75 | 21d | 1 | 0.29mi |
| 111 N 17th St Harrisburg, PA | 5.0 | 1.0 | 1800 | $1,850 | $1.03 | 14d | 1 | 0.36mi |
| 66 N 17th St Harrisburg, PA | 5.0 | 2.0 | 1845 | $2,195 | $1.19 | 43d | 1 | 0.47mi |
| 14 S 17th St Harrisburg, PA | 5.0 | 2.0 | 2136 | $1,695 | $0.79 | 14d | 1 | 0.65mi |
| 2368 Canby St Harrisburg, PA | 6.0 | 2.0 | 2142 | $2,300 | $1.07 | 21d | 1 | 0.74mi |
| 227 Hummel St Harrisburg, PA | 5.0 | 2.0 | 2696 | $1,600 | $0.59 | 43d | 1 | 0.97mi |
| 2315 Magnolia Dr Harrisburg, PA | 4.0 | 3.5 | 3300 | $3,000 | $0.91 | 14d | 1 | 1.03mi |
| 1610 Hunter St Harrisburg, PA | 4.0 | 1.0 | 1776 | $1,450 | $0.82 | 23d | 1 | 1.06mi |
| 1414 Berryhill St Harrisburg, PA | 5.0 | 2.0 | 1786 | $1,700 | $0.95 | 23d | 1 | 1.13mi |
| 1716 N 6th St Unit NA Harrisburg, PA | 4.0 | 4.0 | 2400 | $2,000 | $0.83 | 23d | 1 | 1.13mi |
| 1716 N 6th St Harrisburg, PA | 4.0 | 3.5 | 2400 | $2,200 | $0.92 | 43d | 1 | 1.13mi |
| 301 Chestnut St Harrisburg, PA | 4.0 | 1.0–2.5 | 1437 | $3,000 | $2.09 | 14d | 10 | 1.27mi |
| 301 Chestnut St Harrisburg, PA | 1.0–4.0 | 1.0–2.5 | 1437 | $2,600 | $1.81 | 43d | 1 | 1.27mi |
| 1330 Susquehanna St Harrisburg, PA | 4.0 | 1.5 | 2280 | $1,895 | $0.83 | 23d | 1 | 1.30mi |
| 1202 Penn St Harrisburg, PA | 4.0 | 1.0 | 1706 | $1,495 | $0.88 | 43d | 1 | 1.36mi |
| 1834 Green St Harrisburg, PA | 4.0 | 1.0 | 1792 | $1,495 | $0.83 | 23d | 1 | 1.49mi |
Listing history 6 events
-
2026-06-18days on market $160,000 Active 6 DOM
-
2026-06-17days on market $160,000 Active 5 DOM
-
2026-06-16days on market $160,000 Active 4 DOM
-
2026-06-15days on market $160,000 Active 3 DOM
-
2026-06-13remarks 530-char remark
-
2026-06-13$160,000 Active 1 DOM
ⓘ Source: listings_history table (triggers on properties + properties_extension) + one-shot
backfill from property_details.listing_events for pre-trigger history.
Tax reassessment forecast PA · Partial reset (capped growth)
- Current annual tax
- $2,833 · $236/mo
- Projected year-2 tax
- $2,833 · $236/mo
- Expected delta
- $0/yr ($0/mo · -0.0%)
ⓘ Screening estimate from a state-policy table — verify with the county assessor before closing.
Climate risk First Street
- Flood 1/10 Low FEMA zone X (unshaded) · 0% chance over 30 yrs
- Wildfire 1/10 Low
- Heat 5/10 Major 7 d/yr ≥100°F today · 15 d/yr by 30 yrs out
- Wind 3/10 Moderate 5% chance of damaging wind over 30 yrs
- Air quality 2/10 Low 1 unhealthy d/yr today · 3 by 30 yrs out
Nearby sold comps map
Loading sold comps map…
Walkable amenities ~0.75 mi
Loading nearby amenities…
Taxation est. · year 1
- Rental income
- $22,811
- − Mortgage interest
- −$8,962
- − Property taxes
- −$2,833
- − Insurance
- −$800
- − Repairs & maintenance
- −$1,825
- − Management
- −$1,825
- − Depreciation
- −$4,655
- Taxable income
- $1,911
- Est. tax owed @ 24.0%
- −$459
- After-tax cash flow
- $3,860/yr
For passive investors: Depreciation is non-cash, so a rental often shows a tax loss while cash-flowing — sheltering income. Rental losses are passive: they offset passive income freely, and up to $25,000/yr can offset ordinary (W-2) income if you actively participate and your MAGI is under $100k (phasing out to $0 by $150k); unused losses carry forward. On sale, claimed depreciation is recaptured at up to 25%, and gains may owe capital-gains tax (a 1031 exchange can defer both). Figures are a year-1 estimate at your 24.0% rate — not tax advice; consult a CPA.
Schools (NCES district)
- District
- Harrisburg City SD
- NCES district ID
- 4211580
- Math proficiency
- 6% ▼ -6.00%
- Reading proficiency
- 13% ▼ -10.00%
- Median HH income
- $33,432
- Composite
- 7.6/100
- National rank
- #9945
- State rank
- #535 of 539 in PA
Livability — Harrisburg
- Score
- 84/100
- State rank
- #107
- US rank
- #826
Category grades
Schools grade is shown separately in the Schools card above.
Census & demographics
- Census place
- Harrisburg, PA
- County
- Dauphin County · 247,857 people
- City population
- 184,296
- Metro
- Harrisburg-Carlisle, PA
- Population (ZIP)
- 13,115
- Household income
- $39,825
- Rent vs Own
- Severe rent burden
- 1014.0
Population outlook (Dauphin County) Hauer SSP2
- Today (2025)
- 281,628 people
- By 2030
- 283,549 · +0.7%
- By 2040
- 285,385 · +1.3%
- By 2050
- 286,188 · +1.6%
- By 2075
- 291,053 · +3.3%
- By 2100
- 282,374 · +0.3%
Race, ethnicity, and origin ACS 2023
- Neighborhood character
- Diverse neighborhood (Simpson 0.66)
- Race & ethnicity
- Black 47% Hispanic / Latino 31% White 18% Two or more races 10%
- Hispanic origin (detail)
- Mexican 4% Puerto Rican 18% Dominican 5%
- Common ancestry
- Hispanic 1% Romanian 1% Italian 1%
- Foreign-born
- 9% · Canada
- Languages at home
- 83% English-only · Spanish 11% French/Haitian/Cajun 2% Tagalog/Filipino 1%
Political lean MEDSL · Dauphin
- 2024 margin
- Lean D (+5.9) · D 52.4% · R 46.5% · Other 1.1%
- 2008→2024 swing
- -3.1pp toward R · 2008: 9.1pp · 2024: 5.9pp
- All cycles
- 2024: D+5.9 2020: D+8.5 2016: D+2.8 2012: D+6.0 2008: D+9.1
Not yet ingested
- Civics
- —
Market trends
- HPI YoY
- ▼ -119.52%
- Current HPI
- 211.455
- Rent YoY
- ▲ 9.09%
- Metro
- Harrisburg-Carlisle, PA
- State GDP YoY
- ▲ 1.68%
- F500 in state
- 34
Industry mix (Fortune 500 HQ in PA)
| Industry | F500 HQs | Revenue |
|---|---|---|
| Healthcare | 2 | $309B |
|
||
| Insurance | 2 | $27B |
|
||
| Telecommunications / Media | 1 | $124B |
|
||
| Industrial Distribution | 1 | $22B |
|
||
| Financial Services | 1 | $20B |
|
||
| Chemicals / Materials | 1 | $18B |
|
||
Price history
+185.7% since first listed19 events — show timeline
- 2026-06-12 Listed $160,000 BRIGHT MLS
- 2024-05-15 Rental Removed $1,595 APPFOLIO
- 2024-04-10 Listed for Rent $1,595 APPFOLIO
- 2024-04-10 Rental Removed — APPFOLIO
- 2024-03-13 Listed for Rent — APPFOLIO
- 2022-11-11 Rental Removed — APPFOLIO
- 2022-08-08 Sold (MLS) $87,000 BRIGHT MLS
- 2022-07-26 Pending — BRIGHT MLS
- 2022-07-19 Listed $87,000 BRIGHT MLS
- 2022-07-15 Coming Soon $87,000 BRIGHT MLS
- 2014-12-15 Sold (MLS) $20,000 BRIGHT MLS
- 2014-11-23 Listing Removed — BRIGHT MLS
- 2013-11-22 Listed $28,500 BRIGHT MLS
- 2012-03-31 Listing Removed — BRIGHT MLS
- 2011-09-21 Listed $69,900 BRIGHT MLS
- 2009-11-20 Sold (MLS) $28,100 BRIGHT MLS
- 2009-10-06 Listing Removed — BRIGHT MLS
- 2009-09-15 Listed $32,500 BRIGHT MLS
- 1999-01-28 Sold (Public Records) $56,000 Public Records
Property tax history
+1.0%/yrLatest (2026): $2,833 · +1.7% YoY. Source: county tax records.
Cash-flow waterfall
monthlySold comps — $/sqft
last 12 mo · ≤1 miLoading sold comps…