 Duplex
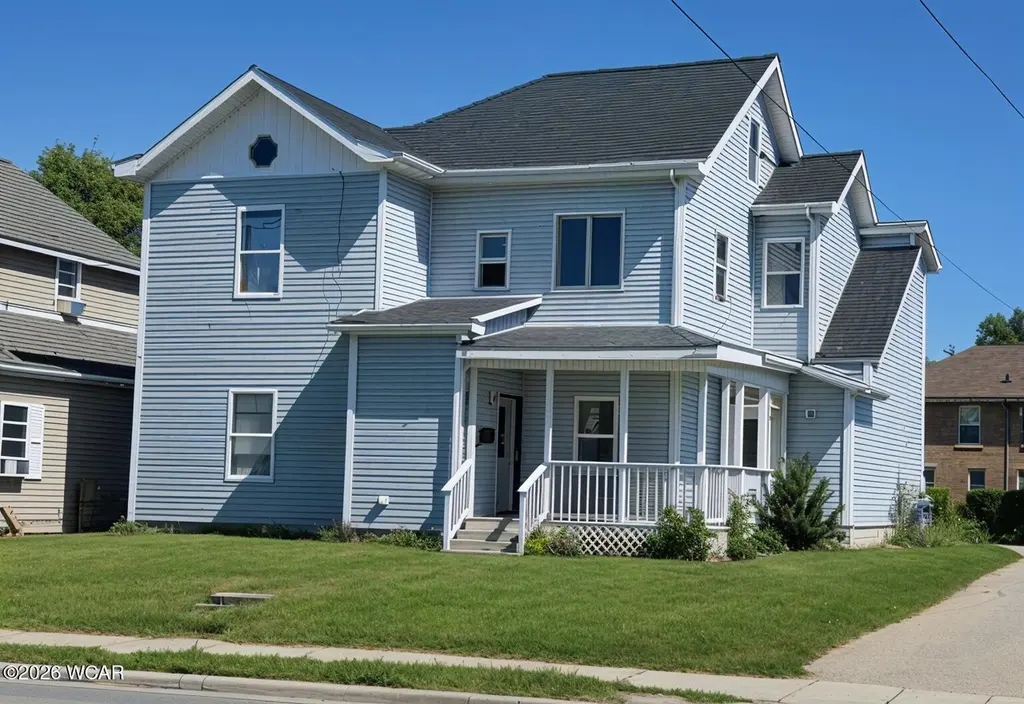
614 W Wayne St · Lima, OH
Flood risk 1/10 · Minimal
- FEMA flood zone
- X (unshaded)
- Chance of flooding over 30 yrs
- 0.0%
- Est. flood insurance / yr
- $473 – $860
Fire risk 1/10 · Minimal
- Est. fire insurance / yr
- $713 – $1,323
Heat risk 3/10 · Minor
- Hot days now (above 100°F)
- 7 days/yr
- Hot days in 30 yrs
- 18 days/yr
Wind risk 2/10 · Minimal
- Chance of severe wind over 30 yrs
- —
Air-quality risk 2/10 · Minimal
- Unhealthy air days now
- 1 days/yr
- Unhealthy air days in 30 yrs
- 2 days/yr
Risk factors via First Street. Map © Google.
Why this score? — see what drove the B- grade
The composite is a weighted blend of 9 inputs, each scored 0–100. Each bar is that input's sub-score; the figure is the points it added to the 100-point composite (weight × sub-score).
- Cash flow +30.0/30.0
- 1% rule +10.0/10.0
- DSCR +10.0/10.0
- ARV discount +7.5/15.0
- Livability +3.2/5.0
- Schools +2.6/10.0
- Rent growth +2.5/5.0
- Condition / age +2.5/5.0
- Appreciation +0.0/10.0
$160,000
🖨 Deal sheet 📄 Offer letter ✓ Due diligence
Multi-family units
County records classify this as Multi-Family (2-4 Unit). Listing-text estimate: 2 units. confirmed
Listing remarks
MAJOR PRICE REDUCTION! What a great investment opportunity for rental income! This centrally investment property would help you investment package complete near hospital and new downtown developments! See this 2 unit property in person by appointment with a minimum 24 hour notice for tenants rights! Details: 3 story, 7 bedroom, 3.5 bath, parking for 9, shared U shape driveway, Zoned Class 2.
Key facts
- Near hospital
- Zoned class 2
- Centrally located
Tags
Property features AI
Finance
- Financial info: $752 annual tax amount
Exterior
- Parking: Off-street parking
- Utilities: Public water; Public sewer; Electricity connected; Natural gas available; Water connected
- Home design: Multi-family residential income property; Three or more levels
- Construction: Vinyl siding; Asphalt roof; Block/other foundation; Built with multi-family zoning
- Exterior features: Covered patio/porch, deck, and patio
Interior
- Bathrooms: 3 full bathrooms; 1 half bathroom
- Heating & cooling: Forced air heating (electric and natural gas); Window air conditioning units
- Interior features: Basement present; unfinished block/other basement
Neighborhood map
What this means for you Summary
Snapshot
- This is a 2 × 9.0-bed/3.5-bath units multifamily listed at $160k.
Deal economics
- At list price, monthly cash flow is $2k ($20k/yr) — positive. Per door: $828/mo.
- The deal already cash-flows at list — no discount required.
- Meets the 1% rule at list price ($3k rent vs $160k).
- Recommended offer: $158k (1.5% below list) — sets the bar for market timing.
- Cap rate 18.7% vs local median 7.7% in Lima — top-decile yield for the area; either an underpriced asset or a hidden risk that comps aren't pricing in. Stress-test before assuming the spread holds.
Location & tenants
- Location reads 64/100 on livability (#787 in OH) — a middle-class / working-renter tenant base. Strengths: cost of living A+, housing A+, health & safety A-; Watch: crime F, amenities F, commute F.
- Lima City (urban): math 29% / reading 36% proficiency, ranked #575 of 656 in OH (top 88%) — families likely to look elsewhere, expect single-tenant / working-renter base with shorter leases; 83% free/reduced lunch — lower-income household profile, screen leases tightly.
- Market conditions: 74 active listings in the ZIP; 1 comparable units currently listed for rent nearby; 88 units permitted in Allen County in 2024 (0 in 5+ unit buildings).
- At $3,330/mo this rent would consume 77% of the median local household income ($52k/yr) (locally 1141% of renters already pay >50% of income on rent) — very limited rent-growth headroom before tenants either downsize or default.
Forward outlook
- Local home prices are declining (-3.0%/yr); year-one equity from $1k of loan paydown is wiped out by about $5k of value loss. Plan a longer hold.
- Allen County population projected at -14% by 2050 — secular population decline; favor cash flow + early exit over multi-decade hold.
- At projected returns (-3.0% appreciation + 3.0% rent growth), your $45k cash investment doubles in ~3 years — after that, you're playing with house money.
Negotiation context
- It's been on market 17 days — a 2% lower offer ($158k) is reasonable based on typical stale-listing flexibility.
- 5 sale attempts since 3y ago; this cycle's ask has dropped $40k (20%) from the opening price — seller is motivated, your offer sets the floor, not the list.
Risks & watch-outs
- Watch-outs: built in 1920 — expect roof / HVAC / electrical / plumbing capex.
Questions for the listing agent
- Can we see the unit-by-unit rent roll, current vacancy, and any below-market leases? What's the average tenancy length?
- What capital expenditures (roof, boiler, parking lot, exteriors) have been made in the last 5 years, and what's planned in the next 2?
- Built in 1920 — when were the roof, HVAC, electrical panel, plumbing, and water heater last replaced?
- Is there a deadline driving the sale (1031 exchange, divorce, estate, relocation)? That informs how much negotiation room exists.
- Crime grade is F in this area — have there been break-ins, vandalism, or insurance claims at this property in the last 3 years? What carrier currently insures it and at what premium?
- What's the average days-on-market for RENTAL listings here right now (not sales)? A rising rental-DOM trend means longer vacancies and softer asking-rent achievability than the comps imply.
- What's the recent tenant-quality profile in this submarket — average credit score on applications, eviction rate, late-payment / NSF rate, and stable-employment percentage? A property-management company in the area should have these aggregated.
- How much new apartment / multifamily construction is in the pipeline within 1–3 miles? Heavy new supply (>2% of stock underway) typically softens rents 12–24 months out; light construction supports rent growth.
Investment metrics
- 1% rule
- 2.08% ✓
- Cap rate
- 18.72%
- Cash-on-cash
- 44.37%
- DSCR
- 2.97
- GRM
- 4.0
CMA / ARV
No comps found within radius.
Projected returns pro-forma
-3.0% appreciation · 3.0% rent growth · sell at horizon
- IRR
- 41.3%
- Equity multiple
- 2.78×
- Total profit
- $79,539
- Equity at exit
- $23,857
- IRR
- 47.6%
- Equity multiple
- 5.58×
- Total profit
- $204,981
- Equity at exit
- $13,834
Cash invested: $44,800 (down + closing). Projections, not guarantees.
Landlord ↔ Tenant lean methodology
- Overall (STATE)
- 73 Landlord-Friendly
- State Ohio
- 73 Landlord-Friendly · R+6
- County
- — inherits STATE
- City
- — inherits STATE
ZIP-level market 45801
- Active inventory
- 74
- Price-to-rent
- 8.0×
Monthly cashflow live
- Estimated rent
- $3,330 medium interval (Pro) →
- Mortgage (P&I)
- −$839
- Tax from tax record
- −$69 /mo · $823/yr
- Insurance
- −$67
- HOA
- −$0
- Vacancy / Maint / Mgmt
- −$699
- Net cashflow
- $1,656
Break-even live
2-unit breakdown (identical units grouped — click to expand)
| Units | Beds | Baths | Est. rent |
|---|---|---|---|
| 2× units | 9.0 | 3.5 | $3,330 |
| #1 | 9.0 | 3.5 | $1,665 |
| #2 | 9.0 | 3.5 | $1,665 |
| Total (2 units) | $3,330 | ||
UW: 25.0% down · 7.5% · 30yr · 1.5% tax · 5.0% vac · 8.0% maint · 8.0% mgmt
Financing live
Cash to close
- Down payment
- $40,000
- Closing costs
- $4,800
- Reserves months
- —
- Total cash needed
- —
Loan-product check · same deal, 3 products live
Conventional
25% down · 7.5% · 30yr
- Down + closing
- —
- Monthly P&I
- —
- Monthly cashflow
- —
- DSCR
- —
- Eligible?
- —
Personal DTI + credit; lowest rate.
DSCR
20% down · 8.5% · 30yr
- Down + closing
- —
- Monthly P&I
- —
- Monthly cashflow
- —
- DSCR
- —
- Eligible?
- —
No personal income docs; deal must DSCR.
Hard money
10% down · 12.0% · 12mo
- Down + closing
- —
- Monthly P&I
- —
- Monthly cashflow
- —
- DSCR
- —
- Eligible?
- —
Short-term bridge; refi at stabilization.
Rent comps 1 comps
| Address | Beds | Baths | Sqft | Rent | $/sqft | DOM | Units | Dist |
|---|---|---|---|---|---|---|---|---|
| 555 Haller St Lima, OH | 3.0 | 2.0 | 1953 | $1,700 | $0.87 | 43d | 1 | 0.29mi |
Listing history 14 events
-
2026-06-19days on market $160,000 Active 17 DOM
-
2026-06-18days on market $160,000 Active 16 DOM
-
2026-06-17days on market $160,000 Active 15 DOM
-
2026-06-16days on market $160,000 Active 14 DOM
-
2026-06-15days on market $160,000 Active 13 DOM
-
2026-06-14days on market $160,000 Active 11 DOM
-
2026-06-12days on market $160,000 Active 10 DOM
-
2026-06-09remarks 401-char remark
-
2026-06-09pricedays on market $160,000 Active 7 DOM
-
2026-06-08days on market $200,000 Active 6 DOM
-
2026-06-07days on market $200,000 Active 5 DOM
-
2026-06-07days on market $200,000 Active 4 DOM
-
2026-06-03remarks 393-char remark
-
2026-06-03$200,000 Active 1 DOM
ⓘ Source: listings_history table (triggers on properties + properties_extension) + one-shot
backfill from property_details.listing_events for pre-trigger history.
Tax reassessment forecast OH · Partial reset (capped growth)
- Current annual tax
- $823 · $69/mo
- Projected year-2 tax
- $1,660 · $138/mo
- Expected delta
- +$836/yr (+$70/mo · 101.6%)
ⓘ Screening estimate from a state-policy table — verify with the county assessor before closing.
Climate risk First Street
- Flood 1/10 Low FEMA zone X (unshaded) · 0% chance over 30 yrs
- Wildfire 1/10 Low
- Heat 3/10 Moderate 7 d/yr ≥100°F today · 18 d/yr by 30 yrs out
- Wind 2/10 Low
- Air quality 2/10 Low 1 unhealthy d/yr today · 2 by 30 yrs out
Nearby sold comps map
Loading sold comps map…
Walkable amenities ~0.75 mi
Loading nearby amenities…
Taxation est. · year 1
- Rental income
- $39,960
- − Mortgage interest
- −$8,962
- − Property taxes
- −$823
- − Insurance
- −$800
- − Repairs & maintenance
- −$3,197
- − Management
- −$3,197
- − Depreciation
- −$4,655
- Taxable income
- $18,326
- Est. tax owed @ 24.0%
- −$4,398
- After-tax cash flow
- $15,478/yr
For passive investors: Depreciation is non-cash, so a rental often shows a tax loss while cash-flowing — sheltering income. Rental losses are passive: they offset passive income freely, and up to $25,000/yr can offset ordinary (W-2) income if you actively participate and your MAGI is under $100k (phasing out to $0 by $150k); unused losses carry forward. On sale, claimed depreciation is recaptured at up to 25%, and gains may owe capital-gains tax (a 1031 exchange can defer both). Figures are a year-1 estimate at your 24.0% rate — not tax advice; consult a CPA.
Schools (NCES district)
- District
- Lima City
- NCES district ID
- 3904422
- Math proficiency
- 29% ▼ -13.00%
- Reading proficiency
- 36% ▼ -6.00%
- Median HH income
- $29,685
- Composite
- 26.31/100
- National rank
- #7243
- State rank
- #575 of 656 in OH
Livability — Lima
- Score
- 64/100
- State rank
- #787
- US rank
- #14288
Category grades
Schools grade is shown separately in the Schools card above.
Census & demographics
- Census place
- Lima, OH
- County
- Allen County · 21,739 people
- City population
- 21,739
- Metro
- Lima, OH
- Population (ZIP)
- 21,739
- Household income
- $51,731
- Rent vs Own
- Severe rent burden
- 1141.0
Population outlook (Allen County) Hauer SSP2
- Today (2025)
- 100,321 people
- By 2030
- 97,693 · -2.6%
- By 2040
- 91,802 · -8.5%
- By 2050
- 86,152 · -14.1%
- By 2075
- 73,659 · -26.6%
- By 2100
- 58,716 · -41.5%
Race, ethnicity, and origin ACS 2023
- Neighborhood character
- Predominantly White (71%)
- Race & ethnicity
- White 71% Black 14% Two or more races 8% Hispanic / Latino 6% Asian 1%
- Hispanic origin (detail)
- Mexican 5%
- Common ancestry
- Lithuanian 2% Italian 1% Iranian 1%
- Foreign-born
- 2% · Canada, China
- Languages at home
- 96% English-only · Spanish 2%
Political lean MEDSL · Allen
- 2024 margin
- Solid R (+44.1) · D 27.5% · R 71.6%
- 2008→2024 swing
- -23.4pp toward R · 2008: -20.7pp · 2024: -44.1pp
- All cycles
- 2024: R+44.1 2020: R+39.5 2016: R+38.2 2012: R+25.7 2008: R+20.7
Not yet ingested
- Civics
- —
Market trends
- HPI YoY
- ▼ -164.79%
- Current HPI
- 219.5329
- Rent YoY
- —
- Metro
- Lima, OH
- State GDP YoY
- ▲ 1.98%
- F500 in state
- 48
Industry mix (Fortune 500 HQ in OH)
| Industry | F500 HQs | Revenue |
|---|---|---|
| Insurance | 3 | $145B |
|
||
| Industrial Machinery | 3 | $49B |
|
||
| Financial Services | 3 | $24B |
|
||
| Consumer Goods | 2 | $93B |
|
||
| Aerospace / Defense | 2 | $47B |
|
||
| Utilities | 2 | $33B |
|
||
Price history
-30.4% since first listed11 events — show timeline
- 2026-06-02 Listed $200,000 WCARE
- 2024-03-05 Relisted — WCARE
- 2024-03-05 Price Changed $160,000 WCARE
- 2023-11-28 Relisted — WCARE
- 2023-10-02 Relisted — WCARE
- 2023-10-02 Price Changed $124,000 WCARE
- 2023-07-18 Price Changed $140,000 WCARE
- 2023-05-02 Price Changed $160,000 WCARE
- 2023-02-18 Listed $180,000 WCARE
- 2018-08-03 Sold (Public Records) $168,000 Public Records
- 1994-12-29 Sold (Public Records) $287,500 Public Records
Property tax history
-6.9%/yrLatest (2025): $823 · -10.9% YoY. Source: county tax records.
Cash-flow waterfall
monthlySold comps — $/sqft
last 12 mo · ≤1 miLoading sold comps…