 7-Plex
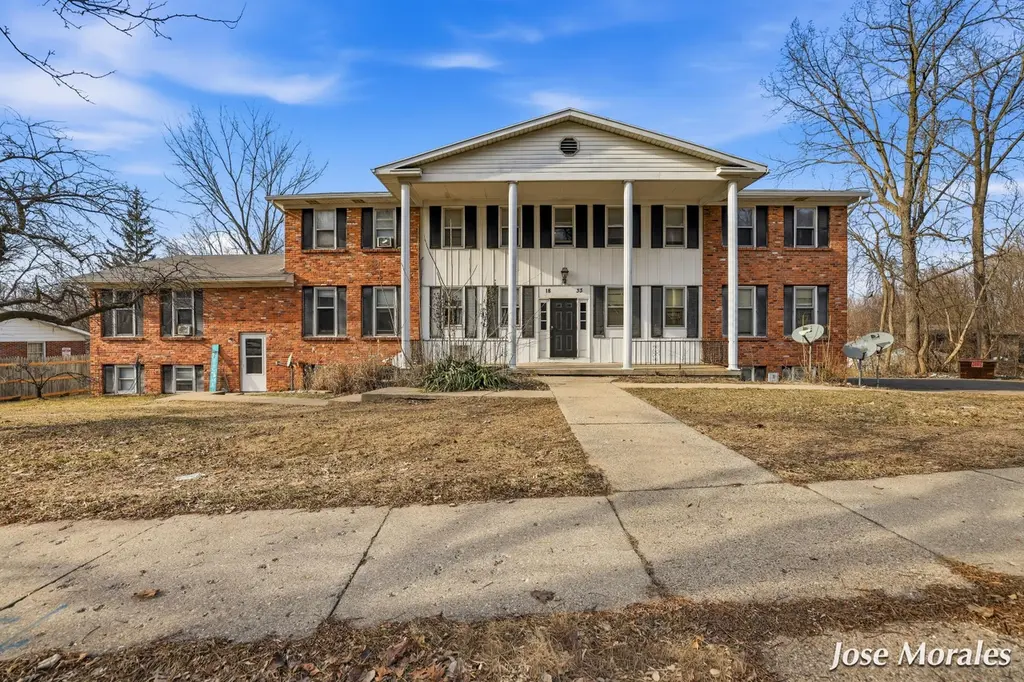
1833 Prairie Pkwy SW · Wyoming, MI
Flood risk 6/10 · Moderate
- FEMA flood zone
- X (unshaded)
- Chance of flooding over 30 yrs
- 0.74%
- Est. flood insurance / yr
- $507 – $1,088
Fire risk 1/10 · Minimal
- Est. fire insurance / yr
- $784 – $1,456
Heat risk 2/10 · Minimal
- Hot days now (above 97°F)
- 7 days/yr
- Hot days in 30 yrs
- 15 days/yr
Wind risk 2/10 · Minimal
- Chance of severe wind over 30 yrs
- —
Air-quality risk 2/10 · Minimal
- Unhealthy air days now
- 2 days/yr
- Unhealthy air days in 30 yrs
- 2 days/yr
Risk factors via First Street. Map © Google.
Why this score? — see what drove the C+ grade
The composite is a weighted blend of 9 inputs, each scored 0–100. Each bar is that input's sub-score; the figure is the points it added to the 100-point composite (weight × sub-score).
- Cash flow +24.6/30.0
- DSCR +7.9/10.0
- ARV discount +7.5/15.0
- 1% rule +6.4/10.0
- Rent growth +5.0/5.0
- Livability +3.9/5.0
- Condition / age +2.5/5.0
- Schools +2.4/10.0
- Appreciation +0.0/10.0
$849,900
🖨 Deal sheet 📄 Offer letter ✓ Due diligence
Multi-family units
County records classify this as Multi-Family (5+ Unit). Listing-text estimate: 7 units. confirmed
5+ unit building — per-unit beds/baths from public records are typically unavailable; the breakdown below (if shown) is an estimate from the listing text.
Listing remarks MLS
Welcome to your next investment. This 7 Unit apartment building is perfectly situated in the heart of Wyoming. There are (6)2BR units and (1)3BR unit. Coin-operated laundry. Significant value-add opportunity with rents currently below market. Two vacant units provide immediate upside potential. This is a great opportunity for a solid investment. Don't wait, properties like this do not come up often.
Key facts
- 0.52 acre lot
- 10 parking spots
- Built 1969
Neighborhood map
What this means for you Summary
Snapshot
- This is a 6×2bd/1.0ba + 1×3bd/1.0ba units multifamily listed at $850k.
Deal economics
- At list price, monthly cash flow is $2k ($21k/yr) — positive. Per door: $251/mo.
- The deal already cash-flows at list — no discount required.
- Meets the 1% rule at list price ($10k rent vs $850k).
- Recommended offer: $773k (9.0% below list) — sets the bar for market timing.
- Cap rate 8.8% vs local median 3.8% in Wyoming — top-decile yield for the area; either an underpriced asset or a hidden risk that comps aren't pricing in. Stress-test before assuming the spread holds.
Location & tenants
- Location reads 77/100 on livability (#126 in MI, #3,095 nationally) — a middle-class / working-renter tenant base. Strengths: cost of living A+, housing A+, health & safety A+; Watch: schools D+, crime D-, amenities F.
- Wyoming Public Schools (urban): math 16% / reading 39% proficiency, ranked #394 of 540 in MI (top 73%) — low school quality limits family demand, transient renter base, plan for 1-2y turnover; 64% free/reduced lunch — lower-income household profile, screen leases tightly.
- Market conditions: Rents rising fast (+10.5%/yr); 92 active listings in the ZIP; 2,253 units permitted in Kent County in 2024 (969 in 5+ unit buildings).
- At $9,658/mo this rent would consume 157% of the median local household income ($74k/yr) (locally 847% of renters already pay >50% of income on rent) — very limited rent-growth headroom before tenants either downsize or default.
Forward outlook
- Local home prices are declining (-3.0%/yr); year-one equity from $6k of loan paydown is wiped out by about $25k of value loss. Plan a longer hold.
- Kent County population projected at +22% by 2050 — long-run rental-demand tailwind backs the buy-and-hold thesis.
- At projected returns (-3.0% appreciation + 8.0% rent growth), your $238k cash investment doubles in ~8 years — after that, you're playing with house money.
Negotiation context
- It's been on market 99 days — a 9% lower offer ($773k) is reasonable based on typical stale-listing flexibility.
- 19 sale attempts since 39y ago; this cycle's ask has dropped $50k (6%) from the opening price — seller is motivated, your offer sets the floor, not the list.
- Current owner paid $700k; 21% above their basis — modest negotiation headroom, anchor on the comps not their cost.
Risks & watch-outs
- Climate carrying-cost: major flood risk — expect insurance premiums to compound above CPI over the hold.
Questions for the listing agent
- It's been on market 99 days. Have you received any prior offers? Is the seller open to a 9% concession, seller financing, or rate buy-down credit?
- Can we see the unit-by-unit rent roll, current vacancy, and any below-market leases? What's the average tenancy length?
- What capital expenditures (roof, boiler, parking lot, exteriors) have been made in the last 5 years, and what's planned in the next 2?
- Built in 1969 — when were the roof, HVAC, electrical panel, plumbing, and water heater last replaced?
- Why hasn't it sold? Are there any deal-killer items the seller is aware of (foundation, flood, title, zoning, code violations)?
- Is there a deadline driving the sale (1031 exchange, divorce, estate, relocation)? That informs how much negotiation room exists.
- Schools are D-rated, which usually means shorter tenancies and higher turnover. Who's the typical renter profile here, and what's been the actual vacancy rate?
- Crime grade is D in this area — have there been break-ins, vandalism, or insurance claims at this property in the last 3 years? What carrier currently insures it and at what premium?
- What's the average days-on-market for RENTAL listings here right now (not sales)? A rising rental-DOM trend means longer vacancies and softer asking-rent achievability than the comps imply.
- What's the recent tenant-quality profile in this submarket — average credit score on applications, eviction rate, late-payment / NSF rate, and stable-employment percentage? A property-management company in the area should have these aggregated.
- How much new apartment / multifamily construction is in the pipeline within 1–3 miles? Heavy new supply (>2% of stock underway) typically softens rents 12–24 months out; light construction supports rent growth.
Investment metrics
- 1% rule
- 1.14% ✓
- Cap rate
- 8.77%
- Cash-on-cash
- 8.86%
- DSCR
- 1.39
- GRM
- 7.3
CMA / ARV
- ARV (median comp)
- $307,945
- List price
- $849,900
- Delta
- 175.99%
- Verdict
- OVERPRICED
- Comps
- 13 within 1.0 mi
Projected returns pro-forma
-3.0% appreciation · 8.0% rent growth · sell at horizon
- IRR
- 2.6%
- Equity multiple
- 1.11×
- Total profit
- $25,329
- Equity at exit
- $126,723
- IRR
- 16.5%
- Equity multiple
- 2.68×
- Total profit
- $398,995
- Equity at exit
- $73,484
Cash invested: $237,972 (down + closing). Projections, not guarantees.
Landlord ↔ Tenant lean methodology
- Overall (STATE)
- 62 Landlord-Friendly
- State Michigan
- 62 Landlord-Friendly · EVEN
- County
- — inherits STATE
- City
- — inherits STATE
ZIP-level market 49519
- Rents YoY
- 10.5%
- Active inventory
- 92
- Price-to-rent
- 51.9×
Monthly cashflow live
- Estimated rent
- $9,658 high interval (Pro) →
- Mortgage (P&I)
- −$4,457
- Tax est. 1.5%
- −$1,062 /mo · $12,748/yr
- Insurance
- −$354
- HOA
- −$0
- Vacancy / Maint / Mgmt
- −$2,028
- Net cashflow
- $1,756
Break-even live
7-unit breakdown (identical units grouped — click to expand)
| Units | Beds | Baths | Est. rent |
|---|---|---|---|
| 6× units | 2 | 1 | $8,184 |
| #1 | 2 | 1 | $1,364 |
| #2 | 2 | 1 | $1,364 |
| #3 | 2 | 1 | $1,364 |
| #4 | 2 | 1 | $1,364 |
| #5 | 2 | 1 | $1,364 |
| #6 | 2 | 1 | $1,364 |
| 1× unit | 3 | 1 | $1,476 |
| Total (7 units) | $9,658 | ||
UW: 25.0% down · 7.5% · 30yr · 1.5% tax · 5.0% vac · 8.0% maint · 8.0% mgmt
Financing live
Cash to close
- Down payment
- $212,475
- Closing costs
- $25,497
- Reserves months
- —
- Total cash needed
- —
Loan-product check · same deal, 3 products live
Conventional
25% down · 7.5% · 30yr
- Down + closing
- —
- Monthly P&I
- —
- Monthly cashflow
- —
- DSCR
- —
- Eligible?
- —
Personal DTI + credit; lowest rate.
DSCR
20% down · 8.5% · 30yr
- Down + closing
- —
- Monthly P&I
- —
- Monthly cashflow
- —
- DSCR
- —
- Eligible?
- —
No personal income docs; deal must DSCR.
Hard money
10% down · 12.0% · 12mo
- Down + closing
- —
- Monthly P&I
- —
- Monthly cashflow
- —
- DSCR
- —
- Eligible?
- —
Short-term bridge; refi at stabilization.
Listing history 50 events
-
2026-06-18days on market $849,900 Active 99 DOM
-
2026-06-17days on market $849,900 Active 98 DOM
-
2026-06-16days on market $849,900 Active 97 DOM
-
2026-06-15days on market $849,900 Active 96 DOM
-
2026-06-14days on market $849,900 Active 94 DOM
-
2026-06-13remarks 699-char remark
-
2026-06-13pricedays on market $849,900 Active 93 DOM
-
2026-06-10days on market $900,000 Active 91 DOM
-
2026-06-09days on market $900,000 Active 90 DOM
-
2026-06-08days on market $900,000 Active 89 DOM
-
2026-06-07days on market $900,000 Active 88 DOM
-
2026-06-05days on market $900,000 Active 85 DOM
-
2026-06-03days on market $900,000 Active 84 DOM
-
2026-06-03days on market $900,000 Active 83 DOM
-
2026-06-01days on market $900,000 Active 82 DOM
-
2026-05-31days on market $900,000 Active 81 DOM
-
2026-03-11$900,000 Active 402-char remark
Show marketing remark (403 chars)
Welcome to your next investment. This 7 Unit apartment building is perfectly situated in the heart of Wyoming. There are (6)2BR units and (1)3BR unit. Coin-operated laundry. Significant value-add opportunity with rents currently below market. Two vacant units provide immediate upside potential. This is a great opportunity for a solid investment. Don't wait, properties like this do not come up often.
-
2026-03-11$900,000 Active 403-char remark
Show marketing remark (403 chars)
Welcome to your next investment. This 7 Unit apartment building is perfectly situated in the heart of Wyoming. There are (6)2BR units and (1)3BR unit. Coin-operated laundry. Significant value-add opportunity with rents currently below market. Two vacant units provide immediate upside potential. This is a great opportunity for a solid investment. Don't wait, properties like this do not come up often.
-
2025-05-12soldstatus $700,000 Closed
-
2025-05-12soldstatus $700,000 Closed
-
2025-02-12status Pending
-
2025-02-12status Pending
-
2025-01-24price $845,000
-
2025-01-23price $845,000
-
2025-01-14status Active
-
2025-01-14status Active
-
2024-12-17status Pending
-
2024-12-10status Pending
-
2024-12-10status Pending
-
2024-12-02status Active
-
2024-12-02status Active
-
2024-11-11status Pending
-
2024-11-11status Pending
-
2024-09-23status Active
-
2024-09-23status Active
-
2024-09-14status Pending
-
2024-09-14status Pending
-
2024-08-26$850,000 Active
-
2024-08-26$850,000 Active
-
2016-02-26soldstatus $270,000
-
2016-02-26soldstatus $270,000 Sold
-
2016-01-08historical
-
2016-01-08$270,000
-
2016-01-08$270,000
-
2015-01-27historical
-
2015-01-27historical
-
2015-01-27historical
-
2007-07-02$269,000
-
2007-03-07$289,900
-
2005-04-29soldstatus $280,000
ⓘ Source: listings_history table (triggers on properties + properties_extension) + one-shot
backfill from property_details.listing_events for pre-trigger history.
Climate risk First Street
- Flood 6/10 Major FEMA zone X (unshaded) · 74% chance over 30 yrs
- Wildfire 1/10 Low
- Heat 2/10 Low 7 d/yr ≥97°F today · 15 d/yr by 30 yrs out
- Wind 2/10 Low
- Air quality 2/10 Low 2 unhealthy d/yr today · 2 by 30 yrs out
Nearby sold comps map
Loading sold comps map…
Walkable amenities ~0.75 mi
Loading nearby amenities…
Taxation est. · year 1
- Rental income
- $115,896
- − Mortgage interest
- −$47,608
- − Property taxes
- −$12,748
- − Insurance
- −$4,250
- − Repairs & maintenance
- −$9,272
- − Management
- −$9,272
- − Depreciation
- −$24,724
- Taxable income
- $8,023
- Est. tax owed @ 24.0%
- −$1,925
- After-tax cash flow
- $19,151/yr
For passive investors: Depreciation is non-cash, so a rental often shows a tax loss while cash-flowing — sheltering income. Rental losses are passive: they offset passive income freely, and up to $25,000/yr can offset ordinary (W-2) income if you actively participate and your MAGI is under $100k (phasing out to $0 by $150k); unused losses carry forward. On sale, claimed depreciation is recaptured at up to 25%, and gains may owe capital-gains tax (a 1031 exchange can defer both). Figures are a year-1 estimate at your 24.0% rate — not tax advice; consult a CPA.
Schools (NCES district)
- District
- Wyoming Public Schools
- NCES district ID
- 2636570
- Math proficiency
- 16% ▼ -8.00%
- Reading proficiency
- 39% ▲ 4.00%
- Median HH income
- $46,299
- Composite
- 23.69/100
- National rank
- #7835
- State rank
- #394 of 540 in MI
Livability — Wyoming
- Score
- 77/100
- State rank
- #126
- US rank
- #3095
Category grades
Schools grade is shown separately in the Schools card above.
Census & demographics
- Census place
- Wyoming, MI
- County
- Kent County · 533,805 people
- City population
- 56,117
- Metro
- Grand Rapids-Kentwood, MI
- Population (ZIP)
- 27,965
- Household income
- $73,762
- Rent vs Own
- Severe rent burden
- 847.0
Population outlook (Kent County) Hauer SSP2
- Today (2025)
- 712,484 people
- By 2030
- 748,618 · +5.1%
- By 2040
- 814,777 · +14.4%
- By 2050
- 868,556 · +21.9%
- By 2075
- 966,487 · +35.7%
- By 2100
- 967,975 · +35.9%
Race, ethnicity, and origin ACS 2023
- Neighborhood character
- Predominantly White (66%)
- Race & ethnicity
- White 66% Hispanic / Latino 18% Two or more races 14% Black 9% Asian 2%
- Hispanic origin (detail)
- Mexican 13% Puerto Rican 2%
- Common ancestry
- Iranian 18% Romanian 5% Slovak 2%
- Foreign-born
- 8% · Canada
- Languages at home
- 85% English-only · Spanish 12% Other Indo-European 1%
Political lean MEDSL · Kent
- 2024 margin
- Lean D (+5.4) · D 51.8% · R 46.5% · Other 1.7%
- 2008→2024 swing
- +4.8pp toward D · 2008: 0.5pp · 2024: 5.4pp
- All cycles
- 2024: D+5.4 2020: D+6.1 2016: R+3.1 2012: R+7.9 2008: D+0.5
Not yet ingested
- Civics
- —
Market trends
- HPI YoY
- ▼ -244.17%
- Current HPI
- 274.6556
- Rent YoY
- ▲ 10.46%
- Metro
- Grand Rapids-Kentwood, MI
- State GDP YoY
- ▲ 1.37%
- F500 in state
- 28
Industry mix (Fortune 500 HQ in MI)
| Industry | F500 HQs | Revenue |
|---|---|---|
| Automotive Parts | 3 | $48B |
|
||
| Automotive | 2 | $372B |
|
||
| Chemicals | 1 | $45B |
|
||
| Automotive Retail | 1 | $29B |
|
||
| Healthcare / Medical Devices | 1 | $23B |
|
||
| Automotive Technology | 1 | $20B |
|
||
Price history
+3514.5% since first listed41 events — show timeline
- 2026-03-11 Listed $900,000 REALCOMP
- 2026-03-11 Listed $900,000 MiRealSource-MiMLS
- 2025-05-12 Sold (MLS) $700,000 MiRealSource-MiMLS
- 2025-05-12 Sold (MLS) $700,000 REALCOMP
- 2025-02-12 Pending — REALCOMP
- 2025-02-12 Pending — MiRealSource-MiMLS
- 2025-01-24 Price Changed $845,000 MiRealSource-MiMLS
- 2025-01-23 Price Changed $845,000 REALCOMP
- 2025-01-14 Relisted — REALCOMP
- 2025-01-14 Relisted — MiRealSource-MiMLS
- 2024-12-17 Pending — REALCOMP
- 2024-12-10 Pending — REALCOMP
- 2024-12-10 Pending — MiRealSource-MiMLS
- 2024-12-02 Relisted — REALCOMP
- 2024-12-02 Relisted — MiRealSource-MiMLS
- 2024-11-11 Pending — REALCOMP
- 2024-11-11 Pending — MiRealSource-MiMLS
- 2024-09-23 Relisted — REALCOMP
- 2024-09-23 Relisted — MiRealSource-MiMLS
- 2024-09-14 Pending — REALCOMP
- 2024-09-14 Pending — MiRealSource-MiMLS
- 2024-08-26 Listed $850,000 MiRealSource-MiMLS
- 2024-08-26 Listed $850,000 REALCOMP
- 2016-02-26 Sold (MLS) $270,000 SW Michigan MLS
- 2016-02-26 Sold (MLS) $270,000 REALCOMP
- 2016-01-08 Listing Removed — SW Michigan MLS
- 2016-01-08 Listed $270,000 SW Michigan MLS
- 2016-01-08 Listed $270,000 REALCOMP
- 2015-01-27 Listing Removed — SW Michigan MLS
- 2015-01-27 Listing Removed — SW Michigan MLS
- 2015-01-27 Listing Removed — SW Michigan MLS
- 2007-07-02 Listed $269,000 SW Michigan MLS
- 2007-03-07 Listed $289,900 SW Michigan MLS
- 2005-04-29 Sold (MLS) $280,000 SW Michigan MLS
- 2004-11-09 Listed $299,900 SW Michigan MLS
- 2004-02-27 Sold (MLS) $285,000 SW Michigan MLS
- 2003-07-15 Listed $285,000 SW Michigan MLS
- 2000-06-30 Sold (MLS) $263,000 SW Michigan MLS
- 2000-03-03 Listed $249,900 SW Michigan MLS
- 1988-06-13 Listed $239,000 SW Michigan MLS
- 1987-12-01 Listed $24,900 SW Michigan MLS
Cash-flow waterfall
monthlySold comps — $/sqft
last 12 mo · ≤1 miLoading sold comps…