11351 SE 32nd Pl · Williston Highlands, FL
Flood risk 1/10 · Minimal
- FEMA flood zone
- X (unshaded)
- Chance of flooding over 30 yrs
- 0.0%
- Est. flood insurance / yr
- $507 – $1,088
Fire risk 4/10 · Minor
- Est. fire insurance / yr
- $947 – $1,759
Heat risk 9/10 · Severe
- Hot days now (above 107°F)
- 7 days/yr
- Hot days in 30 yrs
- 24 days/yr
Wind risk 9/10 · Severe
- Chance of severe wind over 30 yrs
- 99.0%
Air-quality risk 2/10 · Minimal
- Unhealthy air days now
- 1 days/yr
- Unhealthy air days in 30 yrs
- 1 days/yr
Risk factors via First Street. Map © Google.
Why this score? — see what drove the C grade
The composite is a weighted blend of 9 inputs, each scored 0–100. Each bar is that input's sub-score; the figure is the points it added to the 100-point composite (weight × sub-score).
- Cash flow +18.2/30.0
- Appreciation +10.0/10.0
- ARV discount +7.5/15.0
- DSCR +5.7/10.0
- 1% rule +4.7/10.0
- Schools +3.6/10.0
- Livability +2.9/5.0
- Rent growth +2.5/5.0
- Condition / age +2.5/5.0
$180,000
🖨 Deal sheet (PDF) 📄 Offer letter ✓ Due diligence
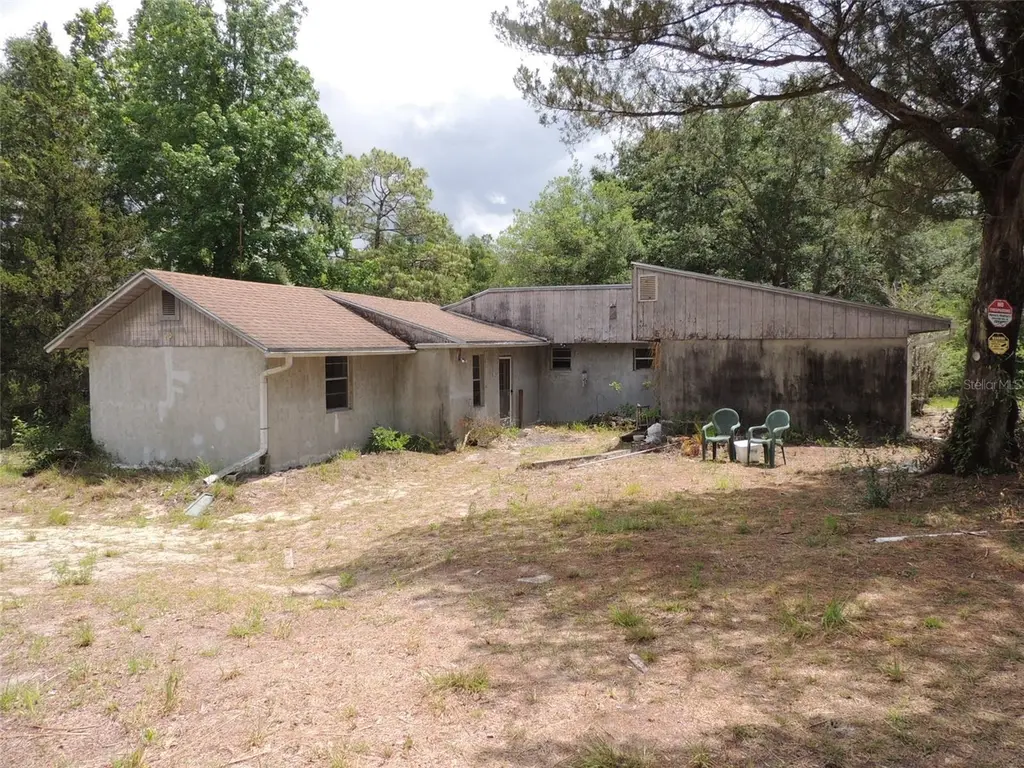
Listing remarks
Under contract-accepting backup offers. CONCRETE BLOCK FIXER UPPER ON ALMOST 5 ACRES! Opportunity awaits with this unique concrete block home situated on nearly 5 beautiful acres along a paved road. Featuring 2 bedrooms, 1 bathroom, and a huge kitchen with plenty of space for gatherings or future customization, this property is packed with potential for the right buyer. The home offers a very distinctive U-shaped layout, adding character and flexibility to the floor plan. The bathroom includes both a whirlpool tub and separate stall shower for added comfort. Outside, you’ll find a 20’ x 40’ pole barn, a small concrete block storage shed, and plenty of room for animals, equ
Key facts
- Pole barn
- U shaped layout
- Storage shed
Tags
Property features AI
Finance
- Other: Zoning: A/RR; Public maintained paved/asphalt road access; Living area reported as 1,605 (source: public records); Total building area reported as 1,605 (source: public records)
- Financial info: No lease restrictions
- HOA & community: No HOA
Exterior
- Parking: Off-street parking
- Utilities: Well water; Septic tank; Electricity connected
- Home design: Single-family residence; One story; Faces west; Homesteaded; Property condition: Fixer
- Construction: Block and stucco construction; Shingle roof; Slab foundation; Built on approximately 4.91 acres
- Exterior features: Storage shed(s)
Interior
- Kitchen: No appliances included
- Bedrooms: 2 bedrooms
- Flooring: Carpet; Tile
- Bathrooms: 1 full bathroom
- Heating & cooling: No heating; No cooling
- Interior features: Ceiling fans; Decorative fireplace
- Laundry & utility: Inside laundry with washer and electric dryer hookups; Laundry closet
Neighborhood map
What this means for you Summary
Snapshot
- This is a 2-bed/1.0-bath single-family listed at $180k.
Deal economics
- At list price, monthly cash flow is $163 ($2k/yr) — positive.
- The deal already cash-flows at list — no discount required.
- To meet the 1% rule (rent ≥ 1% of price), the offer needs to be $174k (3.1% below list).
- Recommended offer: $174k (3.1% below list) — sets the bar for 1% rule.
- Cap rate 7.4% vs local median 5.9% in Williston Highlands — meaningfully above typical; check what's discounted (condition, days-on-market, listing class) to confirm the premium yield is real.
Location & tenants
- Location reads 57/100 on livability (#851 in FL) — a working-class tenant base; expect higher turnover. Strengths: crime A+, cost of living A+, housing A+; Watch: employment C-, schools F, amenities F.
- Levy (rural): math 45% / reading 43% proficiency, ranked #54 of 73 in FL (top 74%) — families likely to look elsewhere, expect single-tenant / working-renter base with shorter leases; 62% free/reduced lunch — lower-income household profile, screen leases tightly.
- Market conditions: 146 active listings in the ZIP; 199 units permitted in Levy County in 2024 (0 in 5+ unit buildings).
Forward outlook
- In year one you build about $19k of equity ($1k loan paydown + $18k appreciation (10.0% local appreciation)).
- Levy County population projected at -28% by 2050 — secular population decline; favor cash flow + early exit over multi-decade hold.
- At projected returns (10.0% appreciation + 3.0% rent growth), your $50k cash investment doubles in ~3 years — after that, you're playing with house money.
- By year 2, paydown + projected appreciation supports a ~$31k cash-out refi (75% LTV) — recoverable capital for the next deal without selling this one.
Negotiation context
- It's been on market 27 days — a 2% lower offer ($177k) is reasonable based on typical stale-listing flexibility.
Risks & watch-outs
- Climate carrying-cost: severe wind risk, 99% chance of damaging wind over 30y; extreme-heat days projected 7→24/yr by 2055 (HVAC capex compounding) — expect insurance premiums to compound above CPI over the hold.
Questions for the listing agent
- Built in 1969 — when were the roof, HVAC, electrical panel, plumbing, and water heater last replaced?
- Is there a deadline driving the sale (1031 exchange, divorce, estate, relocation)? That informs how much negotiation room exists.
- Schools are F-rated, which usually means shorter tenancies and higher turnover. Who's the typical renter profile here, and what's been the actual vacancy rate?
- What's the average days-on-market for RENTAL listings here right now (not sales)? A rising rental-DOM trend means longer vacancies and softer asking-rent achievability than the comps imply.
- What's the recent tenant-quality profile in this submarket — average credit score on applications, eviction rate, late-payment / NSF rate, and stable-employment percentage? A property-management company in the area should have these aggregated.
- How much new for-sale + rental construction is in the pipeline within 1–3 miles? Heavy new supply typically softens prices + rents 12–24 months out; constrained supply supports both.
Investment metrics
- 1% rule
- 0.97% ✗
- Cap rate
- 7.38%
- Cash-on-cash
- 3.88%
- DSCR
- 1.17
- GRM
- 8.6
CMA / ARV
- ARV (on-the-fly)
- $536,070
- Comps found
- 2
Show comp detail 2 sales within ~0.75 mi
| Address | Dist | Beds/Ba | Sqft | Sold | Price | $/sf | Match |
|---|---|---|---|---|---|---|---|
| 11151 SE 30th St | 0.33mi | 3/2.0 (+1) | 1,736 (+8%) | 4mo | $580,000 | $334 | 58 |
| 2550 SE 114th Ave | 0.70mi | 3/2.0 (+1) | 1,674 (+4%) | 15mo | $200,000 | $119 | 39 |
Match score weights: distance 35% · size 25% · config 20% · recency 20%. Top-matched comps best support the ARV.
Projected returns pro-forma
10.0% appreciation · 3.0% rent growth · sell at horizon
- IRR
- 27.1%
- Equity multiple
- 3.15×
- Total profit
- $108,412
- Equity at exit
- $162,158
- IRR
- 23.7%
- Equity multiple
- 7.17×
- Total profit
- $311,116
- Equity at exit
- $349,700
Cash invested: $50,400 (down + closing). Projections, not guarantees.
Landlord ↔ Tenant lean methodology
- Overall (STATE)
- 87 Strongly Landlord-Friendly
- State Florida
- 87 Strongly Landlord-Friendly · R+3
- County
- — inherits STATE
- City
- — inherits STATE
ZIP-level market 32668
- Home prices YoY
- 11.5%
- Active inventory
- 146
- Price-to-rent
- 8.6×
Monthly cashflow live
- Estimated rent
- $1,744 medium interval (Pro) →
- Mortgage (P&I)
- −$944
- Tax from tax record
- −$196 /mo · $2,348/yr
- Insurance
- −$75
- HOA
- −$0
- Vacancy / Maint / Mgmt
- −$366
- Net cashflow
- $163
Break-even live
Sensitivity live
| Price | -10% $265 | -5% $214 | +0% $163 | +5% $112 | +10% $61 |
|---|---|---|---|---|---|
| Rent | -10% $25 | -5% $94 | +0% $163 | +5% $232 | +10% $301 |
| Rate | -1.0pp $253 | -0.5pp $209 | base $163 | +0.5pp $116 | +1.0pp $69 |
UW: 25.0% down · 7.5% · 30yr · 1.5% tax · 5.0% vac · 8.0% maint · 8.0% mgmt
Financing live
Cash to close
- Down payment
- $45,000
- Closing costs
- $5,400
- Reserves months
- —
- Total cash needed
- —
Loan-product check · same deal, 3 products live
Conventional
25% down · 7.5% · 30yr
- Down + closing
- —
- Monthly P&I
- —
- Monthly cashflow
- —
- DSCR
- —
- Eligible?
- —
Personal DTI + credit; lowest rate.
DSCR
20% down · 8.5% · 30yr
- Down + closing
- —
- Monthly P&I
- —
- Monthly cashflow
- —
- DSCR
- —
- Eligible?
- —
No personal income docs; deal must DSCR.
Hard money
10% down · 12.0% · 12mo
- Down + closing
- —
- Monthly P&I
- —
- Monthly cashflow
- —
- DSCR
- —
- Eligible?
- —
Short-term bridge; refi at stabilization.
Listing history 16 events
-
2026-06-16status $180,000 Pending 27 DOM
-
2026-06-16days on market $180,000 Active 27 DOM
-
2026-06-15days on market $180,000 Active 26 DOM
-
2026-06-14days on market $180,000 Active 24 DOM
-
2026-06-13days on market $180,000 Active 23 DOM
-
2026-06-10days on market $180,000 Active 21 DOM
-
2026-06-09days on market $180,000 Active 20 DOM
-
2026-06-08days on market $180,000 Active 19 DOM
-
2026-06-07days on market $180,000 Active 18 DOM
-
2026-06-05days on market $180,000 Active 15 DOM
-
2026-06-03days on market $180,000 Active 14 DOM
-
2026-06-02days on market $180,000 Active 13 DOM
-
2026-06-01days on market $180,000 Active 12 DOM
-
2026-05-31days on market $180,000 Active 11 DOM
-
2026-05-30days on market $180,000 Active 10 DOM
-
2026-05-20$180,000 Active
ⓘ Source: listings_history table (triggers on properties + properties_extension) + one-shot
backfill from property_details.listing_events for pre-trigger history.
Tax reassessment forecast FL · Resets to sale price
- Current annual tax
- $2,348 · $196/mo
- Projected year-2 tax
- $2,348 · $196/mo
- Expected delta
- $0/yr ($0/mo · 0.0%)
ⓘ Screening estimate from a state-policy table — verify with the county assessor before closing.
Climate risk First Street
- Flood 1/10 Low FEMA zone X (unshaded) · 0% chance over 30 yrs
- Wildfire 4/10 Moderate
- Heat 9/10 Extreme 7 d/yr ≥107°F today · 24 d/yr by 30 yrs out
- Wind 9/10 Extreme 99% chance of damaging wind over 30 yrs
- Air quality 2/10 Low 1 unhealthy d/yr today · 1 by 30 yrs out
Nearby sold comps map
Loading sold comps map…
Walkable amenities ~0.75 mi
Loading nearby amenities…
Taxation est. · year 1
- Rental income
- $20,923
- − Mortgage interest
- −$10,083
- − Property taxes
- −$2,348
- − Insurance
- −$900
- − Repairs & maintenance
- −$1,674
- − Management
- −$1,674
- − Depreciation
- −$5,236
- Taxable loss
- −$992
- Est. tax savings @ 24.0%
- +$238
- After-tax cash flow
- $2,192/yr
For passive investors: Depreciation is non-cash, so a rental often shows a tax loss while cash-flowing — sheltering income. Rental losses are passive: they offset passive income freely, and up to $25,000/yr can offset ordinary (W-2) income if you actively participate and your MAGI is under $100k (phasing out to $0 by $150k); unused losses carry forward. On sale, claimed depreciation is recaptured at up to 25%, and gains may owe capital-gains tax (a 1031 exchange can defer both). Figures are a year-1 estimate at your 24.0% rate — not tax advice; consult a CPA.
Schools (NCES district)
- District
- Levy
- NCES district ID
- 1201140
- Math proficiency
- 45% ▼ -8.00%
- Reading proficiency
- 43% ▼ -3.00%
- Median HH income
- $35,254
- Composite
- 36.42/100
- National rank
- #4673
- State rank
- #54 of 73 in FL
Livability — Williston Highlands
- Score
- 57/100
- State rank
- #851
- US rank
- #21745
Category grades
Schools grade is shown separately in the Schools card above.
Census & demographics
- Population (ZIP)
- 5,326
Population outlook (Levy County) Hauer SSP2
- Today (2025)
- 36,536 people
- By 2030
- 34,498 · -5.6%
- By 2040
- 30,294 · -17.1%
- By 2050
- 26,368 · -27.8%
- By 2075
- 19,003 · -48.0%
- By 2100
- 13,169 · -64.0%
Race, ethnicity, and origin ACS 2023
- Neighborhood character
- Predominantly White (88%)
- Race & ethnicity
- White 88% Hispanic / Latino 8% Two or more races 5% Black 1%
- Hispanic origin (detail)
- Mexican 4%
- Common ancestry
- Scotch-Irish 4% Slovak 2% Iranian 1%
- Foreign-born
- 6% · Canada
- Languages at home
- 93% English-only · Spanish 7%
Political lean MEDSL · Levy
- 2024 margin
- Solid R (+50.3) · D 24.6% · R 74.8%
- 2008→2024 swing
- -23.3pp toward R · 2008: -26.9pp · 2024: -50.3pp
- All cycles
- 2024: R+50.3 2020: R+45.6 2016: R+44.8 2012: R+32.2 2008: R+26.9
Not yet ingested
- Civics
- —
Market trends
- HPI YoY
- ▲ 44.56%
- Current HPI
- 432.1581
- Rent YoY
- —
- Metro
- —
- State GDP YoY
- ▲ 3.28%
- F500 in state
- 36
Industry mix (Fortune 500 HQ in FL)
| Industry | F500 HQs | Revenue |
|---|---|---|
| Industrial Technology | 2 | $29B |
|
||
| Insurance | 2 | $17B |
|
||
| Retail | 1 | $60B |
|
||
| Technology Distribution | 1 | $58B |
|
||
| Homebuilding | 1 | $35B |
|
||
| Technology Manufacturing | 1 | $35B |
|
||
Price history
1 event — show timeline
- 2026-05-20 Listed $180,000 Stellar MLS as Distributed by MLS Grid
Property tax history
+16.2%/yrLatest (2025): $2,348 · +1.1% YoY. Source: county tax records.
Cash-flow waterfall
monthlySold comps — $/sqft
last 12 mo · ≤1 miLoading sold comps…