 🏷️ Likely Rental
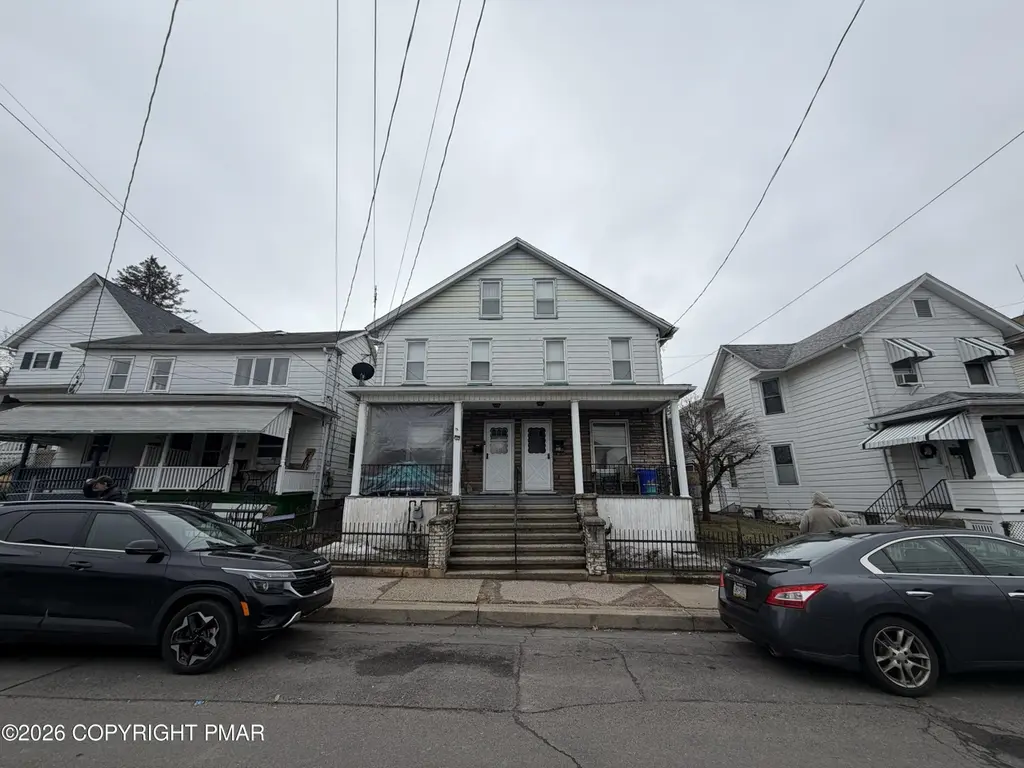
81 Carroll St · Pittston, PA
Flood risk 1/10 · Minimal
- FEMA flood zone
- X (unshaded)
- Chance of flooding over 30 yrs
- 0.0%
- Est. flood insurance / yr
- $507 – $1,088
Fire risk 1/10 · Minimal
- Est. fire insurance / yr
- $511 – $949
Heat risk 4/10 · Minor
- Hot days now (above 96°F)
- 7 days/yr
- Hot days in 30 yrs
- 16 days/yr
Wind risk 3/10 · Minor
- Chance of severe wind over 30 yrs
- 5.0%
Air-quality risk 2/10 · Minimal
- Unhealthy air days now
- 1 days/yr
- Unhealthy air days in 30 yrs
- 2 days/yr
Risk factors via First Street. Map © Google.
Why this score? — see what drove the B+ grade
The composite is a weighted blend of 9 inputs, each scored 0–100. Each bar is that input's sub-score; the figure is the points it added to the 100-point composite (weight × sub-score).
- Cash flow +30.0/30.0
- ARV discount +15.0/15.0
- 1% rule +10.0/10.0
- DSCR +10.0/10.0
- Livability +3.7/5.0
- Schools +3.0/10.0
- Rent growth +2.5/5.0
- Condition / age +2.5/5.0
- Appreciation +0.0/10.0
$169,000
🖨 Deal sheet 📄 Offer letter ✓ Due diligence
Multi-family units
County records classify this as Multi-Family (2-4 Unit). Listing-text estimate: 1 unit. estimate disagrees with records
Listing remarks MLS
Do Not Miss This Value Add Duplex Opportunity In Pittston Offering Strong Upside And Flexible Layout! This large side by side property delivers serious potential with one unit configured as a spacious 3 bedroom and the other expanded into a 5 bedroom layout including finished attic space, creating multiple paths for increased rental income. The home offers solid bones and a classic layout with separate entrances and a covered front porch. While the property does need work, it presents the ideal opportunity for an investor or owner occupant to renovate, stabilize, and significantly increase value and cash flow. An additional lot is included behind the home, offering extra space and flexibility. Located on a residential street in Pittston, you are just minutes from downtown shops, restaurants, and major routes including Route 11 and I 81, making commuting and tenant demand strong. The area continues to see steady growth with easy access to Scranton, Wilkes Barre, and surrounding employment hubs. Whether you are looking to fix and flip, build long term rental income, or house hack, this is a high potential asset in a proven rental market. Do Not Wait To Capitalize On This Opportunity Schedule Your Showing Today!
Key facts
- Flexible layout
- Finished attic space
- Duplex opportunity
Tags
Neighborhood map
What this means for you Summary
Snapshot
- This is a 8-bed/3.0-bath multifamily listed at $169k.
Deal economics
- At list price, monthly cash flow is $1k ($15k/yr) — positive.
- The deal already cash-flows at list — no discount required.
- Meets the 1% rule at list price ($3k rent vs $169k).
- Recommended offer: $164k (3.0% below list) — sets the bar for market timing.
- Cap rate 15.3% vs local median 6.9% in Pittston — top-decile yield for the area; either an underpriced asset or a hidden risk that comps aren't pricing in. Stress-test before assuming the spread holds.
Location & tenants
- Location reads 74/100 on livability (#493 in PA, #4,549 nationally) — a middle-class / working-renter tenant base. Strengths: crime A+, cost of living A+, health & safety A+; Watch: amenities F, commute F, employment F.
- Pittston Area SD (suburban): math 30% / reading 40% proficiency, ranked #418 of 539 in PA (top 78%) — families likely to look elsewhere, expect single-tenant / working-renter base with shorter leases.
- Market conditions: 103 active listings in the ZIP; 349 units permitted in Luzerne County in 2024 (16 in 5+ unit buildings).
Forward outlook
- Local home prices are declining (-3.0%/yr); year-one equity from $1k of loan paydown is wiped out by about $5k of value loss. Plan a longer hold.
- Luzerne County population projected at +4% by 2050 — modest demand growth; plan on rents tracking national, not racing it.
- At projected returns (-3.0% appreciation + 3.0% rent growth), your $47k cash investment doubles in ~4 years — after that, you're playing with house money.
Negotiation context
- It's been on market 47 days — a 3% lower offer ($164k) is reasonable based on typical stale-listing flexibility.
- 2 sale attempts with the ask held roughly flat each time — persistent listings suggest the price (not the market) is what's stuck; bring a comps-based counter.
Risks & watch-outs
- Watch-outs: built in 1900 — expect roof / HVAC / electrical / plumbing capex.
Questions for the listing agent
- It's been on market 47 days. Have you received any prior offers? Is the seller open to a 3% concession, seller financing, or rate buy-down credit?
- Built in 1900 — when were the roof, HVAC, electrical panel, plumbing, and water heater last replaced?
- Is there a deadline driving the sale (1031 exchange, divorce, estate, relocation)? That informs how much negotiation room exists.
- What's the average days-on-market for RENTAL listings here right now (not sales)? A rising rental-DOM trend means longer vacancies and softer asking-rent achievability than the comps imply.
- What's the recent tenant-quality profile in this submarket — average credit score on applications, eviction rate, late-payment / NSF rate, and stable-employment percentage? A property-management company in the area should have these aggregated.
- How much new apartment / multifamily construction is in the pipeline within 1–3 miles? Heavy new supply (>2% of stock underway) typically softens rents 12–24 months out; light construction supports rent growth.
Investment metrics
- 1% rule
- 1.80% ✓
- Cap rate
- 15.25%
- Cash-on-cash
- 32.01%
- DSCR
- 2.42
- GRM
- 4.6
CMA / ARV
- ARV (median comp)
- $223,630
- List price
- $169,000
- Delta
- -24.43%
- Verdict
- UNDERPRICED
- Comps
- 20 within 1.0 mi
Show comp detail 1 sale within ~0.75 mi
| Address | Dist | Beds/Ba | Sqft | Sold | Price | $/sf | Match |
|---|---|---|---|---|---|---|---|
| 162 S Main St | 0.61mi | 8/5.0 | 2,400 (-4%) | 12mo | $340,000 | $142 | 47 |
Match score weights: distance 35% · size 25% · config 20% · recency 20%. Top-matched comps best support the ARV.
Projected returns pro-forma
-3.0% appreciation · 3.0% rent growth · sell at horizon
- IRR
- 27.0%
- Equity multiple
- 2.12×
- Total profit
- $53,034
- Equity at exit
- $25,198
- IRR
- 34.6%
- Equity multiple
- 4.17×
- Total profit
- $149,827
- Equity at exit
- $14,612
Cash invested: $47,320 (down + closing). Projections, not guarantees.
Landlord ↔ Tenant lean methodology
- Overall (STATE)
- 62 Landlord-Friendly
- State Pennsylvania
- 62 Landlord-Friendly · EVEN
- County
- — inherits STATE
- City
- — inherits STATE
ZIP-level market 18640
- Home prices YoY
- -34.9%
- Active inventory
- 103
- Price-to-rent
- 10.8×
Monthly cashflow live
- Estimated rent
- $3,050 high interval (Pro) →
- Mortgage (P&I)
- −$886
- Tax from tax record
- −$191 /mo · $2,288/yr
- Insurance
- −$70
- HOA
- −$0
- Vacancy / Maint / Mgmt
- −$640
- Net cashflow
- $1,262
Break-even live
2-unit breakdown (identical units grouped — click to expand)
| Units | Beds | Baths | Est. rent |
|---|---|---|---|
| 1× unit | 3 | 1 | $1,300 |
| 1× unit | 5 | 1 | $1,750 |
| Total (2 units) | $3,050 | ||
UW: 25.0% down · 7.5% · 30yr · 1.5% tax · 5.0% vac · 8.0% maint · 8.0% mgmt
Financing live
Cash to close
- Down payment
- $42,250
- Closing costs
- $5,070
- Reserves months
- —
- Total cash needed
- —
Loan-product check · same deal, 3 products live
Conventional
25% down · 7.5% · 30yr
- Down + closing
- —
- Monthly P&I
- —
- Monthly cashflow
- —
- DSCR
- —
- Eligible?
- —
Personal DTI + credit; lowest rate.
DSCR
20% down · 8.5% · 30yr
- Down + closing
- —
- Monthly P&I
- —
- Monthly cashflow
- —
- DSCR
- —
- Eligible?
- —
No personal income docs; deal must DSCR.
Hard money
10% down · 12.0% · 12mo
- Down + closing
- —
- Monthly P&I
- —
- Monthly cashflow
- —
- DSCR
- —
- Eligible?
- —
Short-term bridge; refi at stabilization.
Listing history 5 events
-
2026-06-09$169,000 Pending 47 DOM
-
2026-05-13status Pending 1228-char remark
Show marketing remark (342 chars)
Do Not Miss This Value Add Duplex Opportunity In Pittston Offering Strong Upside And Flexible Layout! This large side by side property delivers serious potential with one unit configured as a spacious 3 bedroom and the other expanded into a 5 bedroom layout including finished attic space, creating multiple paths for increased rental income.
-
2026-05-13status Pending 342-char remark
Show marketing remark (342 chars)
Do Not Miss This Value Add Duplex Opportunity In Pittston Offering Strong Upside And Flexible Layout! This large side by side property delivers serious potential with one unit configured as a spacious 3 bedroom and the other expanded into a 5 bedroom layout including finished attic space, creating multiple paths for increased rental income.
-
2026-03-27$169,000 Active 1228-char remark
Show marketing remark (342 chars)
Do Not Miss This Value Add Duplex Opportunity In Pittston Offering Strong Upside And Flexible Layout! This large side by side property delivers serious potential with one unit configured as a spacious 3 bedroom and the other expanded into a 5 bedroom layout including finished attic space, creating multiple paths for increased rental income.
-
2026-03-27$169,000 Active 342-char remark
Show marketing remark (342 chars)
Do Not Miss This Value Add Duplex Opportunity In Pittston Offering Strong Upside And Flexible Layout! This large side by side property delivers serious potential with one unit configured as a spacious 3 bedroom and the other expanded into a 5 bedroom layout including finished attic space, creating multiple paths for increased rental income.
ⓘ Source: listings_history table (triggers on properties + properties_extension) + one-shot
backfill from property_details.listing_events for pre-trigger history.
Tax reassessment forecast PA · Partial reset (capped growth)
- Current annual tax
- $2,288 · $191/mo
- Projected year-2 tax
- $2,479 · $207/mo
- Expected delta
- +$191/yr (+$16/mo · 8.3%)
ⓘ Screening estimate from a state-policy table — verify with the county assessor before closing.
Climate risk First Street
- Flood 1/10 Low FEMA zone X (unshaded) · 0% chance over 30 yrs
- Wildfire 1/10 Low
- Heat 4/10 Moderate 7 d/yr ≥96°F today · 16 d/yr by 30 yrs out
- Wind 3/10 Moderate 5% chance of damaging wind over 30 yrs
- Air quality 2/10 Low 1 unhealthy d/yr today · 2 by 30 yrs out
Nearby sold comps map
Loading sold comps map…
Walkable amenities ~0.75 mi
Loading nearby amenities…
Taxation est. · year 1
- Rental income
- $36,600
- − Mortgage interest
- −$9,467
- − Property taxes
- −$2,288
- − Insurance
- −$845
- − Repairs & maintenance
- −$2,928
- − Management
- −$2,928
- − Depreciation
- −$4,916
- Taxable income
- $13,228
- Est. tax owed @ 24.0%
- −$3,175
- After-tax cash flow
- $11,971/yr
For passive investors: Depreciation is non-cash, so a rental often shows a tax loss while cash-flowing — sheltering income. Rental losses are passive: they offset passive income freely, and up to $25,000/yr can offset ordinary (W-2) income if you actively participate and your MAGI is under $100k (phasing out to $0 by $150k); unused losses carry forward. On sale, claimed depreciation is recaptured at up to 25%, and gains may owe capital-gains tax (a 1031 exchange can defer both). Figures are a year-1 estimate at your 24.0% rate — not tax advice; consult a CPA.
Schools (NCES district)
- District
- Pittston Area SD
- NCES district ID
- 4219200
- Math proficiency
- 30% ▼ -12.00%
- Reading proficiency
- 40% ▼ -19.00%
- Median HH income
- $45,316
- Composite
- 29.86/100
- National rank
- #6409
- State rank
- #418 of 539 in PA
Livability — Pittston
- Score
- 74/100
- State rank
- #493
- US rank
- #4549
Category grades
Schools grade is shown separately in the Schools card above.
Census & demographics
- Census place
- Pittston, PA
- Population (ZIP)
- 16,418
Population outlook (Luzerne County) Hauer SSP2
- Today (2025)
- 319,505 people
- By 2030
- 319,943 · +0.1%
- By 2040
- 322,643 · +1.0%
- By 2050
- 330,817 · +3.5%
- By 2075
- 379,145 · +18.7%
- By 2100
- 431,908 · +35.2%
Race, ethnicity, and origin ACS 2023
- Neighborhood character
- Predominantly White (85%)
- Race & ethnicity
- White 85% Hispanic / Latino 6% Two or more races 5% Black 4%
- Hispanic origin (detail)
- Puerto Rican 4%
- Common ancestry
- Romanian 19% Scotch-Irish 2% Iranian 1%
- Foreign-born
- 3% · Canada, Jamaica
- Languages at home
- 93% English-only · Spanish 4% Other Indo-European 1% Chinese 1%
Political lean MEDSL · Luzerne
- 2024 margin
- R (+19.2) · D 40.0% · R 59.2%
- 2008→2024 swing
- -27.6pp toward R · 2008: 8.4pp · 2024: -19.2pp
- All cycles
- 2024: R+19.2 2020: R+14.4 2016: R+19.6 2012: D+4.8 2008: D+8.4
Not yet ingested
- Civics
- —
Market trends
- HPI YoY
- ▼ -102.89%
- Current HPI
- 191.973
- Rent YoY
- —
- Metro
- —
- State GDP YoY
- ▲ 1.68%
- F500 in state
- 34
Industry mix (Fortune 500 HQ in PA)
| Industry | F500 HQs | Revenue |
|---|---|---|
| Healthcare | 2 | $309B |
|
||
| Insurance | 2 | $27B |
|
||
| Telecommunications / Media | 1 | $124B |
|
||
| Industrial Distribution | 1 | $22B |
|
||
| Financial Services | 1 | $20B |
|
||
| Chemicals / Materials | 1 | $18B |
|
||
Price history
+0.0% since first listed4 events — show timeline
- 2026-05-13 Pending — PMAR
- 2026-05-13 Pending — LCAR
- 2026-03-27 Listed $169,000 LCAR
- 2026-03-27 Listed $169,000 PMAR
Property tax history
+1.4%/yrLatest (2026): $2,288 · +4.5% YoY. Source: county tax records.
Cash-flow waterfall
monthlySold comps — $/sqft
last 12 mo · ≤1 miLoading sold comps…