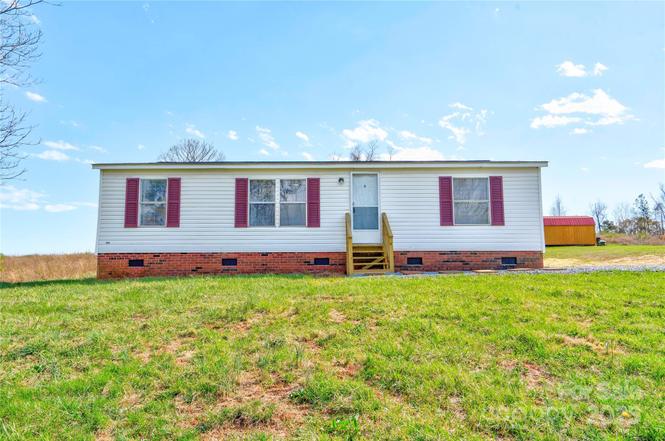
104 Buck Haven Ct · Fallston, NC
Flood risk 1/10 · Minimal
- FEMA flood zone
- X (unshaded)
- Chance of flooding over 30 yrs
- 0.0%
- Est. flood insurance / yr
- $507 – $1,088
Fire risk 4/10 · Minor
- Est. fire insurance / yr
- $906 – $1,684
Heat risk 6/10 · Moderate
- Hot days now (above 104°F)
- 7 days/yr
- Hot days in 30 yrs
- 17 days/yr
Wind risk 2/10 · Minimal
- Chance of severe wind over 30 yrs
- 3.0%
Air-quality risk 3/10 · Minor
- Unhealthy air days now
- 3 days/yr
- Unhealthy air days in 30 yrs
- 3 days/yr
Risk factors via First Street. Map © Google.
Why this score? — see what drove the C+ grade
The composite is a weighted blend of 9 inputs, each scored 0–100. Each bar is that input's sub-score; the figure is the points it added to the 100-point composite (weight × sub-score).
- Cash flow +26.5/30.0
- DSCR +9.0/10.0
- ARV discount +7.5/15.0
- 1% rule +5.8/10.0
- Schools +4.0/10.0
- Livability +3.0/5.0
- Rent growth +2.5/5.0
- Condition / age +2.5/5.0
- Appreciation +0.0/10.0
$169,000
🖨 Deal sheet (PDF) 📄 Offer letter ✓ Due diligence
Listing remarks
This 3-bedroom, 2-bath home on a 1/2-acre lot in the Fallston area features a freshly painted interior with decorator colors. It has new flooring, a renovated kitchen and bathrooms. The open floor plan includes a separate laundry room and new light fixtures throughout. This is a must see! Schedule your showing today. Buyers agents welcome!
Key facts
- Open floor plan
- Renovated bathrooms
- Renovated kitchen
Tags
Property features AI
Finance
- HOA & community: No HOA
Exterior
- Parking: Driveway (no main-level garage)
- Utilities: County water; Septic system installed
- Home design: Manufactured doublewide single-family residence; One story; Crawl space foundation
- Construction: Vinyl exterior; Manufactured construction
- Exterior features: Half-acre lot; Gravel and paved road access; Publicly maintained road
Interior
- Kitchen: No appliances included
- Bedrooms: 3 bedrooms on the main level
- Bathrooms: 2 full bathrooms (main level)
- Heating & cooling: Heat pump heating; Central air conditioning
- Interior features: 9 total rooms
- Laundry & utility: Dedicated laundry room on the main level
Neighborhood map
What this means for you Summary
Snapshot
- This is a 3-bed/2.0-bath manufactured listed at $169k.
Deal economics
- At list price, monthly cash flow is $445 ($5k/yr) — positive.
- The deal already cash-flows at list — no discount required.
- Meets the 1% rule at list price ($2k rent vs $169k).
- Recommended offer: $149k (12.0% below list) — sets the bar for market timing.
Location & tenants
- Location reads 59/100 on livability (#532 in NC) — a working-class tenant base; expect higher turnover. Strengths: cost of living A+, health & safety A; Watch: housing D+, crime F, amenities F.
- Cleveland County Schools (rural): math 47% / reading 49% proficiency, ranked #76 of 178 in NC (top 43%) — families likely to look elsewhere, expect single-tenant / working-renter base with shorter leases.
- Zoned schools: Burns High (math 42% / reading 59%, grade D+, #306 of 535 statewide, top 57%, 934 students, 60% FRL) — zoned schools at 60% FRL track the district average.
- Market conditions: 39 active listings in the ZIP; 461 units permitted in Cleveland County in 2024 (38 in 5+ unit buildings).
Forward outlook
- Local home prices are declining (-3.0%/yr); year-one equity from $1k of loan paydown is wiped out by about $5k of value loss. Plan a longer hold.
- Cleveland County population projected at -15% by 2050 — secular population decline; favor cash flow + early exit over multi-decade hold.
- At projected returns (-3.0% appreciation + 3.0% rent growth), your $47k cash investment doubles in ~10 years — after that, you're playing with house money.
Negotiation context
- It's been on market 450 days — a 12% lower offer ($149k) is reasonable based on typical stale-listing flexibility.
Risks & watch-outs
- Climate carrying-cost: extreme-heat days projected 7→17/yr by 2055 (HVAC capex compounding) — expect insurance premiums to compound above CPI over the hold.
Questions for the listing agent
- It's been on market 450 days. Have you received any prior offers? Is the seller open to a 12% concession, seller financing, or rate buy-down credit?
- Why hasn't it sold? Are there any deal-killer items the seller is aware of (foundation, flood, title, zoning, code violations)?
- Is there a deadline driving the sale (1031 exchange, divorce, estate, relocation)? That informs how much negotiation room exists.
- Schools are D-rated, which usually means shorter tenancies and higher turnover. Who's the typical renter profile here, and what's been the actual vacancy rate?
- Crime grade is F in this area — have there been break-ins, vandalism, or insurance claims at this property in the last 3 years? What carrier currently insures it and at what premium?
- What's the average days-on-market for RENTAL listings here right now (not sales)? A rising rental-DOM trend means longer vacancies and softer asking-rent achievability than the comps imply.
- What's the recent tenant-quality profile in this submarket — average credit score on applications, eviction rate, late-payment / NSF rate, and stable-employment percentage? A property-management company in the area should have these aggregated.
- How much new for-sale + rental construction is in the pipeline within 1–3 miles? Heavy new supply typically softens prices + rents 12–24 months out; constrained supply supports both.
Investment metrics
- 1% rule
- 1.08% ✓
- Cap rate
- 9.46%
- Cash-on-cash
- 11.30%
- DSCR
- 1.50
- GRM
- 7.7
CMA / ARV
No comps found within radius.
Projected returns pro-forma
-3.0% appreciation · 3.0% rent growth · sell at horizon
- IRR
- 0.5%
- Equity multiple
- 1.02×
- Total profit
- $910
- Equity at exit
- $25,198
- IRR
- 10.1%
- Equity multiple
- 1.78×
- Total profit
- $37,021
- Equity at exit
- $14,612
Cash invested: $47,320 (down + closing). Projections, not guarantees.
Landlord ↔ Tenant lean methodology
- Overall (STATE)
- 85 Strongly Landlord-Friendly
- State North Carolina
- 85 Strongly Landlord-Friendly · R+3
- County
- — inherits STATE
- City
- — inherits STATE
ZIP-level market 28090
- Home prices YoY
- -3.4%
- Active inventory
- 39
- Price-to-rent
- 7.7×
Monthly cashflow live
- Estimated rent
- $1,833 medium interval (Pro) →
- Mortgage (P&I)
- −$886
- Tax from tax record
- −$46 /mo · $548/yr
- Insurance
- −$70
- HOA
- −$0
- Vacancy / Maint / Mgmt
- −$385
- Net cashflow
- $445
Break-even live
Sensitivity live
| Price | -10% $541 | -5% $493 | +0% $445 | +5% $398 | +10% $350 |
|---|---|---|---|---|---|
| Rent | -10% $301 | -5% $373 | +0% $445 | +5% $518 | +10% $590 |
| Rate | -1.0pp $531 | -0.5pp $488 | base $445 | +0.5pp $402 | +1.0pp $357 |
UW: 25.0% down · 7.5% · 30yr · 1.5% tax · 5.0% vac · 8.0% maint · 8.0% mgmt
Financing live
Cash to close
- Down payment
- $42,250
- Closing costs
- $5,070
- Reserves months
- —
- Total cash needed
- —
Loan-product check · same deal, 3 products live
Conventional
25% down · 7.5% · 30yr
- Down + closing
- —
- Monthly P&I
- —
- Monthly cashflow
- —
- DSCR
- —
- Eligible?
- —
Personal DTI + credit; lowest rate.
DSCR
20% down · 8.5% · 30yr
- Down + closing
- —
- Monthly P&I
- —
- Monthly cashflow
- —
- DSCR
- —
- Eligible?
- —
No personal income docs; deal must DSCR.
Hard money
10% down · 12.0% · 12mo
- Down + closing
- —
- Monthly P&I
- —
- Monthly cashflow
- —
- DSCR
- —
- Eligible?
- —
Short-term bridge; refi at stabilization.
Listing history 19 events
-
2026-06-19days on market $169,000 Active 450 DOM
-
2026-06-18days on market $169,000 Active 449 DOM
-
2026-06-17days on market $169,000 Active 448 DOM
-
2026-06-16days on market $169,000 Active 447 DOM
-
2026-06-15days on market $169,000 Active 446 DOM
-
2026-06-14days on market $169,000 Active 444 DOM
-
2026-06-13days on market $169,000 Active 443 DOM
-
2026-06-10days on market $169,000 Active 441 DOM
-
2026-06-09days on market $169,000 Active 440 DOM
-
2026-06-08days on market $169,000 Active 439 DOM
-
2026-06-07days on market $169,000 Active 438 DOM
-
2026-06-05days on market $169,000 Active 435 DOM
-
2026-06-03days on market $169,000 Active 434 DOM
-
2026-06-02days on market $169,000 Active 433 DOM
-
2026-06-01days on market $169,000 Active 432 DOM
-
2026-05-31days on market $169,000 Active 431 DOM
-
2026-05-30days on market $169,000 Active 430 DOM
-
2026-03-17price $169,000
-
2025-03-26$175,000 Active
ⓘ Source: listings_history table (triggers on properties + properties_extension) + one-shot
backfill from property_details.listing_events for pre-trigger history.
Tax reassessment forecast NC · Resets to sale price
- Current annual tax
- $548 · $46/mo
- Projected year-2 tax
- $1,386 · $115/mo
- Expected delta
- +$838/yr (+$70/mo · 152.9%)
ⓘ Screening estimate from a state-policy table — verify with the county assessor before closing.
Climate risk First Street
- Flood 1/10 Low FEMA zone X (unshaded) · 0% chance over 30 yrs
- Wildfire 4/10 Moderate
- Heat 6/10 Major 7 d/yr ≥104°F today · 17 d/yr by 30 yrs out
- Wind 2/10 Low 3% chance of damaging wind over 30 yrs
- Air quality 3/10 Moderate 3 unhealthy d/yr today · 3 by 30 yrs out
Nearby sold comps map
Loading sold comps map…
Walkable amenities ~0.75 mi
Loading nearby amenities…
Taxation est. · year 1
- Rental income
- $21,991
- − Mortgage interest
- −$9,467
- − Property taxes
- −$548
- − Insurance
- −$845
- − Repairs & maintenance
- −$1,759
- − Management
- −$1,759
- − Depreciation
- −$4,916
- Taxable income
- $2,697
- Est. tax owed @ 24.0%
- −$647
- After-tax cash flow
- $4,698/yr
For passive investors: Depreciation is non-cash, so a rental often shows a tax loss while cash-flowing — sheltering income. Rental losses are passive: they offset passive income freely, and up to $25,000/yr can offset ordinary (W-2) income if you actively participate and your MAGI is under $100k (phasing out to $0 by $150k); unused losses carry forward. On sale, claimed depreciation is recaptured at up to 25%, and gains may owe capital-gains tax (a 1031 exchange can defer both). Figures are a year-1 estimate at your 24.0% rate — not tax advice; consult a CPA.
Schools (NCES district)
- District
- Cleveland County Schools
- NCES district ID
- 3700900
- Math proficiency
- 47% ▬ 0.00%
- Reading proficiency
- 49% ▲ 4.00%
- Median HH income
- $38,501
- Composite
- 40.03/100
- National rank
- #3823
- State rank
- #76 of 178 in NC
Livability — Fallston
- Score
- 59/100
- State rank
- #532
- US rank
- #19660
Category grades
Schools grade is shown separately in the Schools card above.
Census & demographics
- City population
- 306
- Population (ZIP)
- 7,422
Population outlook (Cleveland County) Hauer SSP2
- Today (2025)
- 93,671 people
- By 2030
- 91,157 · -2.7%
- By 2040
- 85,519 · -8.7%
- By 2050
- 79,708 · -14.9%
- By 2075
- 68,317 · -27.1%
- By 2100
- 57,145 · -39.0%
Race, ethnicity, and origin ACS 2023
- Neighborhood character
- Predominantly White (80%)
- Race & ethnicity
- White 80% Black 12% Two or more races 6% Hispanic / Latino 3%
- Common ancestry
- Serbian 2% Lithuanian 2% Slovak 1%
- Foreign-born
- 1% · Canada
- Languages at home
- 99% English-only · Spanish 1%
Political lean MEDSL · Cleveland
- 2024 margin
- Solid R (+35.0) · D 32.2% · R 67.2%
- 2008→2024 swing
- -15.1pp toward R · 2008: -19.9pp · 2024: -35.0pp
- All cycles
- 2024: R+35.0 2020: R+32.8 2016: R+30.6 2012: R+20.5 2008: R+19.9
Not yet ingested
- Civics
- —
Market trends
- HPI YoY
- ▼ -11.65%
- Current HPI
- 335.97
- Rent YoY
- —
- Metro
- —
- State GDP YoY
- ▲ 3.28%
- F500 in state
- 26
Industry mix (Fortune 500 HQ in NC)
| Industry | F500 HQs | Revenue |
|---|---|---|
| Financial Services | 2 | $213B |
|
||
| Retail | 2 | $95B |
|
||
| Industrial Conglomerate | 1 | $38B |
|
||
| Metals / Steel | 1 | $35B |
|
||
| Utilities | 1 | $30B |
|
||
| Industrial Machinery | 1 | $19B |
|
||
Price history
-3.4% since first listed2 events — show timeline
- 2026-03-17 Price Changed $169,000 CANOPYMLS as Distributed by MLS Grid
- 2025-03-26 Listed $175,000 CANOPYMLS as Distributed by MLS Grid
Property tax history
+2.3%/yrLatest (2025): $548 · +24.3% YoY. Source: county tax records.
Cash-flow waterfall
monthlySold comps — $/sqft
last 12 mo · ≤1 miLoading sold comps…