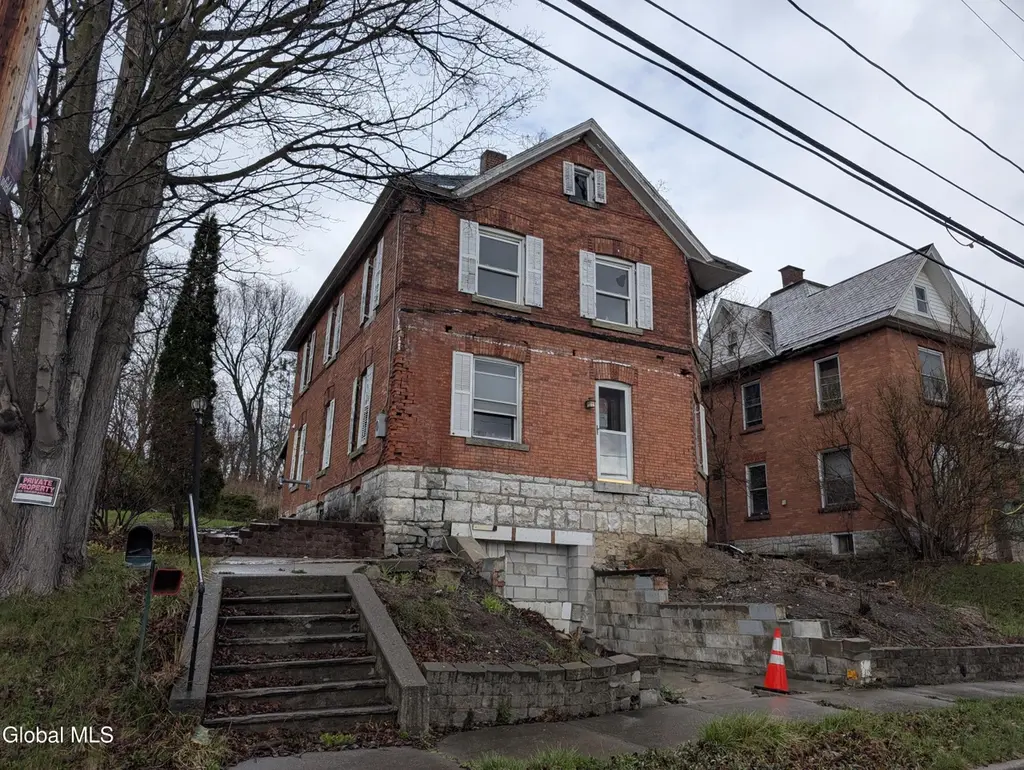
35 Monroe St · St. Johnsville, NY
Flood risk 1/10 · Minimal
- FEMA flood zone
- X (unshaded)
- Chance of flooding over 30 yrs
- 0.0%
- Est. flood insurance / yr
- $473 – $860
Fire risk 1/10 · Minimal
- Est. fire insurance / yr
- $691 – $1,283
Heat risk 3/10 · Minor
- Hot days now (above 96°F)
- 7 days/yr
- Hot days in 30 yrs
- 17 days/yr
Wind risk 2/10 · Minimal
- Chance of severe wind over 30 yrs
- 2.0%
Air-quality risk 1/10 · Minimal
- Unhealthy air days now
- 0 days/yr
- Unhealthy air days in 30 yrs
- 0 days/yr
Risk factors via First Street. Map © Google.
Why this score? — see what drove the B+ grade
The composite is a weighted blend of 9 inputs, each scored 0–100. Each bar is that input's sub-score; the figure is the points it added to the 100-point composite (weight × sub-score).
- Cash flow +30.0/30.0
- 1% rule +10.0/10.0
- DSCR +10.0/10.0
- Appreciation +10.0/10.0
- ARV discount +7.5/15.0
- Schools +3.4/10.0
- Rent growth +2.5/5.0
- Livability +2.5/5.0
- Condition / age +2.5/5.0
$48,500
🖨 Deal sheet (PDF) 📄 Offer letter ✓ Due diligence
Listing remarks
This late 1800s home is the start of a project too soon forgotten. The large wrap around porch was a safety hazard, so that has been removed. New hardwood floors, and a newer roof, mean just the kitchens and bathrooms are all that needs your own personal touch. Not currently move in ready. Due to lack of utilities, this is cash only.
Key facts
- 0.41 acre lot
- Parking
- Built 1880
Property features AI
Exterior
- Parking: Driveway with space for 1 vehicle; Street parking available on one side of Monroe
- Utilities: Public water; Public sewer
- Home design: Single-family residence; Fixer condition
- Construction: Brick construction; Asphalt roof
- Exterior features: Covered patio; Patio
Interior
- Kitchen: Kitchen on the first floor
- Bedrooms: Three bedrooms on the second level
- Flooring: Hardwood floors
- Bathrooms: Two full bathrooms (one on the first floor, one on the second floor)
- Heating & cooling: Forced-air heating
- Interior features: Unfinished walk-out basement; 11 total rooms
- Laundry & utility: First-floor laundry room
Neighborhood map
What this means for you Summary
Snapshot
- This is a 3-bed/2.0-bath single-family listed at $48k.
Deal economics
- At list price, monthly cash flow is $752 ($9k/yr) — positive.
- The deal already cash-flows at list — no discount required.
- Meets the 1% rule at list price ($1k rent vs $48k).
- Recommended offer: $46k (6.0% below list) — sets the bar for market timing.
Location & tenants
- Location reads: area grade B — affects rentability + tenant quality, not the cash-flow math above.
- Oppenheim-Ephratah-St. Johnsville CSD (rural): math 30% / reading 52% proficiency, ranked #522 of 590 in NY (top 88%) — families likely to look elsewhere, expect single-tenant / working-renter base with shorter leases.
- Zoned schools: Oppenheim-Ephratah-St Johnsville Elementary School (math 27% / reading 57%, 391 students, 54% FRL); Oppenheim-Ephratah-St Johnsville Junior/Senior High School (math 32% / reading 47%, grade F, #1,060 of 1,100 statewide, top 97%, 361 students, 49% FRL) — zoned schools at 52% FRL track the district average.
- Market conditions: 34 active listings in the ZIP; 210 units permitted in Montgomery County in 2024 (168 in 5+ unit buildings).
Forward outlook
- In year one you build about $5k of equity ($335 loan paydown + $5k appreciation (10.0% local appreciation)).
- Montgomery County population projected at -11% by 2050 — secular population decline; favor cash flow + early exit over multi-decade hold.
- At projected returns (10.0% appreciation + 3.0% rent growth), your $14k cash investment doubles in ~1 year — after that, you're playing with house money.
- By year 6, paydown + projected appreciation supports a ~$31k cash-out refi (75% LTV) — recoverable capital for the next deal without selling this one.
Negotiation context
- It's been on market 65 days — a 6% lower offer ($46k) is reasonable based on typical stale-listing flexibility.
- 5 sale attempts since 3y ago; this cycle's ask has dropped $6k (12%) from the opening price — seller is motivated, your offer sets the floor, not the list.
Risks & watch-outs
- Watch-outs: built in 1880 — expect roof / HVAC / electrical / plumbing capex.
Questions for the listing agent
- It's been on market 65 days. Have you received any prior offers? Is the seller open to a 6% concession, seller financing, or rate buy-down credit?
- Built in 1880 — when were the roof, HVAC, electrical panel, plumbing, and water heater last replaced?
- Why hasn't it sold? Are there any deal-killer items the seller is aware of (foundation, flood, title, zoning, code violations)?
- Is there a deadline driving the sale (1031 exchange, divorce, estate, relocation)? That informs how much negotiation room exists.
- What's the average days-on-market for RENTAL listings here right now (not sales)? A rising rental-DOM trend means longer vacancies and softer asking-rent achievability than the comps imply.
- What's the recent tenant-quality profile in this submarket — average credit score on applications, eviction rate, late-payment / NSF rate, and stable-employment percentage? A property-management company in the area should have these aggregated.
- How much new for-sale + rental construction is in the pipeline within 1–3 miles? Heavy new supply typically softens prices + rents 12–24 months out; constrained supply supports both.
Investment metrics
- 1% rule
- 2.84% ✓
- Cap rate
- 24.89%
- Cash-on-cash
- 66.42%
- DSCR
- 3.96
- GRM
- 2.9
CMA / ARV
- ARV (on-the-fly)
- $202,160
- Comps found
- 6
Show comp detail 6 sales within ~0.75 mi
| Address | Dist | Beds/Ba | Sqft | Sold | Price | $/sf | Match |
|---|---|---|---|---|---|---|---|
| 7 John St | 0.41mi | 4/1.5 (+1) | 2,170 (+2%) | 9mo | $53,500 | $25 | 63 |
| 26 Washington St | 0.12mi | 3/1.5 | 1,832 (-14%) | 14mo | $220,000 | $120 | 58 |
| 28 S Division St | 0.39mi | 3/2.0 | 2,000 (-6%) | 22mo | $190,000 | $95 | 53 |
| 7482 State Highway 5 | 0.35mi | 4/2.0 (+1) | 2,302 (+8%) | 18mo | $169,148 | $73 | 50 |
| 23 Failing Ave | 0.56mi | 3/2.0 | 1,944 (-9%) | 13mo | $189,000 | $97 | 49 |
| 7694 State Highway 5 | 0.72mi | 4/1.0 (+1) | 1,912 (-10%) | 11mo | $125,025 | $65 | 32 |
Match score weights: distance 35% · size 25% · config 20% · recency 20%. Top-matched comps best support the ARV.
Projected returns pro-forma
10.0% appreciation · 3.0% rent growth · sell at horizon
- IRR
- 77.8%
- Equity multiple
- 6.47×
- Total profit
- $74,309
- Equity at exit
- $43,693
- IRR
- 71.9%
- Equity multiple
- 14.34×
- Total profit
- $181,222
- Equity at exit
- $94,225
Cash invested: $13,580 (down + closing). Projections, not guarantees.
Landlord ↔ Tenant lean methodology
- Overall (STATE)
- 15 Strongly Tenant-Friendly
- State New York
- 15 Strongly Tenant-Friendly · D+10
- County
- — inherits STATE
- City
- — inherits STATE
ZIP-level market 13452
- Home prices YoY
- 3.4%
- Active inventory
- 34
- Price-to-rent
- 2.9×
Monthly cashflow live
- Estimated rent
- $1,376 medium interval (Pro) →
- Mortgage (P&I)
- −$254
- Tax est. 1.5%
- −$61 /mo · $728/yr
- Insurance
- −$20
- HOA
- −$0
- Vacancy / Maint / Mgmt
- −$289
- Net cashflow
- $752
Break-even live
Sensitivity live
| Price | -10% $785 | -5% $768 | +0% $752 | +5% $735 | +10% $718 |
|---|---|---|---|---|---|
| Rent | -10% $643 | -5% $697 | +0% $752 | +5% $806 | +10% $860 |
| Rate | -1.0pp $776 | -0.5pp $764 | base $752 | +0.5pp $739 | +1.0pp $726 |
UW: 25.0% down · 7.5% · 30yr · 1.5% tax · 5.0% vac · 8.0% maint · 8.0% mgmt
Financing live
Cash to close
- Down payment
- $12,125
- Closing costs
- $1,455
- Reserves months
- —
- Total cash needed
- —
Loan-product check · same deal, 3 products live
Conventional
25% down · 7.5% · 30yr
- Down + closing
- —
- Monthly P&I
- —
- Monthly cashflow
- —
- DSCR
- —
- Eligible?
- —
Personal DTI + credit; lowest rate.
DSCR
20% down · 8.5% · 30yr
- Down + closing
- —
- Monthly P&I
- —
- Monthly cashflow
- —
- DSCR
- —
- Eligible?
- —
No personal income docs; deal must DSCR.
Hard money
10% down · 12.0% · 12mo
- Down + closing
- —
- Monthly P&I
- —
- Monthly cashflow
- —
- DSCR
- —
- Eligible?
- —
Short-term bridge; refi at stabilization.
Listing history 27 events
-
2026-06-21days on market $48,500 Active 65 DOM
-
2026-06-21days on market $48,500 Active 64 DOM
-
2026-06-18days on market $48,500 Active 62 DOM
-
2026-06-17days on market $48,500 Active 61 DOM
-
2026-06-16days on market $48,500 Active 60 DOM
-
2026-06-16price $48,500 Active 59 DOM
-
2026-06-15days on market $50,000 Active 59 DOM
-
2026-06-13days on market $50,000 Active 57 DOM
-
2026-06-12days on market $50,000 Active 56 DOM
-
2026-06-09days on market $50,000 Active 53 DOM
-
2026-06-08days on market $50,000 Active 52 DOM
-
2026-06-07days on market $50,000 Active 51 DOM
-
2026-06-05days on market $50,000 Active 49 DOM
-
2026-06-04pricedays on market $50,000 Active 47 DOM
-
2026-06-02days on market $54,000 Active 46 DOM
-
2026-06-01days on market $54,000 Active 45 DOM
-
2026-05-31days on market $54,000 Active 44 DOM
-
2026-04-17$55,000 Active
-
2025-12-06historical
-
2025-08-04$90,000 Active
-
2024-12-04historical $1,350
-
2024-11-14price $1,350
-
2024-11-14$1,310
-
2024-01-14historical
-
2023-12-20$49,000 Active
-
2023-12-20historical
-
2023-12-01$49,000 Active
ⓘ Source: listings_history table (triggers on properties + properties_extension) + one-shot
backfill from property_details.listing_events for pre-trigger history.
Climate risk First Street
- Flood 1/10 Low FEMA zone X (unshaded) · 0% chance over 30 yrs
- Wildfire 1/10 Low
- Heat 3/10 Moderate 7 d/yr ≥96°F today · 17 d/yr by 30 yrs out
- Wind 2/10 Low 2% chance of damaging wind over 30 yrs
- Air quality 1/10 Low 0 unhealthy d/yr today · 0 by 30 yrs out
Nearby sold comps map
Loading sold comps map…
Walkable amenities ~0.75 mi
Loading nearby amenities…
Taxation est. · year 1
- Rental income
- $16,509
- − Mortgage interest
- −$2,717
- − Property taxes
- −$728
- − Insurance
- −$242
- − Repairs & maintenance
- −$1,321
- − Management
- −$1,321
- − Depreciation
- −$1,411
- Taxable income
- $8,770
- Est. tax owed @ 24.0%
- −$2,105
- After-tax cash flow
- $6,915/yr
For passive investors: Depreciation is non-cash, so a rental often shows a tax loss while cash-flowing — sheltering income. Rental losses are passive: they offset passive income freely, and up to $25,000/yr can offset ordinary (W-2) income if you actively participate and your MAGI is under $100k (phasing out to $0 by $150k); unused losses carry forward. On sale, claimed depreciation is recaptured at up to 25%, and gains may owe capital-gains tax (a 1031 exchange can defer both). Figures are a year-1 estimate at your 24.0% rate — not tax advice; consult a CPA.
Schools (NCES district)
- District
- Oppenheim-Ephratah-St. Johnsville CSD
- NCES district ID
- 3601107
- Math proficiency
- 30% ▼ -18.00%
- Reading proficiency
- 52% ▲ 7.00%
- Median HH income
- $39,730
- Composite
- 34.25/100
- National rank
- #5253
- State rank
- #522 of 590 in NY
Livability — St. Johnsville
No livability data for this city. (Only ~50 U.S. cities are tracked.)
Census & demographics
- Census place
- St. Johnsville, NY
- Population (ZIP)
- 4,850
Population outlook (Montgomery County) Hauer SSP2
- Today (2025)
- 48,683 people
- By 2030
- 47,785 · -1.8%
- By 2040
- 45,492 · -6.6%
- By 2050
- 43,161 · -11.3%
- By 2075
- 38,134 · -21.7%
- By 2100
- 32,337 · -33.6%
Race, ethnicity, and origin ACS 2023
- Neighborhood character
- Predominantly White (91%)
- Race & ethnicity
- White 91% Two or more races 5% Hispanic / Latino 4%
- Common ancestry
- Romanian 5% Iranian 3% Lithuanian 2%
- Foreign-born
- 1% · Canada
- Languages at home
- 97% English-only · German/W. Germanic 2% Spanish 1%
Political lean MEDSL · Montgomery
- 2024 margin
- Strong R (+28.7) · D 35.6% · R 64.4%
- 2008→2024 swing
- -20.6pp toward R · 2008: -8.1pp · 2024: -28.7pp
- All cycles
- 2024: R+28.7 2020: R+22.6 2016: R+26.5 2012: R+4.4 2008: R+8.1
Not yet ingested
- Civics
- —
Market trends
- HPI YoY
- ▲ 11.23%
- Current HPI
- 342.6782
- Rent YoY
- —
- Metro
- —
- State GDP YoY
- ▲ 2.60%
- F500 in state
- 92
Industry mix (Fortune 500 HQ in NY)
| Industry | F500 HQs | Revenue |
|---|---|---|
| Financial Services | 10 | $950B |
|
||
| Consumer Goods | 9 | $162B |
|
||
| Insurance | 4 | $225B |
|
||
| Telecommunications | 2 | $144B |
|
||
| Pharmaceuticals | 2 | $112B |
|
||
| Media / Entertainment | 2 | $69B |
|
||
Price history
+12.2% since first listed10 events — show timeline
- 2026-04-17 Listed $55,000 Global MLS
- 2025-12-06 Listing Removed — Global MLS
- 2025-08-04 Listed $90,000 Global MLS
- 2024-12-04 Rental Removed $1,350 TURBOTENANT
- 2024-11-14 Price Changed $1,350 TURBOTENANT
- 2024-11-14 Listed for Rent $1,310 TURBOTENANT
- 2024-01-14 Listing Removed — Global MLS
- 2023-12-20 Listing Removed — Global MLS
- 2023-12-20 Listed $49,000 Global MLS
- 2023-12-01 Listed $49,000 Global MLS
Property tax history
+2.4%/yrLatest (2025): $2,846 · +2.2% YoY. Source: county tax records.
Cash-flow waterfall
monthlySold comps — $/sqft
last 12 mo · ≤1 miLoading sold comps…