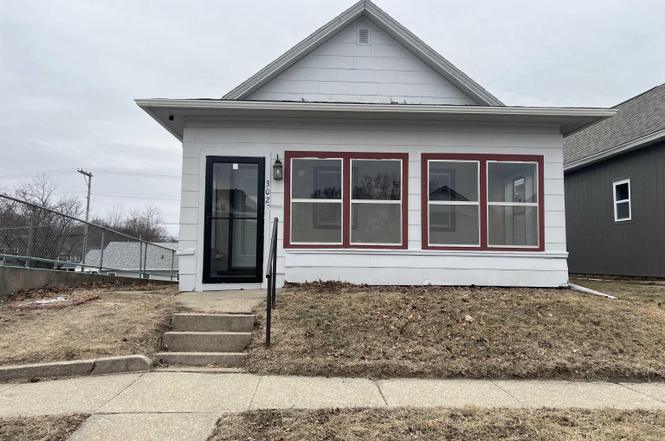
302 N Elm St · Creston, IA
Flood risk 1/10 · Minimal
- FEMA flood zone
- X (unshaded)
- Chance of flooding over 30 yrs
- 0.0%
- Est. flood insurance / yr
- $473 – $860
Fire risk 4/10 · Minor
- Est. fire insurance / yr
- $902 – $1,676
Heat risk 3/10 · Minor
- Hot days now (above 103°F)
- 7 days/yr
- Hot days in 30 yrs
- 15 days/yr
Wind risk 2/10 · Minimal
- Chance of severe wind over 30 yrs
- —
Air-quality risk 2/10 · Minimal
- Unhealthy air days now
- 0 days/yr
- Unhealthy air days in 30 yrs
- 1 days/yr
Risk factors via First Street. Map © Google.
Why this score? — see what drove the B+ grade
The composite is a weighted blend of 9 inputs, each scored 0–100. Each bar is that input's sub-score; the figure is the points it added to the 100-point composite (weight × sub-score).
- Cash flow +30.0/30.0
- ARV discount +15.0/15.0
- 1% rule +10.0/10.0
- DSCR +10.0/10.0
- Schools +5.5/10.0
- Livability +4.0/5.0
- Rent growth +2.5/5.0
- Condition / age +2.5/5.0
- Appreciation +0.0/10.0
$76,500
🖨 Deal sheet (PDF) 📄 Offer letter ✓ Due diligence
Listing remarks MLS
This is a nice three bedroom home with hardwood floors and steam heat. There's a closed in front porch and a large laundry room making it even more spacious. This house located close to town would be a great starter home or investment property.
Key facts
- Newer windows
- New roof
- 3,485 sq ft lot
Tags
Neighborhood map
What this means for you Summary
Snapshot
- This is a 3-bed/1.5-bath single-family listed at $76k.
Deal economics
- At list price, monthly cash flow is $399 ($5k/yr) — positive.
- The deal already cash-flows at list — no discount required.
- Meets the 1% rule at list price ($1k rent vs $76k).
- Recommended offer: $72k (6.0% below list) — sets the bar for market timing.
- Cap rate 12.6% vs local median 4.6% in Creston — top-decile yield for the area; either an underpriced asset or a hidden risk that comps aren't pricing in. Stress-test before assuming the spread holds.
Location & tenants
- Location reads 81/100 on livability (#76 in IA, #1,607 nationally) — a professional / high-income tenant draw. Strengths: cost of living A+, housing A+, health & safety A+; Watch: employment C-, amenities F.
- Creston Community School District (town): math 63% / reading 69% proficiency, ranked #195 of 289 in IA (top 68%) — acceptable for families but not a draw, mixed tenant base, ~2y average lease.
- Market conditions: 78 active listings in the ZIP; 5 units permitted in Union County in 2024 (0 in 5+ unit buildings).
Forward outlook
- Local home prices are declining (-3.0%/yr); year-one equity from $529 of loan paydown is wiped out by about $2k of value loss. Plan a longer hold.
- At projected returns (-3.0% appreciation + 3.0% rent growth), your $21k cash investment doubles in ~6 years — after that, you're playing with house money.
Negotiation context
- It's been on market 76 days — a 6% lower offer ($72k) is reasonable based on typical stale-listing flexibility.
- 2 sale attempts since 10y ago with the ask held roughly flat each time — persistent listings suggest the price (not the market) is what's stuck; bring a comps-based counter.
- Current owner paid $24k; list at $76k implies a 226% gain — meaningful room to come down on a strong offer.
Risks & watch-outs
- Watch-outs: built in 1888 — expect roof / HVAC / electrical / plumbing capex.
Questions for the listing agent
- It's been on market 76 days. Have you received any prior offers? Is the seller open to a 6% concession, seller financing, or rate buy-down credit?
- Built in 1888 — when were the roof, HVAC, electrical panel, plumbing, and water heater last replaced?
- Why hasn't it sold? Are there any deal-killer items the seller is aware of (foundation, flood, title, zoning, code violations)?
- Is there a deadline driving the sale (1031 exchange, divorce, estate, relocation)? That informs how much negotiation room exists.
- Schools are B-rated — typically a magnet for longer-tenancy family renters. What's the average tenant stay here, and is there a school-zone premium baked into asking?
- What's the average days-on-market for RENTAL listings here right now (not sales)? A rising rental-DOM trend means longer vacancies and softer asking-rent achievability than the comps imply.
- What's the recent tenant-quality profile in this submarket — average credit score on applications, eviction rate, late-payment / NSF rate, and stable-employment percentage? A property-management company in the area should have these aggregated.
- How much new for-sale + rental construction is in the pipeline within 1–3 miles? Heavy new supply typically softens prices + rents 12–24 months out; constrained supply supports both.
Investment metrics
- 1% rule
- 1.55% ✓
- Cap rate
- 12.55%
- Cash-on-cash
- 22.36%
- DSCR
- 2.00
- GRM
- 5.4
CMA / ARV
- ARV (on-the-fly)
- $111,524
- Comps found
- 12
Show comp detail 12 sales within ~0.75 mi
| Address | Dist | Beds/Ba | Sqft | Sold | Price | $/sf | Match |
|---|---|---|---|---|---|---|---|
| 302 N Elm St | 0.00mi | 3/1.0 | 1,138 (0%) | 1mo | $75,000 | $66 | 98 |
| 103 N Sumner Ave | 0.46mi | 2/— (-1) | 1,146 (+1%) | 2mo | $11,000 | $10 | 70 |
| 303 W Mills St | 0.02mi | 2/1.0 (-1) | 997 (-12%) | 1mo | $60,000 | $60 | 70 |
| 606 N Elm St | 0.27mi | 3/1.0 | 1,004 (-12%) | 1mo | $115,000 | $115 | 65 |
| 707 N Birch St | 0.50mi | 3/1.0 | 1,064 (-6%) | 3mo | $133,000 | $125 | 61 |
| 606 S Elm St | 0.63mi | 3/2.0 | 1,172 (+3%) | 3mo | $165,500 | $141 | 61 |
| 1007 N Maple St | 0.61mi | 3/2.0 | 1,180 (+4%) | 3mo | $163,500 | $139 | 61 |
| 208 N Cherry St | 0.37mi | 3/1.0 | 989 (-13%) | 0mo | $50,000 | $51 | 59 |
| 501 N Mulberry St | 0.55mi | 2/1.0 (-1) | 1,194 (+5%) | 2mo | $103,000 | $86 | 58 |
| 905 W Montgomery St | 0.49mi | 2/1.0 (-1) | 1,018 (-10%) | 2mo | $181,500 | $178 | 51 |
| 505 N Chestnut St | 0.62mi | 2/1.0 (-1) | 1,227 (+8%) | 1mo | $85,000 | $69 | 50 |
| 509 W Buckeye St | 0.73mi | 2/1.0 (-1) | 1,016 (-11%) | 3mo | $100,000 | $98 | 39 |
Match score weights: distance 35% · size 25% · config 20% · recency 20%. Top-matched comps best support the ARV.
Projected returns pro-forma
-3.0% appreciation · 3.0% rent growth · sell at horizon
- IRR
- 15.2%
- Equity multiple
- 1.61×
- Total profit
- $13,053
- Equity at exit
- $11,406
- IRR
- 23.9%
- Equity multiple
- 3.06×
- Total profit
- $44,205
- Equity at exit
- $6,614
Cash invested: $21,420 (down + closing). Projections, not guarantees.
Landlord ↔ Tenant lean methodology
- Overall (STATE)
- 83 Strongly Landlord-Friendly
- State Iowa
- 83 Strongly Landlord-Friendly · R+6
- County
- — inherits STATE
- City
- — inherits STATE
ZIP-level market 50801
- Home prices YoY
- -5.9%
- Active inventory
- 78
- Price-to-rent
- 5.4×
Monthly cashflow live
- Estimated rent
- $1,188 medium interval (Pro) →
- Mortgage (P&I)
- −$401
- Tax from tax record
- −$106 /mo · $1,272/yr
- Insurance
- −$32
- HOA
- −$0
- Vacancy / Maint / Mgmt
- −$249
- Net cashflow
- $399
Break-even live
Sensitivity live
| Price | -10% $443 | -5% $421 | +0% $399 | +5% $378 | +10% $356 |
|---|---|---|---|---|---|
| Rent | -10% $305 | -5% $352 | +0% $399 | +5% $446 | +10% $493 |
| Rate | -1.0pp $438 | -0.5pp $419 | base $399 | +0.5pp $379 | +1.0pp $359 |
UW: 25.0% down · 7.5% · 30yr · 1.5% tax · 5.0% vac · 8.0% maint · 8.0% mgmt
Financing live
Cash to close
- Down payment
- $19,125
- Closing costs
- $2,295
- Reserves months
- —
- Total cash needed
- —
Loan-product check · same deal, 3 products live
Conventional
25% down · 7.5% · 30yr
- Down + closing
- —
- Monthly P&I
- —
- Monthly cashflow
- —
- DSCR
- —
- Eligible?
- —
Personal DTI + credit; lowest rate.
DSCR
20% down · 8.5% · 30yr
- Down + closing
- —
- Monthly P&I
- —
- Monthly cashflow
- —
- DSCR
- —
- Eligible?
- —
No personal income docs; deal must DSCR.
Hard money
10% down · 12.0% · 12mo
- Down + closing
- —
- Monthly P&I
- —
- Monthly cashflow
- —
- DSCR
- —
- Eligible?
- —
Short-term bridge; refi at stabilization.
Listing history 7 events
-
2026-04-20status Pending
-
2026-04-12historical Active Under Contract
-
2026-02-03$76,500 Active
-
2016-12-05soldstatus $23,500
-
2016-12-02soldstatus $23,500 244-char remark
Show marketing remark (244 chars)
This is a nice three bedroom home with hardwood floors and steam heat. There's a closed in front porch and a large laundry room making it even more spacious. This house located close to town would be a great starter home or investment property.
-
2016-11-01$27,500 244-char remark
Show marketing remark (244 chars)
This is a nice three bedroom home with hardwood floors and steam heat. There's a closed in front porch and a large laundry room making it even more spacious. This house located close to town would be a great starter home or investment property.
-
2006-08-14soldstatus $25,000
ⓘ Source: listings_history table (triggers on properties + properties_extension) + one-shot
backfill from property_details.listing_events for pre-trigger history.
Tax reassessment forecast IA · Partial reset (capped growth)
- Current annual tax
- $1,272 · $106/mo
- Projected year-2 tax
- $1,272 · $106/mo
- Expected delta
- $0/yr ($0/mo · 0.0%)
ⓘ Screening estimate from a state-policy table — verify with the county assessor before closing.
Climate risk First Street
- Flood 1/10 Low FEMA zone X (unshaded) · 0% chance over 30 yrs
- Wildfire 4/10 Moderate
- Heat 3/10 Moderate 7 d/yr ≥103°F today · 15 d/yr by 30 yrs out
- Wind 2/10 Low
- Air quality 2/10 Low 0 unhealthy d/yr today · 1 by 30 yrs out
Nearby sold comps map
Loading sold comps map…
Walkable amenities ~0.75 mi
Loading nearby amenities…
Taxation est. · year 1
- Rental income
- $14,252
- − Mortgage interest
- −$4,285
- − Property taxes
- −$1,272
- − Insurance
- −$382
- − Repairs & maintenance
- −$1,140
- − Management
- −$1,140
- − Depreciation
- −$2,225
- Taxable income
- $3,806
- Est. tax owed @ 24.0%
- −$914
- After-tax cash flow
- $3,877/yr
For passive investors: Depreciation is non-cash, so a rental often shows a tax loss while cash-flowing — sheltering income. Rental losses are passive: they offset passive income freely, and up to $25,000/yr can offset ordinary (W-2) income if you actively participate and your MAGI is under $100k (phasing out to $0 by $150k); unused losses carry forward. On sale, claimed depreciation is recaptured at up to 25%, and gains may owe capital-gains tax (a 1031 exchange can defer both). Figures are a year-1 estimate at your 24.0% rate — not tax advice; consult a CPA.
Schools (NCES district)
- District
- Creston Community School District
- NCES district ID
- 1908310
- Math proficiency
- 63% ▬ 0.00%
- Reading proficiency
- 69% ▲ 4.00%
- Median HH income
- $42,292
- Composite
- 55.29/100
- National rank
- #1263
- State rank
- #195 of 289 in IA
Livability — Creston
- Score
- 81/100
- State rank
- #76
- US rank
- #1607
Category grades
Schools grade is shown separately in the Schools card above.
Census & demographics
- Census place
- Creston, IA
- Population (ZIP)
- 9,027
Population outlook (Union County) Hauer SSP2
- Today (2025)
- 12,536 people
- By 2030
- 12,561 · +0.2%
- By 2040
- 12,583 · +0.4%
- By 2050
- 12,543 · +0.1%
- By 2075
- 12,816 · +2.2%
- By 2100
- 12,754 · +1.7%
Race, ethnicity, and origin ACS 2023
- Neighborhood character
- Predominantly White (94%)
- Race & ethnicity
- White 94% Two or more races 3% Hispanic / Latino 2%
- Common ancestry
- Romanian 3% Slovak 2% Portuguese 2%
- Foreign-born
- 0%
- Languages at home
- 98% English-only · Spanish 1% German/W. Germanic 1%
Political lean MEDSL · Union
- 2024 margin
- Solid R (+36.2) · D 31.2% · R 67.4% · Other 1.3%
- 2008→2024 swing
- -39.9pp toward R · 2008: 3.7pp · 2024: -36.2pp
- All cycles
- 2024: R+36.2 2020: R+31.5 2016: R+27.8 2012: D+3.9 2008: D+3.7
Not yet ingested
- Civics
- —
Market trends
- HPI YoY
- ▼ -13.71%
- Current HPI
- 217.2057
- Rent YoY
- —
- Metro
- —
- State GDP YoY
- ▲ 2.48%
- F500 in state
- 4
Industry mix (Fortune 500 HQ in IA)
| Industry | F500 HQs | Revenue |
|---|---|---|
| Financial Services | 1 | $16B |
|
||
| Retail / Convenience | 1 | $15B |
|
||
Price history
+206.0% since first listed7 events — show timeline
- 2026-04-20 Pending — IAR
- 2026-04-12 Contingent — IAR
- 2026-02-03 Listed $76,500 IAR
- 2016-12-05 Sold (Public Records) $23,500 Public Records
- 2016-12-02 Sold (MLS) $23,500 IAR
- 2016-11-01 Listed $27,500 IAR
- 2006-08-14 Sold (Public Records) $25,000 Public Records
Property tax history
+6.6%/yrLatest (2025): $1,272 · +33.1% YoY. Source: county tax records.
Cash-flow waterfall
monthlySold comps — $/sqft
last 12 mo · ≤1 miLoading sold comps…