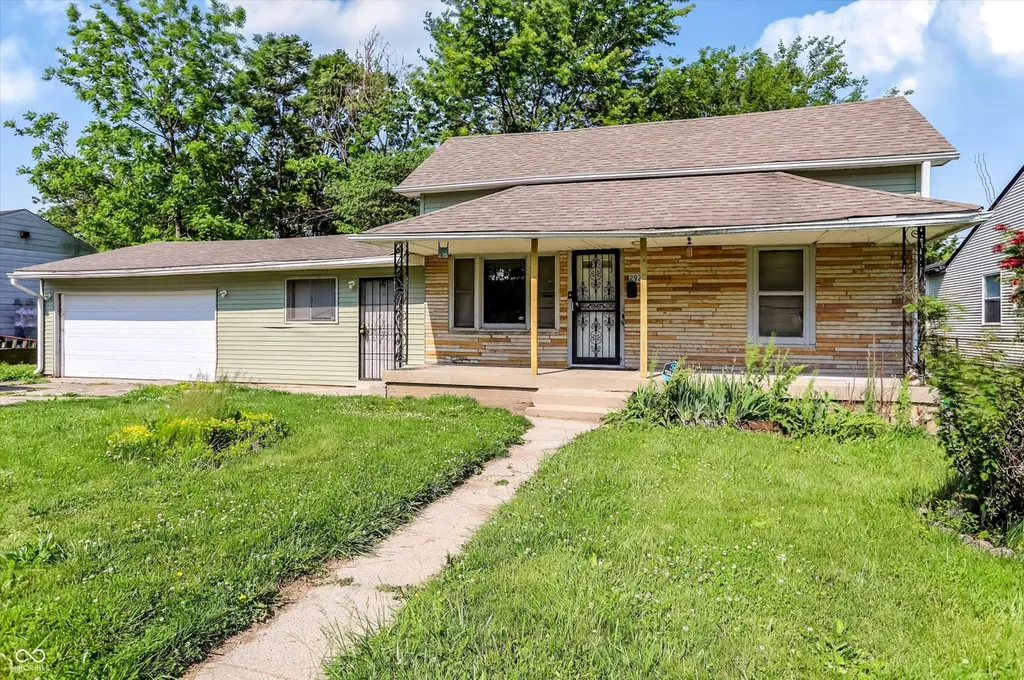
2920 Schofield Ave · Indianapolis city (balance), IN
Flood risk 1/10 · Minimal
- FEMA flood zone
- X (unshaded)
- Chance of flooding over 30 yrs
- 0.0%
- Est. flood insurance / yr
- $507 – $1,088
Fire risk 1/10 · Minimal
- Est. fire insurance / yr
- $717 – $1,331
Heat risk 4/10 · Minor
- Hot days now (above 102°F)
- 7 days/yr
- Hot days in 30 yrs
- 19 days/yr
Wind risk 2/10 · Minimal
- Chance of severe wind over 30 yrs
- 1.0%
Air-quality risk 4/10 · Minor
- Unhealthy air days now
- 5 days/yr
- Unhealthy air days in 30 yrs
- 7 days/yr
Risk factors via First Street. Map © Google.
Why this score? — see what drove the B grade
The composite is a weighted blend of 9 inputs, each scored 0–100. Each bar is that input's sub-score; the figure is the points it added to the 100-point composite (weight × sub-score).
- Cash flow +30.0/30.0
- ARV discount +15.0/15.0
- 1% rule +10.0/10.0
- DSCR +10.0/10.0
- Rent growth +2.7/5.0
- Livability +2.5/5.0
- Condition / age +2.5/5.0
- Schools +1.4/10.0
- Appreciation +0.0/10.0
$84,555
🖨 Deal sheet 📄 Offer letter ✓ Due diligence
Listing remarks
LOW PRICE & high potential! This large home features 3-bedroom, 1 bath, 2 story home with an oversized 2 car attached garage & is situated in a rapidly growing East side community! With new vinyl siding & soffits recently installed, this home is bursting with equity!
Key facts
- New vinyl siding
- 0.24 acre lot
- 2 garage spots
Tags
Property features AI
Finance
- Other: Property listed as residential — single family
- Financial info: No financial details provided
- HOA & community: No HOA information provided
Exterior
- Parking: Attached 2-car garage (approximately 462 sq ft)
- Security: No accessibility features noted
- Utilities: Public water; Municipal sewer connection; Regular solid waste service
- Home design: Single-family residence; Two-story home
- Construction: Vinyl and wood siding; Poured concrete foundation
- Exterior features: Lot is approximately 0.24 acres
Interior
- Kitchen: Kitchen on main level
- Bedrooms: Three bedrooms total — two on the main level and one on the upper level
- Flooring: No flooring information provided
- Bathrooms: One full bathroom
- Heating & cooling: Forced-air heating; No central air
- Interior features: Appliances not included
- Laundry & utility: No laundry information provided
Neighborhood map
What this means for you Summary
Snapshot
- This is a 2-bed/1.0-bath single-family listed at $85k.
Deal economics
- At list price, monthly cash flow is $489 ($6k/yr) — positive.
- The deal already cash-flows at list — no discount required.
- Meets the 1% rule at list price ($2k rent vs $85k).
- Recommended offer: $83k (1.5% below list) — sets the bar for market timing.
- Cap rate 13.2% vs local median 4.4% in Indianapolis city (balance) — top-decile yield for the area; either an underpriced asset or a hidden risk that comps aren't pricing in. Stress-test before assuming the spread holds.
Location & tenants
- Location reads: area grade B — affects rentability + tenant quality, not the cash-flow math above.
- Indianapolis Public Schools (urban): math 14% / reading 20% proficiency, ranked #286 of 301 in IN (top 95%) — low school quality limits family demand, transient renter base, plan for 1-2y turnover; 77% free/reduced lunch — lower-income household profile, screen leases tightly.
- Market conditions: Rents flat; 334 active listings in the ZIP; 40 comparable units currently listed for rent nearby; rentals at typical pace (median 24d on market — plan ~3-4 weeks tenant-placement turnaround); lower-income renter base — watch delinquency; 1,906 units permitted in Marion County in 2024 (621 in 5+ unit buildings).
- At $1,518/mo this rent would consume 48% of the median local household income ($38k/yr) (locally 2340% of renters already pay >50% of income on rent) — very limited rent-growth headroom before tenants either downsize or default.
Forward outlook
- Local home prices are declining (-3.0%/yr); year-one equity from $584 of loan paydown is wiped out by about $3k of value loss. Plan a longer hold.
- Marion County population projected at +18% by 2050 — long-run rental-demand tailwind backs the buy-and-hold thesis.
- At projected returns (-3.0% appreciation + 0.8% rent growth), your $24k cash investment doubles in ~6 years — after that, you're playing with house money.
Negotiation context
- It's been on market 18 days — a 2% lower offer ($83k) is reasonable based on typical stale-listing flexibility.
- 3 sale attempts since 6y ago with the ask held roughly flat each time — persistent listings suggest the price (not the market) is what's stuck; bring a comps-based counter.
Risks & watch-outs
- Watch-outs: property tax is 3.3% of price; built in 1922 — expect roof / HVAC / electrical / plumbing capex.
Questions for the listing agent
- Built in 1922 — when were the roof, HVAC, electrical panel, plumbing, and water heater last replaced?
- Property tax is high relative to price — has the assessment been appealed recently, and will the sale trigger a re-assessment?
- Is there a deadline driving the sale (1031 exchange, divorce, estate, relocation)? That informs how much negotiation room exists.
- What's the average days-on-market for RENTAL listings here right now (not sales)? A rising rental-DOM trend means longer vacancies and softer asking-rent achievability than the comps imply.
- What's the recent tenant-quality profile in this submarket — average credit score on applications, eviction rate, late-payment / NSF rate, and stable-employment percentage? A property-management company in the area should have these aggregated.
- How much new for-sale + rental construction is in the pipeline within 1–3 miles? Heavy new supply typically softens prices + rents 12–24 months out; constrained supply supports both.
Investment metrics
- 1% rule
- 1.80% ✓
- Cap rate
- 13.23%
- Cash-on-cash
- 24.76%
- DSCR
- 2.10
- GRM
- 4.6
CMA / ARV
- ARV (on-the-fly)
- $118,248
- Comps found
- 12
Show comp detail 12 sales within ~0.75 mi
| Address | Dist | Beds/Ba | Sqft | Sold | Price | $/sf | Match |
|---|---|---|---|---|---|---|---|
| 2920 Schofield Ave | 0.00mi | 3/1.0 (+1) | 1,516 (0%) | 0mo | $80,000 | $53 | 95 |
| 2460 Sheldon St | 0.46mi | 2/1.0 | 1,530 (+1%) | 3mo | $120,000 | $78 | 75 |
| 2717 Sangster Ave | 0.27mi | 3/1.5 (+1) | 1,628 (+7%) | 1mo | $126,400 | $78 | 67 |
| 3214 N Tacoma Ave | 0.64mi | 2/1.0 | 1,488 (-2%) | 2mo | $194,900 | $131 | 65 |
| 2844 Schofield Ave | 0.07mi | 3/2.0 (+1) | 1,349 (-11%) | 7mo | $185,000 | $137 | 63 |
| 3338 Ralston Ave | 0.54mi | 3/1.0 (+1) | 1,470 (-3%) | 4mo | $114,000 | $78 | 62 |
| 3437 Caroline Ave | 0.71mi | 2/1.0 | 1,568 (+3%) | 1mo | $40,000 | $26 | 60 |
| 3353 Nicholas Ave | 0.60mi | 2/1.0 | 1,440 (-5%) | 5mo | $70,000 | $49 | 59 |
| 3066 N Temple Ave | 0.60mi | 2/1.0 | 1,610 (+6%) | 6mo | $60,000 | $37 | 57 |
| 3350 N Arsenal Ave | 0.60mi | 2/1.0 | 1,632 (+8%) | 5mo | $90,000 | $55 | 55 |
| 2520 Hillside Ave | 0.50mi | 3/1.0 (+1) | 1,306 (-14%) | 4mo | $175,000 | $134 | 46 |
| 3458 Orchard Ave | 0.71mi | 3/1.0 (+1) | 1,728 (+14%) | 4mo | $68,150 | $39 | 36 |
Match score weights: distance 35% · size 25% · config 20% · recency 20%. Top-matched comps best support the ARV.
Projected returns pro-forma
-3.0% appreciation · 0.81% rent growth · sell at horizon
- IRR
- 15.4%
- Equity multiple
- 1.60×
- Total profit
- $14,243
- Equity at exit
- $12,607
- IRR
- 22.3%
- Equity multiple
- 2.69×
- Total profit
- $40,022
- Equity at exit
- $7,311
Cash invested: $23,675 (down + closing). Projections, not guarantees.
Landlord ↔ Tenant lean methodology
- Overall (STATE)
- 90 Strongly Landlord-Friendly
- State Indiana
- 90 Strongly Landlord-Friendly · R+11
- County
- — inherits STATE
- City
- — inherits STATE
ZIP-level market 46218
- Home prices YoY
- -17.1%
- Rents YoY
- 0.8%
- Active inventory
- 334
- Price-to-rent
- 4.6×
Monthly cashflow live
- Estimated rent
- $1,518 high interval (Pro) →
- Mortgage (P&I)
- −$443
- Tax from tax record
- −$232 /mo · $2,788/yr
- Insurance
- −$35
- HOA
- −$0
- Vacancy / Maint / Mgmt
- −$319
- Net cashflow
- $489
Break-even live
UW: 25.0% down · 7.5% · 30yr · 1.5% tax · 5.0% vac · 8.0% maint · 8.0% mgmt
Financing live
Cash to close
- Down payment
- $21,139
- Closing costs
- $2,537
- Reserves months
- —
- Total cash needed
- —
Loan-product check · same deal, 3 products live
Conventional
25% down · 7.5% · 30yr
- Down + closing
- —
- Monthly P&I
- —
- Monthly cashflow
- —
- DSCR
- —
- Eligible?
- —
Personal DTI + credit; lowest rate.
DSCR
20% down · 8.5% · 30yr
- Down + closing
- —
- Monthly P&I
- —
- Monthly cashflow
- —
- DSCR
- —
- Eligible?
- —
No personal income docs; deal must DSCR.
Hard money
10% down · 12.0% · 12mo
- Down + closing
- —
- Monthly P&I
- —
- Monthly cashflow
- —
- DSCR
- —
- Eligible?
- —
Short-term bridge; refi at stabilization.
Rent comps 40 comps
| Address | Beds | Baths | Sqft | Rent | $/sqft | DOM | Units | Dist |
|---|---|---|---|---|---|---|---|---|
| 2820 Caroline Ave Indianapolis, IN | 3.0 | 1.5 | 1112 | $1,250 | $1.12 | 23d | 1 | 0.26mi |
| 2757 Columbia Ave Unit 2757-B Indianapolis, IN | 3.0 | 2.0 | 1350 | $1,525 | $1.13 | 43d | 1 | 0.38mi |
| 3121 Baltimore Ave Indianapolis, IN | 3.0 | 1.0 | 1232 | $7,865 | $6.38 | 7d | 1 | 0.42mi |
| 3132 Dr Andrew J Brown Ave Indianapolis, IN | 2.0 | 1.0–2.0 | 791 | $2,120 | $2.68 | 1d | 46 | 0.44mi |
| 2553 Columbia Ave Unit 2553-B Indianapolis, IN | 3.0 | 2.0 | 1350 | $1,525 | $1.13 | 43d | 1 | 0.45mi |
| 2950 Winthrop Ave Indianapolis, IN | 3.0 | 2.0 | 1224 | $1,449 | $1.18 | 43d | 1 | 0.55mi |
| 2372 Beckwith Dr Indianapolis, IN | 4.0 | 1.0–1.5 | 779 | $1,064 | $1.36 | 1d | 32 | 0.56mi |
| 3139 Guilford Ave Indianapolis, IN | 3.0 | 1.0 | 1068 | $1,345 | $1.26 | 43d | 1 | 0.57mi |
| 3110 Guilford Ave Indianapolis, IN | 3.0 | 1.5 | 1250 | $1,295 | $1.04 | 23d | 1 | 0.59mi |
| 3208 Guilford Ave Indianapolis, IN | 3.0 | 3.0 | 1800 | $1,700 | $0.94 | 12d | 1 | 0.61mi |
| 2751 Guilford Ave Unit Aunit Indianapolis, IN | 3.0 | 2.0 | 1250 | $1,750 | $1.40 | 43d | 1 | 0.63mi |
| 2751 Guilford Ave Unit B Indianapolis, IN | 3.0 | 2.0 | 1250 | $1,750 | $1.40 | 13d | 1 | 0.63mi |
| 3203 Sutherland Ave Unit 1310761P Indianapolis, IN | 2.0 | 1.0 | 1097 | $3,668 | $3.34 | 1d | 1 | 0.65mi |
| 2711 Guilford Ave Indianapolis, IN | 3.0 | 2.0 | 1250 | $1,695 | $1.36 | 23d | 1 | 0.66mi |
| 2340 Columbia Ave Unit 2340-B Indianapolis, IN | 3.0 | 2.0 | 1350 | $1,650 | $1.22 | 43d | 1 | 0.69mi |
| 1902 E 35th St Indianapolis, IN | 3.0 | 1.0 | 1100 | $1,600 | $1.45 | 43d | 1 | 0.76mi |
| 2203 Sheldon St Unit B Indianapolis, IN | 3.0 | 2.0 | 1350 | $1,500 | $1.11 | 44d | 1 | 0.78mi |
| 717 E 27th St Indianapolis, IN | 1.0 | 1.5 | 1322 | $2,600 | $1.97 | 43d | 1 | 0.79mi |
| 2707 N College Ave Indianapolis, IN | 3.0 | 2.0 | 1500 | $2,200 | $1.47 | 17d | 1 | 0.80mi |
| 2709 N College Ave Indianapolis, IN | 3.0 | 2.0 | 1500 | $2,200 | $1.47 | 23d | 1 | 0.80mi |
| 3106 N College Ave Indianapolis, IN | 3.0 | 1.5 | 1400 | $1,700 | $1.21 | 7d | 1 | 0.84mi |
| 2519 N College Ave Unit 1 Indianapolis, IN | 3.0 | 2.5 | 1416 | $1,850 | $1.31 | 43d | 1 | 0.85mi |
| 1313 E 22nd St Indianapolis, IN | 2.0 | 2.5 | 1325 | $2,750 | $2.08 | 17d | 1 | 0.86mi |
| 3476 Birchwood Ave Indianapolis, IN | 3.0 | 1.5 | 1420 | $1,625 | $1.14 | 23d | 1 | 0.93mi |
| 2830 N Park Ave Indianapolis, IN | 2.0 | 3.0 | 1500 | $1,600 | $1.07 | 43d | 1 | 0.93mi |
| 2960 N Park Ave Indianapolis, IN | 3.0 | 2.0 | 1400 | $1,595 | $1.14 | 43d | 1 | 0.93mi |
| 2960 N Park Ave Indianapolis, IN | 3.0 | 1.5 | 1400 | $1,550 | $1.11 | 23d | 1 | 0.93mi |
| 2958 N Park Ave Unit 2958 Indianapolis, IN | 3.0 | 1.5 | 1350 | $1,450 | $1.07 | 2d | 1 | 0.94mi |
| 2221 Bellefontaine St Indianapolis, IN | 3.0 | 2.5 | 1712 | $2,349 | $1.37 | 23d | 1 | 0.94mi |
| 728 E 34th St Indianapolis, IN | 3.0 | 1.0 | 1491 | $1,400 | $0.94 | 4d | 1 | 0.96mi |
| 728 E 34th St Indianapolis, IN | 3.0 | 1.0 | 1491 | $1,400 | $0.94 | 19d | 1 | 0.96mi |
| 3141 N Park Ave Indianapolis, IN | 3.0 | 1.0 | 1390 | $1,000 | $0.72 | 43d | 1 | 0.96mi |
| 3359 N College Ave Indianapolis, IN | 2.0 | 1.5 | 1450 | $1,795 | $1.24 | 10d | 1 | 0.97mi |
| 3359 N College Ave Unit 3359 Indianapolis, IN | 2.0 | 1.5 | 1082 | $1,895 | $1.75 | 23d | 1 | 0.97mi |
| 3509 Guilford Ave Indianapolis, IN | 3.0 | 1.5 | 1351 | $1,445 | $1.07 | 14d | 1 | 0.99mi |
| 2920 Ruckle St Indianapolis, IN | 3.0 | 1.5 | 1272 | $1,700 | $1.34 | 7d | 1 | 0.99mi |
| 2157 Bellefontaine St Unit 2157 Indianapolis, IN | 2.0 | 1.0 | 1200 | $1,200 | $1.00 | 23d | 1 | 0.99mi |
| 2950 Ruckle St Indianapolis, IN | 3.0 | 1.0 | 1450 | $1,300 | $0.90 | 43d | 1 | 1.00mi |
| 3541 Birchwood Ave Indianapolis, IN | 3.0 | 1.0 | 1400 | $1,549 | $1.11 | 11d | 1 | 1.00mi |
| 3370 N College Ave Indianapolis, IN | 3.0 | 1.0 | 1680 | $1,275 | $0.76 | 1d | 1 | 1.00mi |
Listing history 11 events
-
2026-06-07statusdays on market $84,555 Pending 18 DOM
-
2026-06-03days on market $84,555 Active 15 DOM
-
2026-06-02days on market $84,555 Active 14 DOM
-
2026-06-01days on market $84,555 Active 13 DOM
-
2026-05-31days on market $84,555 Active 12 DOM
-
2026-05-19$84,555 Active
-
2021-06-23historical
-
2021-04-08$69,999 Active
-
2021-03-17historical
-
2021-01-12price $79,900
-
2020-12-06$84,900 Active
ⓘ Source: listings_history table (triggers on properties + properties_extension) + one-shot
backfill from property_details.listing_events for pre-trigger history.
Tax reassessment forecast IN · Partial reset (capped growth)
- Current annual tax
- $2,788 · $232/mo
- Projected year-2 tax
- $2,788 · $232/mo
- Expected delta
- $0/yr ($0/mo · -0.0%)
ⓘ Screening estimate from a state-policy table — verify with the county assessor before closing.
Climate risk First Street
- Flood 1/10 Low FEMA zone X (unshaded) · 0% chance over 30 yrs
- Wildfire 1/10 Low
- Heat 4/10 Moderate 7 d/yr ≥102°F today · 19 d/yr by 30 yrs out
- Wind 2/10 Low 100% chance of damaging wind over 30 yrs
- Air quality 4/10 Moderate 5 unhealthy d/yr today · 7 by 30 yrs out
Nearby sold comps map
Loading sold comps map…
Walkable amenities ~0.75 mi
Loading nearby amenities…
Taxation est. · year 1
- Rental income
- $18,221
- − Mortgage interest
- −$4,736
- − Property taxes
- −$2,788
- − Insurance
- −$423
- − Repairs & maintenance
- −$1,458
- − Management
- −$1,458
- − Depreciation
- −$2,460
- Taxable income
- $4,899
- Est. tax owed @ 24.0%
- −$1,176
- After-tax cash flow
- $4,687/yr
For passive investors: Depreciation is non-cash, so a rental often shows a tax loss while cash-flowing — sheltering income. Rental losses are passive: they offset passive income freely, and up to $25,000/yr can offset ordinary (W-2) income if you actively participate and your MAGI is under $100k (phasing out to $0 by $150k); unused losses carry forward. On sale, claimed depreciation is recaptured at up to 25%, and gains may owe capital-gains tax (a 1031 exchange can defer both). Figures are a year-1 estimate at your 24.0% rate — not tax advice; consult a CPA.
Schools (NCES district)
- District
- Indianapolis Public Schools
- NCES district ID
- 1804770
- Math proficiency
- 14% ▼ -7.00%
- Reading proficiency
- 20% ▼ -3.00%
- Median HH income
- $32,034
- Composite
- 13.69/100
- National rank
- #9499
- State rank
- #286 of 301 in IN
Livability — Indianapolis city (balance)
No livability data for this city. (Only ~50 U.S. cities are tracked.)
Census & demographics
- Census place
- Indianapolis city (balance), IN
- County
- Marion County · 998,460 people
- City population
- 881,119
- Metro
- Indianapolis-Carmel-Anderson, IN
- Population (ZIP)
- 29,360
- Household income
- $38,063
- Rent vs Own
- Severe rent burden
- 2340.0
Population outlook (Marion County) Hauer SSP2
- Today (2025)
- 1,025,572 people
- By 2030
- 1,065,727 · +3.9%
- By 2040
- 1,141,577 · +11.3%
- By 2050
- 1,208,920 · +17.9%
- By 2075
- 1,367,288 · +33.3%
- By 2100
- 1,438,201 · +40.2%
Race, ethnicity, and origin ACS 2023
- Neighborhood character
- Predominantly Black (68%)
- Race & ethnicity
- Black 68% White 18% Hispanic / Latino 9% Two or more races 6%
- Hispanic origin (detail)
- Mexican 6%
- Common ancestry
- Romanian 1%
- Foreign-born
- 5% · Canada, Philippines
- Languages at home
- 92% English-only · Spanish 7%
Political lean MEDSL · Marion
- 2024 margin
- Strong D (+27.7) · D 63.0% · R 35.3% · Other 1.7%
- 2008→2024 swing
- -0.7pp no change · 2008: 28.4pp · 2024: 27.7pp
- All cycles
- 2024: D+27.7 2020: D+29.1 2016: D+22.8 2012: D+22.2 2008: D+28.4
Not yet ingested
- Civics
- —
Market trends
- HPI YoY
- ▼ -81.57%
- Current HPI
- 395.7071
- Rent YoY
- ▲ 0.81%
- Metro
- Indianapolis-Carmel-Anderson, IN
- State GDP YoY
- ▲ 2.90%
- F500 in state
- 18
Industry mix (Fortune 500 HQ in IN)
| Industry | F500 HQs | Revenue |
|---|---|---|
| Industrial Machinery | 2 | $37B |
|
||
| Healthcare | 1 | $177B |
|
||
| Pharmaceuticals | 1 | $45B |
|
||
| Metals / Steel | 1 | $18B |
|
||
| Agriculture | 1 | $17B |
|
||
| Packaging | 1 | $12B |
|
||
Price history
-0.4% since first listed6 events — show timeline
- 2026-05-19 Listed $84,555 MIBOR as Distributed by MLS Grid
- 2021-06-23 Listing Removed — MIBOR as Distributed by MLS Grid
- 2021-04-08 Listed $69,999 MIBOR as Distributed by MLS Grid
- 2021-03-17 Listing Removed — MIBOR as Distributed by MLS Grid
- 2021-01-12 Price Changed $79,900 MIBOR as Distributed by MLS Grid
- 2020-12-06 Listed $84,900 MIBOR as Distributed by MLS Grid
Property tax history
+24.4%/yrLatest (2025): $2,788 · +22.0% YoY. Source: county tax records.
Cash-flow waterfall
monthlySold comps — $/sqft
last 12 mo · ≤1 miLoading sold comps…