 🏷️ Likely Rental
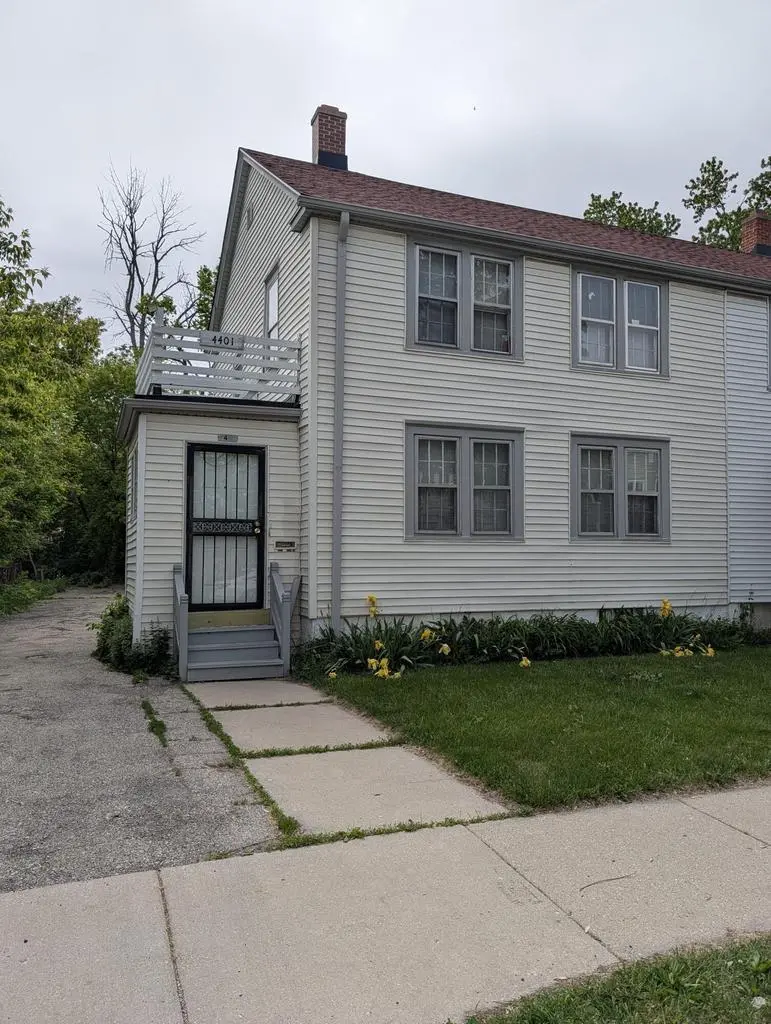
4401 N 25 St · Milwaukee, WI
Flood risk 1/10 · Minimal
- FEMA flood zone
- X (unshaded)
- Chance of flooding over 30 yrs
- 0.0%
- Est. flood insurance / yr
- $473 – $860
Fire risk 1/10 · Minimal
- Est. fire insurance / yr
- $636 – $1,182
Heat risk 2/10 · Minimal
- Hot days now (above 98°F)
- 7 days/yr
- Hot days in 30 yrs
- 13 days/yr
Wind risk 2/10 · Minimal
- Chance of severe wind over 30 yrs
- —
Air-quality risk 3/10 · Minor
- Unhealthy air days now
- 3 days/yr
- Unhealthy air days in 30 yrs
- 4 days/yr
Risk factors via First Street. Map © Google.
Why this score? — see what drove the B+ grade
The composite is a weighted blend of 9 inputs, each scored 0–100. Each bar is that input's sub-score; the figure is the points it added to the 100-point composite (weight × sub-score).
- Cash flow +30.0/30.0
- ARV discount +15.0/15.0
- 1% rule +10.0/10.0
- DSCR +10.0/10.0
- Rent growth +4.7/5.0
- Livability +4.0/5.0
- Condition / age +2.5/5.0
- Schools +1.2/10.0
- Appreciation +0.0/10.0
$70,000
🖨 Deal sheet 📄 Offer letter ✓ Due diligence
Listing remarks
Come join the Historic Garden Homes community. You'll likely pay less for your mortgage than you're currently paying for rent. Entry porch leads to generously sized living room with original plaster walls. Dining room boasts two corner built in china cabinets. Kitchen with new vinyl floor completes the first floor. Upper level offers 3 bedrooms and full bathroom. Spacious backyard for your children, pets or summer entertainment. Off street parking completes this package. New Roof 2020 Chimney rebuilt 2020 New furnace November 2025Seller prefers owner occupied buyer
Key facts
- 3,920 sq ft lot
- Parking
- Built 1923
Neighborhood map
What this means for you Summary
Snapshot
- This is a 3-bed/1.0-bath single-family listed at $70k.
Deal economics
- At list price, monthly cash flow is $530 ($6k/yr) — positive.
- The deal already cash-flows at list — no discount required.
- Meets the 1% rule at list price ($1k rent vs $70k).
- Cap rate 15.4% vs local median 5.1% in Milwaukee — top-decile yield for the area; either an underpriced asset or a hidden risk that comps aren't pricing in. Stress-test before assuming the spread holds.
Location & tenants
- Location reads 81/100 on livability (#55 in WI, #1,534 nationally) — a professional / high-income tenant draw. Strengths: amenities A+, commute A+, cost of living A+; Watch: employment D+, schools F, crime F.
- Milwaukee School District (urban): math 10% / reading 18% proficiency, ranked #337 of 342 in WI (top 98%) — low school quality limits family demand, transient renter base, plan for 1-2y turnover; 77% free/reduced lunch — lower-income household profile, screen leases tightly.
- Market conditions: Rents rising fast (+8.6%/yr); 168 active listings in the ZIP; 29 comparable units currently listed for rent nearby; rentals at typical pace (median 24d on market — plan ~3-4 weeks tenant-placement turnaround); 1,017 units permitted in Milwaukee County in 2024 (803 in 5+ unit buildings).
- This rent runs 31% of the median local income ($48k/yr) — at the standard rent-burdened threshold; future hikes will face affordability resistance.
Forward outlook
- Local home prices are declining (-3.0%/yr); year-one equity from $484 of loan paydown is wiped out by about $2k of value loss. Plan a longer hold.
- Milwaukee County population projected at +4% by 2050 — modest demand growth; plan on rents tracking national, not racing it.
- At projected returns (-3.0% appreciation + 8.0% rent growth), your $20k cash investment doubles in ~4 years — after that, you're playing with house money.
Negotiation context
- Only 4 days on market — expect competitive offers; lowballing is unlikely to land.
Risks & watch-outs
- Watch-outs: built in 1923 — expect roof / HVAC / electrical / plumbing capex.
Questions for the listing agent
- Built in 1923 — when were the roof, HVAC, electrical panel, plumbing, and water heater last replaced?
- Is there a deadline driving the sale (1031 exchange, divorce, estate, relocation)? That informs how much negotiation room exists.
- Schools are F-rated, which usually means shorter tenancies and higher turnover. Who's the typical renter profile here, and what's been the actual vacancy rate?
- Crime grade is F in this area — have there been break-ins, vandalism, or insurance claims at this property in the last 3 years? What carrier currently insures it and at what premium?
- What's the average days-on-market for RENTAL listings here right now (not sales)? A rising rental-DOM trend means longer vacancies and softer asking-rent achievability than the comps imply.
- What's the recent tenant-quality profile in this submarket — average credit score on applications, eviction rate, late-payment / NSF rate, and stable-employment percentage? A property-management company in the area should have these aggregated.
- How much new for-sale + rental construction is in the pipeline within 1–3 miles? Heavy new supply typically softens prices + rents 12–24 months out; constrained supply supports both.
Investment metrics
- 1% rule
- 1.82% ✓
- Cap rate
- 15.37%
- Cash-on-cash
- 32.42%
- DSCR
- 2.44
- GRM
- 4.6
CMA / ARV
- ARV (on-the-fly)
- $130,872
- Comps found
- 12
Show comp detail 12 sales within ~0.75 mi
| Address | Dist | Beds/Ba | Sqft | Sold | Price | $/sf | Match |
|---|---|---|---|---|---|---|---|
| 4401 N 25 St | 0.00mi | 3/1.0 | 1,148 (0%) | 1mo | $60,000 | $52 | 100 |
| 2602 W Port Sunlight Way | 0.10mi | 3/1.5 | 1,172 (+2%) | 1mo | $190,000 | $162 | 89 |
| 4419 N 28th St | 0.21mi | 3/1.0 | 1,192 (+4%) | 5mo | $123,000 | $103 | 80 |
| 2417 W Roosevelt Dr | 0.17mi | 4/2.0 (+1) | 1,200 (+4%) | 0mo | $194,900 | $162 | 75 |
| 3908 N 25th St | 0.62mi | 3/1.0 | 1,179 (+3%) | 1mo | $73,200 | $62 | 66 |
| 2128 W Atkinson Ave | 0.45mi | 3/1.0 | 1,210 (+5%) | 6mo | $66,000 | $55 | 65 |
| 2234 W Melvina St | 0.65mi | 3/1.0 | 1,128 (-2%) | 4mo | $98,000 | $87 | 63 |
| 4164 N 21st St | 0.42mi | 3/2.0 | 1,205 (+5%) | 6mo | $150,000 | $124 | 63 |
| 4469 N 20th St | 0.36mi | 4/1.0 (+1) | 998 (-13%) | 2mo | $40,000 | $40 | 55 |
| 4655 N 20th St | 0.49mi | 4/1.0 (+1) | 1,024 (-11%) | 1mo | $199,900 | $195 | 53 |
| 4754 N 31st St | 0.58mi | 3/1.0 | 1,027 (-10%) | 5mo | $117,000 | $114 | 51 |
| 4946 N 26th St | 0.72mi | 3/1.0 | 982 (-14%) | 3mo | $164,000 | $167 | 39 |
Match score weights: distance 35% · size 25% · config 20% · recency 20%. Top-matched comps best support the ARV.
Projected returns pro-forma
-3.0% appreciation · 8.0% rent growth · sell at horizon
- IRR
- 33.0%
- Equity multiple
- 2.49×
- Total profit
- $29,111
- Equity at exit
- $10,437
- IRR
- 42.6%
- Equity multiple
- 6.07×
- Total profit
- $99,395
- Equity at exit
- $6,052
Cash invested: $19,600 (down + closing). Projections, not guarantees.
Landlord ↔ Tenant lean methodology
- Overall (STATE)
- 73 Landlord-Friendly
- State Wisconsin
- 73 Landlord-Friendly · R+2
- County
- — inherits STATE
- City
- — inherits STATE
ZIP-level market 53209
- Rents YoY
- 8.6%
- Active inventory
- 168
- Price-to-rent
- 4.6×
Monthly cashflow live
- Estimated rent
- $1,271 high interval (Pro) →
- Mortgage (P&I)
- −$367
- Tax from tax record
- −$78 /mo · $937/yr
- Insurance
- −$29
- HOA
- −$0
- Vacancy / Maint / Mgmt
- −$267
- Net cashflow
- $530
Break-even live
UW: 25.0% down · 7.5% · 30yr · 1.5% tax · 5.0% vac · 8.0% maint · 8.0% mgmt
Financing live
Cash to close
- Down payment
- $17,500
- Closing costs
- $2,100
- Reserves months
- —
- Total cash needed
- —
Loan-product check · same deal, 3 products live
Conventional
25% down · 7.5% · 30yr
- Down + closing
- —
- Monthly P&I
- —
- Monthly cashflow
- —
- DSCR
- —
- Eligible?
- —
Personal DTI + credit; lowest rate.
DSCR
20% down · 8.5% · 30yr
- Down + closing
- —
- Monthly P&I
- —
- Monthly cashflow
- —
- DSCR
- —
- Eligible?
- —
No personal income docs; deal must DSCR.
Hard money
10% down · 12.0% · 12mo
- Down + closing
- —
- Monthly P&I
- —
- Monthly cashflow
- —
- DSCR
- —
- Eligible?
- —
Short-term bridge; refi at stabilization.
Rent comps 29 comps
| Address | Beds | Baths | Sqft | Rent | $/sqft | DOM | Units | Dist |
|---|---|---|---|---|---|---|---|---|
| 4355 N 28th St Milwaukee, WI | 2.0 | 1.0 | 1118 | $975 | $0.87 | 21d | 1 | 0.23mi |
| 4227 N 26th St Milwaukee, WI | 2.0 | 1.0 | 950 | $1,000 | $1.05 | 16d | 1 | 0.27mi |
| 3901 N 27th St Unit 3907 Milwaukee, WI | 2.0 | 1.0 | 715 | $895 | $1.25 | 23d | 1 | 0.66mi |
| 3911 N 20th St Unit 3913 Milwaukee, WI | 2.0 | 1.0 | 950 | $995 | $1.05 | 23d | 1 | 0.69mi |
| 4651 N 36th St #4 Milwaukee, WI | 2.0 | 1.0 | 747 | $945 | $1.27 | 23d | 1 | 0.79mi |
| 3927-3929 N 17th St Milwaukee, WI | 2.0 | 1.0 | 900 | $1,195 | $1.33 | 43d | 1 | 0.83mi |
| 4661 N 38th St Unit 4661 Milwaukee, WI | 2.0 | 1.0 | 1000 | $845 | $0.84 | 14d | 1 | 0.91mi |
| 5032 N 32nd St Milwaukee, WI | 3.0 | 2.0 | 1089 | $1,750 | $1.61 | 12d | 1 | 0.93mi |
| 3646 N 19th St Milwaukee, WI | 2.0 | 1.0 | 935 | $1,100 | $1.18 | 4d | 1 | 0.99mi |
| 3871-3873 N 36th St Unit 3871 Milwaukee, WI | 2.0 | 1.0 | 987 | $950 | $0.96 | 23d | 1 | 0.99mi |
| 3747 N 16th St Milwaukee, WI | 2.0 | 1.0 | 1200 | $875 | $0.73 | 43d | 1 | 1.01mi |
| 2106A W Keefe Ave Unit 2106 Lower Milwaukee, WI | 3.0 | 1.0 | 1300 | $1,100 | $0.85 | 16d | 1 | 1.03mi |
| 3410 N 23rd St Milwaukee, WI | 2.0 | 1.0 | 800 | $800 | $1.00 | 16d | 1 | 1.08mi |
| 3388 N 27th St Unit 3388 Front House Milwaukee, WI | 4.0 | 1.0 | 1212 | $1,550 | $1.28 | 4d | 1 | 1.11mi |
| 3630 W Nash St Milwaukee, WI | 2.0 | 1.0 | 1000 | $1,200 | $1.20 | 23d | 1 | 1.16mi |
| 3347 N 29th St Unit 3347A Milwaukee, WI | 2.0 | 1.0 | 950 | $845 | $0.89 | 14d | 1 | 1.20mi |
| 5237 N 34th St Unit 5237 Lower Milwaukee, WI | 2.0 | 1.0 | 956 | $1,350 | $1.41 | 23d | 1 | 1.23mi |
| 3925 N 42nd St Milwaukee, WI | 3.0 | 1.0 | 1300 | $1,675 | $1.29 | 43d | 1 | 1.24mi |
| 3925 N 42nd St Milwaukee, WI | 2.0 | 1.0 | 985 | $1,400 | $1.42 | 23d | 1 | 1.24mi |
| 4479A N 44th St Milwaukee, WI | 2.0 | 1.0 | 1000 | $895 | $0.90 | 43d | 1 | 1.25mi |
| 4702 N 44th St Milwaukee, WI | 3.0 | 2.0 | 1050 | $1,850 | $1.76 | 43d | 1 | 1.26mi |
| 2821 W Concordia Ave Milwaukee, WI | 3.0 | 1.5 | 1098 | $1,595 | $1.45 | 1d | 1 | 1.27mi |
| 3416 N 17th St Unit 1 Milwaukee, WI | 3.0 | 1.0 | 1200 | $1,100 | $0.92 | 43d | 1 | 1.29mi |
| 3890 N Sherman Blvd Milwaukee, WI | 2.0 | 1.0 | 950 | $1,100 | $1.16 | 12d | 1 | 1.31mi |
| 4048 N 7th St Milwaukee, WI | 2.0 | 1.0 | 1100 | $1,150 | $1.05 | 23d | 1 | 1.32mi |
| 4703 N 45th St Milwaukee, WI | 3.0 | 1.0 | 1031 | $1,695 | $1.64 | 23d | 1 | 1.35mi |
| 3606 N 41st St Unit 3608 Milwaukee, WI | 2.0 | 1.0 | 1095 | $975 | $0.89 | 43d | 1 | 1.38mi |
| 4727 N 46th St Milwaukee, WI | 3.0 | 1.0 | 936 | $1,700 | $1.82 | 43d | 1 | 1.42mi |
| 3908 N 6th St Milwaukee, WI | 2.0 | 1.0 | 1100 | $1,150 | $1.05 | 23d | 1 | 1.43mi |
Listing history 3 events
-
2026-06-01status $70,000 Pending 4 DOM
-
2026-05-31days on market $70,000 Active 4 DOM
-
2026-05-24historical $70,000
ⓘ Source: listings_history table (triggers on properties + properties_extension) + one-shot
backfill from property_details.listing_events for pre-trigger history.
Tax reassessment forecast WI · Partial reset (capped growth)
- Current annual tax
- $937 · $78/mo
- Projected year-2 tax
- $1,116 · $93/mo
- Expected delta
- +$179/yr (+$15/mo · 19.1%)
ⓘ Screening estimate from a state-policy table — verify with the county assessor before closing.
Climate risk First Street
- Flood 1/10 Low FEMA zone X (unshaded) · 0% chance over 30 yrs
- Wildfire 1/10 Low
- Heat 2/10 Low 7 d/yr ≥98°F today · 13 d/yr by 30 yrs out
- Wind 2/10 Low
- Air quality 3/10 Moderate 3 unhealthy d/yr today · 4 by 30 yrs out
Nearby sold comps map
Loading sold comps map…
Walkable amenities ~0.75 mi
Loading nearby amenities…
Taxation est. · year 1
- Rental income
- $15,249
- − Mortgage interest
- −$3,921
- − Property taxes
- −$937
- − Insurance
- −$350
- − Repairs & maintenance
- −$1,220
- − Management
- −$1,220
- − Depreciation
- −$2,036
- Taxable income
- $5,564
- Est. tax owed @ 24.0%
- −$1,335
- After-tax cash flow
- $5,019/yr
For passive investors: Depreciation is non-cash, so a rental often shows a tax loss while cash-flowing — sheltering income. Rental losses are passive: they offset passive income freely, and up to $25,000/yr can offset ordinary (W-2) income if you actively participate and your MAGI is under $100k (phasing out to $0 by $150k); unused losses carry forward. On sale, claimed depreciation is recaptured at up to 25%, and gains may owe capital-gains tax (a 1031 exchange can defer both). Figures are a year-1 estimate at your 24.0% rate — not tax advice; consult a CPA.
Schools (NCES district)
- District
- Milwaukee School District
- NCES district ID
- 5509600
- Math proficiency
- 10% ▼ -5.00%
- Reading proficiency
- 18% ▬ 0.00%
- Median HH income
- $36,339
- Composite
- 11.61/100
- National rank
- #9696
- State rank
- #337 of 342 in WI
Livability — Milwaukee
- Score
- 81/100
- State rank
- #55
- US rank
- #1534
Category grades
Schools grade is shown separately in the Schools card above.
Census & demographics
- Census place
- Milwaukee, WI
- County
- Milwaukee County · 926,379 people
- City population
- 573,768
- Metro
- Milwaukee-Waukesha, WI
- Population (ZIP)
- 45,170
- Household income
- $48,486
- Rent vs Own
- Severe rent burden
- 3390.0
Population outlook (Milwaukee County) Hauer SSP2
- Today (2025)
- 995,758 people
- By 2030
- 1,009,124 · +1.3%
- By 2040
- 1,028,128 · +3.3%
- By 2050
- 1,040,066 · +4.4%
- By 2075
- 1,057,849 · +6.2%
- By 2100
- 1,039,774 · +4.4%
Race, ethnicity, and origin ACS 2023
- Neighborhood character
- Predominantly Black (66%)
- Race & ethnicity
- Black 66% White 22% Hispanic / Latino 5% Two or more races 5% Asian 2%
- Hispanic origin (detail)
- Mexican 2% Puerto Rican 3%
- Common ancestry
- Romanian 3% Portuguese 1% Iranian 1%
- Foreign-born
- 3% · Canada
- Languages at home
- 92% English-only · Spanish 4% Other Asian/Pacific 1% Russian/Polish/Slavic 1%
Political lean MEDSL · Milwaukee
- 2024 margin
- Solid D (+38.5) · D 68.3% · R 29.8% · Other 1.8%
- 2008→2024 swing
- +2.7pp toward D · 2008: 35.9pp · 2024: 38.5pp
- All cycles
- 2024: D+38.5 2020: D+39.9 2016: D+37.5 2012: D+34.6 2008: D+35.9
Not yet ingested
- Civics
- —
Market trends
- HPI YoY
- ▼ -194.98%
- Current HPI
- 172.4275
- Rent YoY
- ▲ 8.61%
- Metro
- Milwaukee-Waukesha, WI
- State GDP YoY
- ▲ 2.10%
- F500 in state
- 20
Industry mix (Fortune 500 HQ in WI)
| Industry | F500 HQs | Revenue |
|---|---|---|
| Industrial Machinery | 4 | $23B |
|
||
| Industrial Technology | 2 | $36B |
|
||
| Insurance | 1 | $36B |
|
||
| Professional Services | 1 | $19B |
|
||
| Utilities | 1 | $9B |
|
||
| Consumer Goods | 1 | $3B |
|
||
Price history
1 event — show timeline
- 2026-05-24 Coming Soon $70,000 METROMLS
Property tax history
-5.7%/yrLatest (2024): $937 · +24.8% YoY. Source: county tax records.
Cash-flow waterfall
monthlySold comps — $/sqft
last 12 mo · ≤1 miLoading sold comps…