 Multi-family
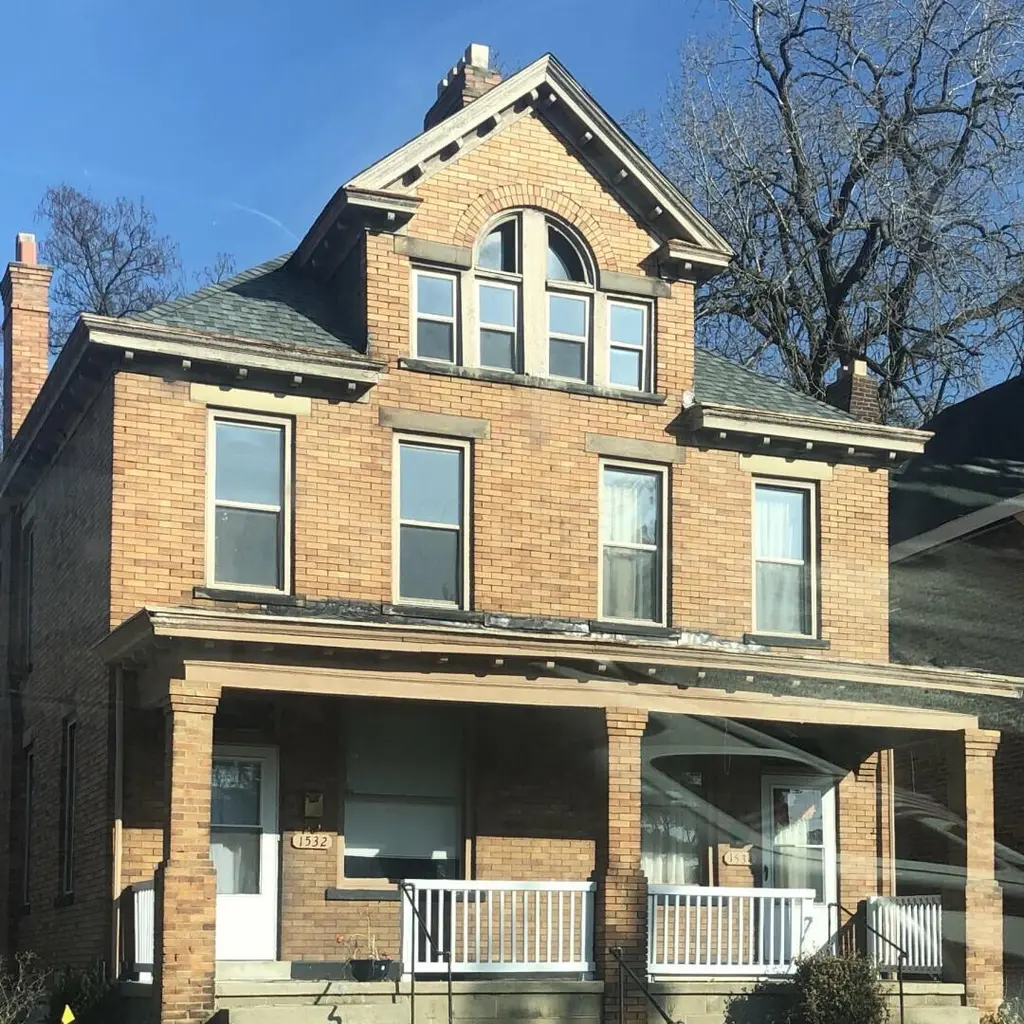
1532 Clifton Ave · Columbus, OH
Flood risk 1/10 · Minimal
- FEMA flood zone
- X (unshaded)
- Chance of flooding over 30 yrs
- 0.0%
- Est. flood insurance / yr
- $473 – $860
Fire risk 1/10 · Minimal
- Est. fire insurance / yr
- $713 – $1,323
Heat risk 4/10 · Minor
- Hot days now (above 100°F)
- 7 days/yr
- Hot days in 30 yrs
- 18 days/yr
Wind risk 2/10 · Minimal
- Chance of severe wind over 30 yrs
- 1.0%
Air-quality risk 3/10 · Minor
- Unhealthy air days now
- 2 days/yr
- Unhealthy air days in 30 yrs
- 4 days/yr
Risk factors via First Street. Map © Google.
Why this score? — see what drove the C+ grade
The composite is a weighted blend of 9 inputs, each scored 0–100. Each bar is that input's sub-score; the figure is the points it added to the 100-point composite (weight × sub-score).
- Cash flow +21.5/30.0
- ARV discount +15.0/15.0
- DSCR +6.9/10.0
- 1% rule +5.6/10.0
- Livability +4.0/5.0
- Rent growth +3.8/5.0
- Condition / age +2.2/5.0
- Schools +1.7/10.0
- Appreciation +0.0/10.0
$289,000
🖨 Deal sheet 📄 Offer letter ✓ Due diligence
Multi-family units
County records classify this as Multi-Family (2-4 Unit). Listing-text estimate: 1 unit. estimate disagrees with records
Listing remarks
This property would make a great owner-occupant opportunity, investment property, or could potentially be sold as condominiums. This charming property located at 1532 & 1534 Clifton Ave, Columbus, OH is a historic gem built in 1919. The home type is a Double (side by side town homes) with 2 bedrooms 2 full bathrooms and 2 half bathrooms in each unit. The total space is 2,688 sq ft. One side has been renovated, and currently rented. The other side is vacant and needs a total cosmetic renovation. The Property is being sold As Is.
Key facts
- Historic gem
- Renovated
- Investment property
Tags
Property features AI
Exterior
- Utilities: Public water; Public sewer
- Home design: Duplex; Built in 1919
- Exterior features: Additional parcel(s) included
Interior
- Bedrooms: 2 total units (duplex)
- Heating & cooling: Forced air heating; Central cooling
- Interior features: Forced air heating; Central cooling
Neighborhood map
What this means for you Summary
Snapshot
- This is a 4-bed/?-bath multifamily listed at $289k. Condition is rated fair.
Deal economics
- At list price, monthly cash flow is $433 ($5k/yr) — positive.
- The deal already cash-flows at list — no discount required.
- Meets the 1% rule at list price ($3k rent vs $289k).
- Cap rate 8.1% vs local median 3.8% in Columbus — top-decile yield for the area; either an underpriced asset or a hidden risk that comps aren't pricing in. Stress-test before assuming the spread holds.
Location & tenants
- Location reads 81/100 on livability (#97 in OH, #1,491 nationally) — a professional / high-income tenant draw. Strengths: commute A+, cost of living A+, housing A+; Watch: employment C-, crime F.
- Columbus City School District (urban): math 15% / reading 26% proficiency, ranked #626 of 656 in OH (top 95%) — low school quality limits family demand, transient renter base, plan for 1-2y turnover; 72% free/reduced lunch — lower-income household profile, screen leases tightly.
- Market conditions: Rents rising fast (+5.0%/yr); 94 active listings in the ZIP; 22 comparable units currently listed for rent nearby; rentals at typical pace (median 16d on market — plan ~3-4 weeks tenant-placement turnaround); 8,139 units permitted in Franklin County in 2024 (5,940 in 5+ unit buildings).
- At $3,076/mo this rent would consume 78% of the median local household income ($48k/yr) (locally 859% of renters already pay >50% of income on rent) — very limited rent-growth headroom before tenants either downsize or default.
Forward outlook
- Local home prices are declining (-3.0%/yr); year-one equity from $2k of loan paydown is wiped out by about $9k of value loss. Plan a longer hold.
- Franklin County population projected at +34% by 2050 — long-run rental-demand tailwind backs the buy-and-hold thesis.
Negotiation context
- Only 5 days on market — expect competitive offers; lowballing is unlikely to land.
Risks & watch-outs
- Watch-outs: built in 1919 — expect roof / HVAC / electrical / plumbing capex.
Questions for the listing agent
- Have any recent inspections been done? Can we get a copy of the seller's disclosures and any deferred-maintenance estimates?
- Built in 1919 — when were the roof, HVAC, electrical panel, plumbing, and water heater last replaced?
- Is there a deadline driving the sale (1031 exchange, divorce, estate, relocation)? That informs how much negotiation room exists.
- Crime grade is F in this area — have there been break-ins, vandalism, or insurance claims at this property in the last 3 years? What carrier currently insures it and at what premium?
- What's the average days-on-market for RENTAL listings here right now (not sales)? A rising rental-DOM trend means longer vacancies and softer asking-rent achievability than the comps imply.
- What's the recent tenant-quality profile in this submarket — average credit score on applications, eviction rate, late-payment / NSF rate, and stable-employment percentage? A property-management company in the area should have these aggregated.
- How much new apartment / multifamily construction is in the pipeline within 1–3 miles? Heavy new supply (>2% of stock underway) typically softens rents 12–24 months out; light construction supports rent growth.
Investment metrics
- 1% rule
- 1.06% ✓
- Cap rate
- 8.09%
- Cash-on-cash
- 6.42%
- DSCR
- 1.29
- GRM
- 7.8
CMA / ARV
- ARV (median comp)
- $358,344
- List price
- $289,000
- Delta
- -19.35%
- Verdict
- UNDERPRICED
- Comps
- 20 within 1.0 mi
Show comp detail 4 sales within ~0.75 mi
| Address | Dist | Beds/Ba | Sqft | Sold | Price | $/sf | Match |
|---|---|---|---|---|---|---|---|
| 241 Taylor Ave #243 | 0.06mi | 4/— | 2,415 (-10%) | 6mo | $525,000 | $217 | 75 |
| 1461 Mount Vernon Ave | 0.20mi | 4/— | 3,072 (+14%) | 20mo | $230,000 | $75 | 50 |
| 1669-1671 Oak St | 0.72mi | 4/— | 2,424 (-10%) | 6mo | $505,000 | $208 | 45 |
| 1252-1254 Eastwood Ave | 0.44mi | 5/— (+1) | 3,024 (+12%) | 14mo | $431,000 | $143 | 42 |
Match score weights: distance 35% · size 25% · config 20% · recency 20%. Top-matched comps best support the ARV.
Projected returns pro-forma
-3.0% appreciation · 5.03% rent growth · sell at horizon
- IRR
- -4.1%
- Equity multiple
- 0.84×
- Total profit
- $-12,807
- Equity at exit
- $43,091
- IRR
- 7.8%
- Equity multiple
- 1.64×
- Total profit
- $51,951
- Equity at exit
- $24,987
Cash invested: $80,920 (down + closing). Projections, not guarantees.
Landlord ↔ Tenant lean methodology
- Overall (STATE)
- 73 Landlord-Friendly
- State Ohio
- 73 Landlord-Friendly · R+6
- County
- — inherits STATE
- City
- — inherits STATE
ZIP-level market 43203
- Home prices YoY
- -31.9%
- Rents YoY
- 5.0%
- Active inventory
- 94
- Price-to-rent
- 15.7×
Monthly cashflow live
- Estimated rent
- $3,076 high interval (Pro) →
- Mortgage (P&I)
- −$1,516
- Tax est. 1.5%
- −$361 /mo · $4,335/yr
- Insurance
- −$120
- HOA
- −$0
- Vacancy / Maint / Mgmt
- −$646
- Net cashflow
- $433
Break-even live
2-unit breakdown (identical units grouped — click to expand)
| Units | Beds | Baths | Est. rent |
|---|---|---|---|
| 2× units | 2 | 2.5 | $3,076 |
| #1 | 2 | 2.5 | $1,538 |
| #2 | 2 | 2.5 | $1,538 |
| Total (2 units) | $3,076 | ||
UW: 25.0% down · 7.5% · 30yr · 1.5% tax · 5.0% vac · 8.0% maint · 8.0% mgmt
Financing live
Cash to close
- Down payment
- $72,250
- Closing costs
- $8,670
- Reserves months
- —
- Total cash needed
- —
Loan-product check · same deal, 3 products live
Conventional
25% down · 7.5% · 30yr
- Down + closing
- —
- Monthly P&I
- —
- Monthly cashflow
- —
- DSCR
- —
- Eligible?
- —
Personal DTI + credit; lowest rate.
DSCR
20% down · 8.5% · 30yr
- Down + closing
- —
- Monthly P&I
- —
- Monthly cashflow
- —
- DSCR
- —
- Eligible?
- —
No personal income docs; deal must DSCR.
Hard money
10% down · 12.0% · 12mo
- Down + closing
- —
- Monthly P&I
- —
- Monthly cashflow
- —
- DSCR
- —
- Eligible?
- —
Short-term bridge; refi at stabilization.
Rent comps 22 comps
| Address | Beds | Baths | Sqft | Rent | $/sqft | DOM | Units | Dist |
|---|---|---|---|---|---|---|---|---|
| 286 Taylor Ave Unit 1496096P Columbus, OH | 3.0 | 2.5 | 1894 | $7,586 | $4.01 | 1d | 1 | 0.13mi |
| 1445 E Broad St Columbus, OH | 1.0–5.0 | 1.0–5.0 | 2164 | $2,835 | $1.31 | 1d | 4 | 0.37mi |
| 78 Auburn Ave Columbus, OH | 5.0 | 3.5 | 2799 | $3,950 | $1.41 | 1d | 1 | 0.42mi |
| 1438 Fair Ave Unit 1438 Columbus, OH | 3.0 | 2.5 | 1800 | $2,550 | $1.42 | 1d | 1 | 0.50mi |
| 1402 Fair Ave Columbus, OH | 3.0 | 2.5 | 2563 | $2,350 | $0.92 | 16d | 1 | 0.50mi |
| 1214 Atcheson St #1216 Columbus, OH | 3.0 | 1.5 | 2613 | $1,600 | $0.61 | 43d | 1 | 0.55mi |
| 1756 Oak St Columbus, OH | 4.0 | 2.0 | 2425 | $5,200 | $2.14 | 1d | 1 | 0.73mi |
| 1479-1481 Bryden Rd Columbus, OH | 4.0 | 1.5 | 2604 | $1,750 | $0.67 | 43d | 1 | 0.75mi |
| 1702 Bryden Rd #1704 Columbus, OH | 3.0 | 2.5 | 2000 | $2,300 | $1.15 | 17d | 1 | 0.81mi |
| 382 Morrison Ave Columbus, OH | 4.0 | 1.5 | 2027 | $2,500 | $1.23 | 2d | 1 | 0.87mi |
| 417 Morrison Ave Columbus, OH | 4.0 | 1.5 | 3348 | $2,000 | $0.60 | 10d | 1 | 0.91mi |
| 368 N Garfield Ave Unit 370 Columbus, OH | 3.0 | 2.0 | 3612 | $2,000 | $0.55 | 3d | 1 | 0.97mi |
| 387-393 Saint Clair Ave Unit 387 Saint Clair Columbus, OH | 3.0 | 1.0 | 2000 | $1,325 | $0.66 | 7d | 1 | 1.07mi |
| 965 E Rich St Unit 965 Columbus, OH | 3.0 | 1.0 | 2184 | $1,600 | $0.73 | 23d | 1 | 1.07mi |
| 173 S 18th St Columbus, OH | 3.0 | 2.5 | 1884 | $2,649 | $1.41 | 23d | 1 | 1.08mi |
| 533 Fairwood Ave Columbus, OH | 4.0 | 2.0 | 2410 | $2,475 | $1.03 | 43d | 1 | 1.10mi |
| 438 S Ohio Ave Columbus, OH | 5.0 | 2.0 | 1900 | $2,195 | $1.16 | 43d | 1 | 1.13mi |
| 747 Malvern Ave Columbus, OH | 3.0 | 2.5 | 2146 | $2,295 | $1.07 | 43d | 1 | 1.21mi |
| 703 Franklin Ave Columbus, OH | 4.0 | 3.5 | 3250 | $4,995 | $1.54 | 23d | 1 | 1.25mi |
| 122 Parsons Ave Columbus, OH | 3.0 | 1.0–2.0 | 1135 | $2,550 | $2.25 | 1d | 10 | 1.27mi |
| 627 Oakwood Ave Columbus, OH | 3.0 | 2.5 | 2009 | $2,379 | $1.18 | 12d | 1 | 1.33mi |
| 683 S Champion Ave Unit 683 Columbus, OH | 3.0 | 1.0 | 2728 | $1,700 | $0.62 | 43d | 1 | 1.44mi |
Listing history 2 events
-
2026-05-16status Pending 539-char remark
-
2026-05-11$289,000 Active 539-char remark
ⓘ Source: listings_history table (triggers on properties + properties_extension) + one-shot
backfill from property_details.listing_events for pre-trigger history.
Climate risk First Street
- Flood 1/10 Low FEMA zone X (unshaded) · 0% chance over 30 yrs
- Wildfire 1/10 Low
- Heat 4/10 Moderate 7 d/yr ≥100°F today · 18 d/yr by 30 yrs out
- Wind 2/10 Low 100% chance of damaging wind over 30 yrs
- Air quality 3/10 Moderate 2 unhealthy d/yr today · 4 by 30 yrs out
Nearby sold comps map
Loading sold comps map…
Walkable amenities ~0.75 mi
Loading nearby amenities…
Taxation est. · year 1
- Rental income
- $36,912
- − Mortgage interest
- −$16,188
- − Property taxes
- −$4,335
- − Insurance
- −$1,445
- − Repairs & maintenance
- −$2,953
- − Management
- −$2,953
- − Depreciation
- −$8,407
- Taxable income
- $630
- Est. tax owed @ 24.0%
- −$151
- After-tax cash flow
- $5,043/yr
For passive investors: Depreciation is non-cash, so a rental often shows a tax loss while cash-flowing — sheltering income. Rental losses are passive: they offset passive income freely, and up to $25,000/yr can offset ordinary (W-2) income if you actively participate and your MAGI is under $100k (phasing out to $0 by $150k); unused losses carry forward. On sale, claimed depreciation is recaptured at up to 25%, and gains may owe capital-gains tax (a 1031 exchange can defer both). Figures are a year-1 estimate at your 24.0% rate — not tax advice; consult a CPA.
Condition & rehab AI · 18 photos
This property requires moderate renovations to improve its condition and value. The kitchen and bathrooms need significant updates, while the rest of the home is in good condition.
Repairs flagged
- Moderate Kitchen cabinets — Worn appearance
- Major Bathroom tiles — Dirty and old appearance
- Minor Kitchen countertops — Need cleaning
Value-add opportunities
- Both Paint interior walls — Fresh paint enhances curb appeal and interior aesthetics
- Both Replace kitchen cabinets — New cabinets improve functionality and aesthetics
- Both Replace bathroom tiles — New tiles improve functionality and aesthetics
- Both Replace kitchen countertops — New countertops improve functionality and aesthetics
Renovation cost estimate screening
| Repair item | Severity | Est. cost |
|---|---|---|
| Kitchen cabinets · Worn appearance | Moderate | $3,000–15,000 |
| Bathroom tiles · Dirty and old appearance | Major | $15,000–50,000 |
| Kitchen countertops · Need cleaning | Minor | $500–3,000 |
| Total estimated repair cost · 3 items | $18,500–68,000 |
Value-add ROI direction
- Both Paint interior walls — Fresh paint enhances curb appeal and interior aesthetics ↑
- Both Replace kitchen cabinets — New cabinets improve functionality and aesthetics ↑
- Both Replace bathroom tiles — New tiles improve functionality and aesthetics ↑
- Both Replace kitchen countertops — New countertops improve functionality and aesthetics ↑
ⓘ Cost ranges are severity-bucket heuristics (US national rule-of-thumb). Get contractor quotes + a written scope before underwriting a rehab budget.
Schools (NCES district)
- District
- Columbus City School District
- NCES district ID
- 3904380
- Math proficiency
- 15% ▼ -17.00%
- Reading proficiency
- 26% ▼ -12.00%
- Median HH income
- $38,483
- Composite
- 17.19/100
- National rank
- #9105
- State rank
- #626 of 656 in OH
Livability — Columbus
- Score
- 81/100
- State rank
- #97
- US rank
- #1491
Category grades
Schools grade is shown separately in the Schools card above.
Census & demographics
- Census place
- Columbus, OH
- County
- Franklin County · 1,351,780 people
- City population
- 612,189
- Metro
- Columbus, OH
- Population (ZIP)
- 8,618
- Household income
- $47,572
- Rent vs Own
- Severe rent burden
- 859.0
Population outlook (Franklin County) Hauer SSP2
- Today (2025)
- 1,456,139 people
- By 2030
- 1,556,890 · +6.9%
- By 2040
- 1,757,349 · +20.7%
- By 2050
- 1,950,539 · +34.0%
- By 2075
- 2,376,171 · +63.2%
- By 2100
- 2,636,796 · +81.1%
Race, ethnicity, and origin ACS 2023
- Neighborhood character
- Diverse neighborhood (Simpson 0.56)
- Race & ethnicity
- Black 59% White 29% Two or more races 8% Hispanic / Latino 2% Asian 2%
- Common ancestry
- Lithuanian 1% Romanian 1% Swiss 1%
- Foreign-born
- 12% · Canada
- Languages at home
- 86% English-only · Other Indo-European 1% Spanish 1% French/Haitian/Cajun 1%
Political lean MEDSL · Franklin
- 2024 margin
- Strong D (+28.4) · D 63.7% · R 35.3% · Other 1.0%
- 2008→2024 swing
- +7.7pp toward D · 2008: 20.7pp · 2024: 28.4pp
- All cycles
- 2024: D+28.4 2020: D+31.4 2016: D+25.9 2012: D+21.7 2008: D+20.7
Not yet ingested
- Civics
- —
Market trends
- HPI YoY
- ▼ -102.09%
- Current HPI
- 217.3929
- Rent YoY
- ▲ 5.03%
- Metro
- Columbus, OH
- State GDP YoY
- ▲ 1.98%
- F500 in state
- 48
Industry mix (Fortune 500 HQ in OH)
| Industry | F500 HQs | Revenue |
|---|---|---|
| Insurance | 3 | $145B |
|
||
| Industrial Machinery | 3 | $49B |
|
||
| Financial Services | 3 | $24B |
|
||
| Consumer Goods | 2 | $93B |
|
||
| Aerospace / Defense | 2 | $47B |
|
||
| Utilities | 2 | $33B |
|
||
Price history
2 events — show timeline
- 2026-05-16 Pending — CBRMLS
- 2026-05-11 Listed $289,000 CBRMLS
Cash-flow waterfall
monthlySold comps — $/sqft
last 12 mo · ≤1 miLoading sold comps…