4306 11th St SW · Lehigh Acres, FL
Flood risk 1/10 · Minimal
- FEMA flood zone
- X (unshaded)
- Chance of flooding over 30 yrs
- 0.0%
- Est. flood insurance / yr
- $507 – $1,088
Fire risk 2/10 · Minimal
- Est. fire insurance / yr
- $947 – $1,759
Heat risk 10/10 · Severe
- Hot days now (above 107°F)
- 7 days/yr
- Hot days in 30 yrs
- 29 days/yr
Wind risk 10/10 · Severe
- Chance of severe wind over 30 yrs
- 99.0%
Air-quality risk 2/10 · Minimal
- Unhealthy air days now
- 1 days/yr
- Unhealthy air days in 30 yrs
- 1 days/yr
Risk factors via First Street. Map © Google.
Why this score? — see what drove the C grade
The composite is a weighted blend of 9 inputs, each scored 0–100. Each bar is that input's sub-score; the figure is the points it added to the 100-point composite (weight × sub-score).
- ARV discount +15.0/15.0
- Cash flow +13.0/30.0
- Appreciation +10.0/10.0
- Schools +4.1/10.0
- DSCR +3.9/10.0
- 1% rule +3.5/10.0
- Livability +3.0/5.0
- Condition / age +2.5/5.0
- Rent growth +2.1/5.0
$215,000
🖨 Deal sheet 📄 Offer letter ✓ Due diligence
Listing remarks MLS
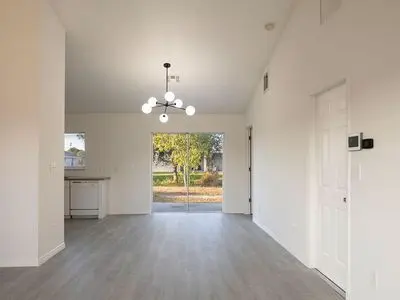
Charming 3-bedroom, 2-bath home situated on a generous lot, offering endless potential. Features include a spacious master bedroom and a functional layout ideal for customization. While the property does require some repairs and TLC, it presents a fantastic opportunity for investors or buyers looking to add personal touches and build equity.
Key facts
- Built 2004
- Listed 25 days
Property features AI
Finance
- Other: No other notable details available
- Financial info: No financial details available
- HOA & community: No HOA or community details available
Exterior
- Parking: No parking details available
- Security: No security details available
- Utilities: No utility details available
- Home design: Built in 2004; Single-family property
- Construction: Living area of 1,161; No additional construction details available
- Exterior features: Located in the Sunshine subdivision
Interior
- Kitchen: No kitchen details available
- Bedrooms: No bedroom details available
- Flooring: No flooring details available
- Bathrooms: No bathroom details available
- Heating & cooling: No heating or cooling details available
- Interior features: No interior feature details available
- Laundry & utility: No laundry or utility details available
Neighborhood map
What this means for you Summary
Snapshot
- This is a 3-bed/2.0-bath single-family listed at $215k.
Deal economics
- At list price, monthly cash flow is $-12 ($-144/yr) — negative.
- To cash-flow at today's rent, offer at most $213k (1.0% below list).
- To meet the 1% rule (rent ≥ 1% of price), the offer needs to be $183k (14.8% below list).
- Recommended offer: $183k (14.8% below list) — sets the bar for 1% rule.
- Cap rate 6.2% vs local median 4.7% in Lehigh Acres — top-decile yield for the area; either an underpriced asset or a hidden risk that comps aren't pricing in. Stress-test before assuming the spread holds.
Location & tenants
- Location reads 59/100 on livability (#826 in FL) — a working-class tenant base; expect higher turnover. Strengths: cost of living A+, housing A+; Watch: crime C-, employment D+, schools D-.
- Lee (suburban): math 47% / reading 50% proficiency, ranked #42 of 73 in FL (top 58%) — families likely to look elsewhere, expect single-tenant / working-renter base with shorter leases.
- Market conditions: Rents soft (-1.5%/yr); 786 active listings in the ZIP; 40 comparable units currently listed for rent nearby; rentals at typical pace (median 24d on market — plan ~3-4 weeks tenant-placement turnaround); 15,411 units permitted in Lee County in 2024 (4,686 in 5+ unit buildings).
- This rent runs 30% of the median local income ($73k/yr) — at the standard rent-burdened threshold; future hikes will face affordability resistance.
Forward outlook
- In year one you build about $23k of equity ($1k loan paydown + $22k appreciation (10.0% local appreciation)).
- Lee County population projected at +44% by 2050 — long-run rental-demand tailwind backs the buy-and-hold thesis.
- At projected returns (10.0% appreciation + 0.0% rent growth), your $60k cash investment doubles in ~3 years — after that, you're playing with house money.
- By year 2, paydown + projected appreciation supports a ~$37k cash-out refi (75% LTV) — recoverable capital for the next deal without selling this one.
Negotiation context
- It's been on market 25 days — a 2% lower offer ($212k) is reasonable based on typical stale-listing flexibility.
- 5 sale attempts since 5y ago with the ask held roughly flat each time — persistent listings suggest the price (not the market) is what's stuck; bring a comps-based counter.
- Current owner paid $185k; 16% above their basis — modest negotiation headroom, anchor on the comps not their cost.
Risks & watch-outs
- Climate carrying-cost: severe wind risk, 99% chance of damaging wind over 30y; extreme-heat days projected 7→29/yr by 2055 (HVAC capex compounding) — expect insurance premiums to compound above CPI over the hold.
Questions for the listing agent
- What do current leases actually rent for vs. the listed asking? Can we see a recent rent roll and the last 12 months of T-12 income?
- Is there a deadline driving the sale (1031 exchange, divorce, estate, relocation)? That informs how much negotiation room exists.
- Schools are D-rated, which usually means shorter tenancies and higher turnover. Who's the typical renter profile here, and what's been the actual vacancy rate?
- What's the average days-on-market for RENTAL listings here right now (not sales)? A rising rental-DOM trend means longer vacancies and softer asking-rent achievability than the comps imply.
- What's the recent tenant-quality profile in this submarket — average credit score on applications, eviction rate, late-payment / NSF rate, and stable-employment percentage? A property-management company in the area should have these aggregated.
- How much new for-sale + rental construction is in the pipeline within 1–3 miles? Heavy new supply typically softens prices + rents 12–24 months out; constrained supply supports both.
Investment metrics
- 1% rule
- 0.85% ✗
- Cap rate
- 6.23%
- Cash-on-cash
- -0.24%
- DSCR
- 0.99
- GRM
- 9.8
CMA / ARV
- ARV (on-the-fly)
- $285,606
- Comps found
- 6
Show comp detail 6 sales within ~0.75 mi
| Address | Dist | Beds/Ba | Sqft | Sold | Price | $/sf | Match |
|---|---|---|---|---|---|---|---|
| 812 Floyd Ave S | 0.11mi | 3/2.0 | 1,247 (+7%) | 22mo | $277,000 | $222 | 64 |
| 4015 12th St SW | 0.44mi | 3/3.0 | 1,057 (-9%) | 3mo | $260,000 | $246 | 58 |
| 4208 17th St SW | 0.44mi | 3/2.0 | 1,272 (+10%) | 19mo | $275,000 | $216 | 47 |
| 3914 13th St SW | 0.61mi | 3/2.0 | 1,118 (-4%) | 23mo | $290,000 | $259 | 46 |
| 3913 16th St W | 0.72mi | 3/2.0 | 1,328 (+14%) | 1mo | $279,999 | $211 | 42 |
| 4012 19th St SW | 0.70mi | 3/2.0 | 1,240 (+7%) | 23mo | $305,000 | $246 | 37 |
Match score weights: distance 35% · size 25% · config 20% · recency 20%. Top-matched comps best support the ARV.
Projected returns pro-forma
10.0% appreciation · 0.0% rent growth · sell at horizon
- IRR
- 23.1%
- Equity multiple
- 2.84×
- Total profit
- $110,977
- Equity at exit
- $193,689
- IRR
- 20.0%
- Equity multiple
- 6.28×
- Total profit
- $317,820
- Equity at exit
- $417,698
Cash invested: $60,200 (down + closing). Projections, not guarantees.
Landlord ↔ Tenant lean methodology
- Overall (STATE)
- 87 Strongly Landlord-Friendly
- State Florida
- 87 Strongly Landlord-Friendly · R+3
- County
- — inherits STATE
- City
- — inherits STATE
ZIP-level market 33976
- Home prices YoY
- 6.8%
- Rents YoY
- -1.5%
- Active inventory
- 786
- Price-to-rent
- 9.8×
Monthly cashflow live
- Estimated rent
- $1,831 high interval (Pro) →
- Mortgage (P&I)
- −$1,127
- Tax from tax record
- −$242 /mo · $2,899/yr
- Insurance
- −$90
- HOA
- −$0
- Vacancy / Maint / Mgmt
- −$385
- Net cashflow
- $-12
Break-even live
UW: 25.0% down · 7.5% · 30yr · 1.5% tax · 5.0% vac · 8.0% maint · 8.0% mgmt
Financing live
Cash to close
- Down payment
- $53,750
- Closing costs
- $6,450
- Reserves months
- —
- Total cash needed
- —
Loan-product check · same deal, 3 products live
Conventional
25% down · 7.5% · 30yr
- Down + closing
- —
- Monthly P&I
- —
- Monthly cashflow
- —
- DSCR
- —
- Eligible?
- —
Personal DTI + credit; lowest rate.
DSCR
20% down · 8.5% · 30yr
- Down + closing
- —
- Monthly P&I
- —
- Monthly cashflow
- —
- DSCR
- —
- Eligible?
- —
No personal income docs; deal must DSCR.
Hard money
10% down · 12.0% · 12mo
- Down + closing
- —
- Monthly P&I
- —
- Monthly cashflow
- —
- DSCR
- —
- Eligible?
- —
Short-term bridge; refi at stabilization.
Rent comps 40 comps
| Address | Beds | Baths | Sqft | Rent | $/sqft | DOM | Units | Dist |
|---|---|---|---|---|---|---|---|---|
| 4218 8th St SW Lehigh Acres, FL | 3.0 | 2.0 | 1408 | $1,800 | $1.28 | 23d | 1 | 0.18mi |
| 610 Floyd Ave S Lehigh Acres, FL | 3.0 | 2.0 | 1400 | $2,100 | $1.50 | 23d | 1 | 0.24mi |
| 1117 Gordon Ave S Lehigh Acres, FL | 3.0 | 2.0 | 1170 | $1,750 | $1.50 | 21d | 1 | 0.31mi |
| 1105 Harold Ave S Lehigh Acres, FL | 3.0 | 2.0 | 988 | $1,250 | $1.27 | 23d | 1 | 0.36mi |
| 704 Gilbert Ave S Lehigh Acres, FL | 3.0 | 2.0 | 1203 | $1,475 | $1.23 | 19d | 1 | 0.36mi |
| 716 Gordon Ave S Lehigh Acres, FL | 3.0 | 2.0 | 1175 | $1,595 | $1.36 | 3d | 1 | 0.37mi |
| 1502 Gretchen Ave S Lehigh Acres, FL | 3.0 | 2.0 | 1270 | $2,000 | $1.57 | 3d | 1 | 0.39mi |
| 745 Harry Ave S Lehigh Acres, FL | 3.0 | 2.0 | 1200 | $1,699 | $1.42 | 10d | 1 | 0.41mi |
| 1113 Harry Ave S Lehigh Acres, FL | 2.0 | 2.0 | 1180 | $1,646 | $1.39 | 3d | 1 | 0.42mi |
| 729 Harry Ave S Lehigh Acres, FL | 3.0 | 2.0 | 1125 | $1,500 | $1.33 | 23d | 1 | 0.43mi |
| 4503 15th St SW Lehigh Acres, FL | 3.0 | 2.0 | 1200 | $1,800 | $1.50 | 23d | 1 | 0.46mi |
| 1504 Gary Ln Lehigh Acres, FL | 3.0 | 2.0 | 1198 | $1,660 | $1.39 | 23d | 1 | 0.48mi |
| 1506 Gary Ln Lehigh Acres, FL | 3.0 | 2.0 | 1198 | $1,660 | $1.39 | 23d | 1 | 0.48mi |
| 4005 12th St SW Lehigh Acres, FL | 3.0 | 2.0 | 1122 | $1,610 | $1.43 | 19d | 1 | 0.49mi |
| 1110 Hightower Ave S Lehigh Acres, FL | 3.0 | 2.0 | 1227 | $1,325 | $1.08 | 23d | 1 | 0.52mi |
| 310 Gordon Ave S Lehigh Acres, FL | 2.0 | 2.0 | 1166 | $1,599 | $1.37 | 23d | 1 | 0.55mi |
| 310 Gordon Ave S Lehigh Acres, FL | 2.0 | 2.0 | 1166 | $1,599 | $1.37 | 3d | 1 | 0.55mi |
| 1509 Haviland Ave S Lehigh Acres, FL | 3.0 | 2.0 | 1200 | $1,550 | $1.29 | 23d | 1 | 0.56mi |
| 1511 Haviland Ave S Lehigh Acres, FL | 3.0 | 2.0 | 1200 | $1,550 | $1.29 | 23d | 1 | 0.56mi |
| 1544 Gretchen Ave S Lehigh Acres, FL | 2.0 | 2.0 | 1221 | $1,800 | $1.47 | 23d | 1 | 0.58mi |
| 305 Harold Ave S Lehigh Acres, FL | 3.0 | 2.0 | 1175 | $1,650 | $1.40 | 16d | 1 | 0.58mi |
| 320 Harry Ave S Lehigh Acres, FL | 3.0 | 2.0 | 1212 | $1,550 | $1.28 | 23d | 1 | 0.59mi |
| 142 Gordon Ave S Lehigh Acres, FL | 2.0 | 1.0 | 780 | $1,499 | $1.92 | 23d | 1 | 0.60mi |
| 227 Hightower Ave S Lehigh Acres, FL | 2.0 | 2.0 | 1200 | $1,600 | $1.33 | 23d | 1 | 0.66mi |
| 1113 Ivan Ave S Lehigh Acres, FL | 3.0 | 2.0 | 1190 | $1,800 | $1.51 | 11d | 1 | 0.66mi |
| 3818 7th St SW Lehigh Acres, FL | 3.0 | 2.0 | 1422 | $1,695 | $1.19 | 23d | 1 | 0.67mi |
| 142 Harry Ave S Lehigh Acres, FL | 2.0 | 1.0 | 780 | $1,100 | $1.41 | 3d | 1 | 0.68mi |
| 142 Harry Ave S Lehigh Acres, FL | 2.0 | 1.0 | 780 | $1,100 | $1.41 | 23d | 1 | 0.68mi |
| 122 Gordon Ave S Lehigh Acres, FL | 2.0 | 1.0 | 780 | $999 | $1.28 | 23d | 1 | 0.68mi |
| 136 Harry Ave S Lehigh Acres, FL | 3.0 | 2.0 | 1133 | $2,050 | $1.81 | 23d | 1 | 0.70mi |
| 3909 3rd St SW Lehigh Acres, FL | 2.0 | 1.0 | 852 | $2,250 | $2.64 | 23d | 1 | 0.70mi |
| 4507 20th St SW Lehigh Acres, FL | 2.0 | 2.0 | 1135 | $1,400 | $1.23 | 23d | 1 | 0.70mi |
| 1130 Ivan Ave S Lehigh Acres, FL | 3.0 | 2.0 | 1200 | $2,000 | $1.67 | 23d | 1 | 0.71mi |
| 4541 20th St SW Lehigh Acres, FL | 2.0 | 1.0 | 924 | $1,195 | $1.29 | 23d | 1 | 0.72mi |
| 210 Hightower Ave S Lehigh Acres, FL | 3.0 | 2.0 | 1181 | $1,295 | $1.10 | 21d | 1 | 0.72mi |
| 207 Hightower Ave S Lehigh Acres, FL | 2.0 | 2.0 | 1151 | $1,399 | $1.22 | 3d | 1 | 0.72mi |
| 4400 Douglas Ln Lehigh Acres, FL | 3.0 | 2.0 | 1172 | $1,500 | $1.28 | 19d | 1 | 0.74mi |
| 1114 Circle Dr Lehigh Acres, FL | 3.0 | 2.0 | 1193 | $1,750 | $1.47 | 23d | 1 | 0.76mi |
| 104 Gordon Ave S Lehigh Acres, FL | 3.0 | 2.0 | 1123 | $1,300 | $1.16 | 3d | 1 | 0.76mi |
| 104 Gordon Ave S Lehigh Acres, FL | 3.0 | 2.0 | 1123 | $1,350 | $1.20 | 23d | 1 | 0.76mi |
Listing history 26 events
-
2026-06-17days on market $215,000 Active 25 DOM
-
2026-06-16days on market $215,000 Active 24 DOM
-
2026-06-16days on market $215,000 Active 23 DOM
-
2026-06-13days on market $215,000 Active 21 DOM
-
2026-06-09days on market $215,000 Active 17 DOM
-
2026-06-07days on market $215,000 Active 15 DOM
-
2026-06-01days on market $215,000 Active 9 DOM
-
2026-06-01days on market $215,000 Active 8 DOM
-
2026-05-24$215,000 Active
-
2026-02-28historical $1,750
-
2026-02-20$1,750
-
2026-02-20historical $2,000
-
2026-02-04$2,000
-
2025-11-25soldstatus $185,000 Closed 343-char remark
Show marketing remark (343 chars)
Charming 3-bedroom, 2-bath home situated on a generous lot, offering endless potential. Features include a spacious master bedroom and a functional layout ideal for customization. While the property does require some repairs and TLC, it presents a fantastic opportunity for investors or buyers looking to add personal touches and build equity.
-
2025-11-12status Pending 343-char remark
Show marketing remark (343 chars)
Charming 3-bedroom, 2-bath home situated on a generous lot, offering endless potential. Features include a spacious master bedroom and a functional layout ideal for customization. While the property does require some repairs and TLC, it presents a fantastic opportunity for investors or buyers looking to add personal touches and build equity.
-
2025-10-10price $199,900 343-char remark
Show marketing remark (343 chars)
Charming 3-bedroom, 2-bath home situated on a generous lot, offering endless potential. Features include a spacious master bedroom and a functional layout ideal for customization. While the property does require some repairs and TLC, it presents a fantastic opportunity for investors or buyers looking to add personal touches and build equity.
-
2025-09-24price $210,000 343-char remark
Show marketing remark (343 chars)
Charming 3-bedroom, 2-bath home situated on a generous lot, offering endless potential. Features include a spacious master bedroom and a functional layout ideal for customization. While the property does require some repairs and TLC, it presents a fantastic opportunity for investors or buyers looking to add personal touches and build equity.
-
2025-08-07$239,900 Active 343-char remark
Show marketing remark (343 chars)
Charming 3-bedroom, 2-bath home situated on a generous lot, offering endless potential. Features include a spacious master bedroom and a functional layout ideal for customization. While the property does require some repairs and TLC, it presents a fantastic opportunity for investors or buyers looking to add personal touches and build equity.
-
2021-08-23soldstatus $165,000
-
2021-08-17soldstatus $165,000 Closed 115-char remark
Show marketing remark (115 chars)
Great 3 bed 2 bath home conveniently off of Gunnery Rd with easy access to major highway, and public transportatin.
-
2021-07-22historical 115-char remark
Show marketing remark (115 chars)
Great 3 bed 2 bath home conveniently off of Gunnery Rd with easy access to major highway, and public transportatin.
-
2021-07-13$165,000 115-char remark
Show marketing remark (115 chars)
Great 3 bed 2 bath home conveniently off of Gunnery Rd with easy access to major highway, and public transportatin.
-
2015-03-02price $39,900
-
2011-01-18soldstatus $44,000
-
2003-07-23soldstatus $4,000
-
1995-12-07soldstatus $2,000
ⓘ Source: listings_history table (triggers on properties + properties_extension) + one-shot
backfill from property_details.listing_events for pre-trigger history.
Tax reassessment forecast FL · Resets to sale price
- Current annual tax
- $2,899 · $242/mo
- Projected year-2 tax
- $2,899 · $242/mo
- Expected delta
- $0/yr ($0/mo · 0.0%)
ⓘ Screening estimate from a state-policy table — verify with the county assessor before closing.
Climate risk First Street
- Flood 1/10 Low FEMA zone X (unshaded) · 0% chance over 30 yrs
- Wildfire 2/10 Low
- Heat 10/10 Extreme 7 d/yr ≥107°F today · 29 d/yr by 30 yrs out
- Wind 10/10 Extreme 99% chance of damaging wind over 30 yrs
- Air quality 2/10 Low 1 unhealthy d/yr today · 1 by 30 yrs out
Nearby sold comps map
Loading sold comps map…
Walkable amenities ~0.75 mi
Loading nearby amenities…
Taxation est. · year 1
- Rental income
- $21,975
- − Mortgage interest
- −$12,043
- − Property taxes
- −$2,899
- − Insurance
- −$1,075
- − Repairs & maintenance
- −$1,758
- − Management
- −$1,758
- − Depreciation
- −$6,255
- Taxable loss
- −$3,813
- Est. tax savings @ 24.0%
- +$915
- After-tax cash flow
- $771/yr
For passive investors: Depreciation is non-cash, so a rental often shows a tax loss while cash-flowing — sheltering income. Rental losses are passive: they offset passive income freely, and up to $25,000/yr can offset ordinary (W-2) income if you actively participate and your MAGI is under $100k (phasing out to $0 by $150k); unused losses carry forward. On sale, claimed depreciation is recaptured at up to 25%, and gains may owe capital-gains tax (a 1031 exchange can defer both). Figures are a year-1 estimate at your 24.0% rate — not tax advice; consult a CPA.
Schools (NCES district)
- District
- Lee
- NCES district ID
- 1201080
- Math proficiency
- 47% ▼ -11.00%
- Reading proficiency
- 50% ▼ -4.00%
- Median HH income
- $49,518
- Composite
- 41.49/100
- National rank
- #3458
- State rank
- #42 of 73 in FL
Livability — Lehigh Acres
- Score
- 59/100
- State rank
- #826
- US rank
- #20055
Category grades
Schools grade is shown separately in the Schools card above.
Census & demographics
- Census place
- Lehigh Acres, FL
- County
- Lee County · 788,662 people
- City population
- 130,638
- Metro
- Cape Coral-Fort Myers, FL
- Population (ZIP)
- 20,277
- Household income
- $72,679
- Rent vs Own
- Severe rent burden
- 574.0
Population outlook (Lee County) Hauer SSP2
- Today (2025)
- 871,946 people
- By 2030
- 955,468 · +9.6%
- By 2040
- 1,113,587 · +27.7%
- By 2050
- 1,256,891 · +44.1%
- By 2075
- 1,560,270 · +78.9%
- By 2100
- 1,726,848 · +98.0%
Race, ethnicity, and origin ACS 2023
- Neighborhood character
- Diverse neighborhood (Simpson 0.65)
- Race & ethnicity
- Hispanic / Latino 50% Two or more races 30% White 24% Black 20% Asian 3%
- Hispanic origin (detail)
- Mexican 8% Puerto Rican 8% Cuban 18% Dominican 4%
- Common ancestry
- Hispanic 8% Slovak 1% Lithuanian 1%
- Foreign-born
- 35% · Canada, Jamaica, Vietnam
- Languages at home
- 46% English-only · Spanish 43% French/Haitian/Cajun 8% Vietnamese 1%
Political lean MEDSL · Lee
- 2024 margin
- Strong R (+28.4) · D 35.5% · R 63.9%
- 2008→2024 swing
- -18.0pp toward R · 2008: -10.4pp · 2024: -28.4pp
- All cycles
- 2024: R+28.4 2020: R+19.2 2016: R+20.4 2012: R+16.6 2008: R+10.4
Not yet ingested
- Civics
- —
Market trends
- HPI YoY
- ▲ 21.77%
- Current HPI
- 340.4255
- Rent YoY
- ▼ -1.54%
- Metro
- Cape Coral-Fort Myers, FL
- State GDP YoY
- ▲ 3.28%
- F500 in state
- 36
Industry mix (Fortune 500 HQ in FL)
| Industry | F500 HQs | Revenue |
|---|---|---|
| Industrial Technology | 2 | $29B |
|
||
| Insurance | 2 | $17B |
|
||
| Retail | 1 | $60B |
|
||
| Technology Distribution | 1 | $58B |
|
||
| Homebuilding | 1 | $35B |
|
||
| Technology Manufacturing | 1 | $35B |
|
||
Price history
+10650.0% since first listed18 events — show timeline
- 2026-05-24 Listed $215,000 FSBO.com
- 2026-02-28 Rental Removed $1,750 NAPLESMLS
- 2026-02-20 Listed for Rent $1,750 NAPLESMLS
- 2026-02-20 Rental Removed $2,000 FGCMLS
- 2026-02-04 Listed for Rent $2,000 FGCMLS
- 2025-11-25 Sold (MLS) $185,000 FORTMLS
- 2025-11-12 Pending — FORTMLS
- 2025-10-10 Price Changed $199,900 FORTMLS
- 2025-09-24 Price Changed $210,000 FORTMLS
- 2025-08-07 Listed $239,900 FORTMLS
- 2021-08-23 Sold (Public Records) $165,000 Public Records
- 2021-08-17 Sold (MLS) $165,000 FORTMLS
- 2021-07-22 Listing Removed — FORTMLS
- 2021-07-13 Listed $165,000 FORTMLS
- 2015-03-02 Price Changed $39,900 FORTMLS
- 2011-01-18 Sold (MLS) $44,000 FORTMLS
- 2003-07-23 Sold (Public Records) $4,000 Public Records
- 1995-12-07 Sold (Public Records) $2,000 Public Records
Property tax history
+8.7%/yrLatest (2025): $2,899 · -9.6% YoY. Source: county tax records.
Cash-flow waterfall
monthlySold comps — $/sqft
last 12 mo · ≤1 miLoading sold comps…