 🏗️ New Construction
Silver Springs Plan · West Vero Corridor, FL
Flood risk No data
- FEMA flood zone
- —
- Chance of flooding over 30 yrs
- —
- Est. flood insurance / yr
- —
Fire risk No data
- Est. fire insurance / yr
- —
Heat risk No data
- Hot days now (above threshold)
- —
- Hot days in 30 yrs
- —
Wind risk No data
- Chance of severe wind over 30 yrs
- —
Air-quality risk No data
- Unhealthy air days now
- —
- Unhealthy air days in 30 yrs
- —
Risk factors via First Street. Map © Google.
Why this score? — see what drove the D+ grade
The composite is a weighted blend of 9 inputs, each scored 0–100. Each bar is that input's sub-score; the figure is the points it added to the 100-point composite (weight × sub-score).
- Cash flow +15.0/30.0
- ARV discount +7.5/15.0
- 1% rule +5.0/10.0
- DSCR +5.0/10.0
- Schools +4.2/10.0
- Livability +3.7/5.0
- Rent growth +2.7/5.0
- Condition / age +2.5/5.0
- Appreciation +0.0/10.0
$184,900
🖨 Deal sheet 📄 Offer letter ✓ Due diligence
Listing remarks
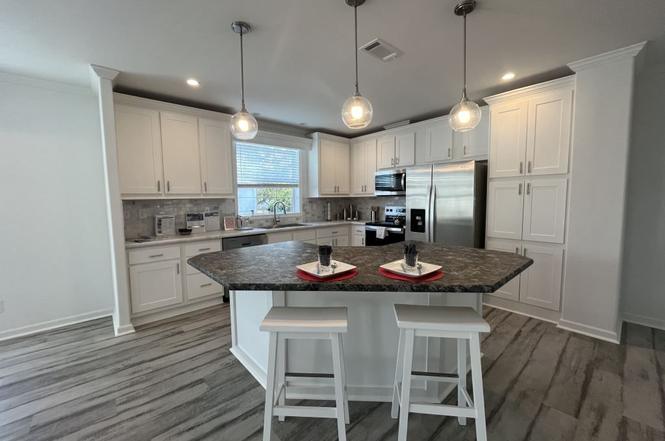
55+ age qualified community. NEW Home - DON'T MISS OUT ON THIS AMAZING HOME AT AN AFFORDABLE PRICE!!! NO LOT RENT UNTIL July 1ST - IF PURCHASED. IF RENTED - No RENT UNTIL July 1ST. Welcome to Countryside at Vero Beach a 55+ age-qualified active and vibrant community, where you can find yourself in your dream home. We have a brand new and beautiful 2026 3 bed, 2 bath home for sale featuring 1356.16 sq ft of beautifully designed living space. Located in Vero Beach, this property offers the perfect blend of modern amenities and timeless charm. Step inside to find an open-concept floor plan, beautiful and durable driftwood grain luxury plank floors, high tray ceiling, crown molding throughout,
Key facts
- Covered front patio
- Huge kitchen island
- Resort-style pool
Tags
Property features AI
Finance
- Financial info: List price $187,900
Exterior
- Home design: Single-family plan home (Silver Springs); Located in Vero Beach, FL 32966
- Exterior features: Living area approximately 1,356 (living area provided)
Interior
- Bedrooms: 3 bedrooms
- Bathrooms: 2 full bathrooms
- Interior features: Active listing (Plan: Silver Springs); Virtual tour available
Neighborhood map
What this means for you Summary
Snapshot
- This is a 3-bed/2.0-bath manufactured listed at $185k.
Deal economics
- At list price, monthly cash flow is $1k ($16k/yr) — positive.
- The deal already cash-flows at list — no discount required.
- Meets the 1% rule at list price ($2k rent vs $185k).
- Recommended offer: $163k (12.0% below list) — sets the bar for market timing.
- Cap rate 53.7% vs local median 4.0% in West Vero Corridor — top-decile yield for the area; either an underpriced asset or a hidden risk that comps aren't pricing in. Stress-test before assuming the spread holds.
Location & tenants
- Location reads 74/100 on livability (#273 in FL, #4,421 nationally) — a middle-class / working-renter tenant base. Strengths: cost of living A+, housing A+, commute A; Watch: schools F, amenities F, health & safety D-.
- Indian River (other): math 48% / reading 52% proficiency, ranked #35 of 73 in FL (top 48%) — acceptable for families but not a draw, mixed tenant base, ~2y average lease.
- Market conditions: Rents flat; 380 active listings in the ZIP; 13 comparable units currently listed for rent nearby; rentals at typical pace (median 21d on market — plan ~3-4 weeks tenant-placement turnaround); 564 units permitted in Indian River County in 2024 (281 in 5+ unit buildings).
- This rent runs 36% of the median local income ($67k/yr) — at the standard rent-burdened threshold; future hikes will face affordability resistance.
Forward outlook
- Local home prices are declining (-3.0%/yr); year-one equity from $234 of loan paydown is wiped out by about $1k of value loss. Plan a longer hold.
- Indian River County population projected at +18% by 2050 — long-run rental-demand tailwind backs the buy-and-hold thesis.
- At projected returns (-3.0% appreciation + 0.6% rent growth), your $9k cash investment doubles in ~1 year — after that, you're playing with house money.
Negotiation context
- It's been on market 241 days — a 12% lower offer ($163k) is reasonable based on typical stale-listing flexibility.
Questions for the listing agent
- It's been on market 241 days. Have you received any prior offers? Is the seller open to a 12% concession, seller financing, or rate buy-down credit?
- Why hasn't it sold? Are there any deal-killer items the seller is aware of (foundation, flood, title, zoning, code violations)?
- Is there a deadline driving the sale (1031 exchange, divorce, estate, relocation)? That informs how much negotiation room exists.
- Schools are F-rated, which usually means shorter tenancies and higher turnover. Who's the typical renter profile here, and what's been the actual vacancy rate?
- The area grade is low — what's the realistic commute time and amenity access for the typical tenant pool here? Any planned neighborhood developments (good or bad) we should know about?
- What's the average days-on-market for RENTAL listings here right now (not sales)? A rising rental-DOM trend means longer vacancies and softer asking-rent achievability than the comps imply.
- What's the recent tenant-quality profile in this submarket — average credit score on applications, eviction rate, late-payment / NSF rate, and stable-employment percentage? A property-management company in the area should have these aggregated.
- How much new for-sale + rental construction is in the pipeline within 1–3 miles? Heavy new supply typically softens prices + rents 12–24 months out; constrained supply supports both.
Investment metrics
- 1% rule
- 5.87% ✓
- Cap rate
- 53.66%
- Cash-on-cash
- 169.17%
- DSCR
- 8.53
- GRM
- 1.4
CMA / ARV
- ARV (on-the-fly)
- $33,900
- Comps found
- 1
Show comp detail 1 sale within ~0.75 mi
| Address | Dist | Beds/Ba | Sqft | Sold | Price | $/sf | Match |
|---|---|---|---|---|---|---|---|
| 911 Courier St | 0.65mi | 2/2.0 (-1) | 1,300 (-4%) | 22mo | $33,000 | $25 | 40 |
Match score weights: distance 35% · size 25% · config 20% · recency 20%. Top-matched comps best support the ARV.
Projected returns pro-forma
-3.0% appreciation · 0.6% rent growth · sell at horizon
- IRR
- —
- Equity multiple
- 8.91×
- Total profit
- $75,067
- Equity at exit
- $5,055
- IRR
- —
- Equity multiple
- 17.53×
- Total profit
- $156,872
- Equity at exit
- $2,931
Cash invested: $9,492 (down + closing). Projections, not guarantees.
Landlord ↔ Tenant lean methodology
- Overall (STATE)
- 87 Strongly Landlord-Friendly
- State Florida
- 87 Strongly Landlord-Friendly · R+3
- County
- — inherits STATE
- City
- — inherits STATE
ZIP-level market 32966
- Home prices YoY
- -26.7%
- Rents YoY
- 0.6%
- Active inventory
- 380
- Price-to-rent
- 7.7×
Monthly cashflow live
- Estimated rent
- $1,990 high interval (Pro) →
- Mortgage (P&I)
- −$178
- Tax est. 1.5%
- −$42 /mo · $508/yr
- Insurance
- −$14
- HOA
- −$0
- Vacancy / Maint / Mgmt
- −$418
- Net cashflow
- $1,338
Break-even live
UW: 25.0% down · 7.5% · 30yr · 1.5% tax · 5.0% vac · 8.0% maint · 8.0% mgmt
Financing live
Cash to close
- Down payment
- $8,475
- Closing costs
- $1,017
- Reserves months
- —
- Total cash needed
- —
Loan-product check · same deal, 3 products live
Conventional
25% down · 7.5% · 30yr
- Down + closing
- —
- Monthly P&I
- —
- Monthly cashflow
- —
- DSCR
- —
- Eligible?
- —
Personal DTI + credit; lowest rate.
DSCR
20% down · 8.5% · 30yr
- Down + closing
- —
- Monthly P&I
- —
- Monthly cashflow
- —
- DSCR
- —
- Eligible?
- —
No personal income docs; deal must DSCR.
Hard money
10% down · 12.0% · 12mo
- Down + closing
- —
- Monthly P&I
- —
- Monthly cashflow
- —
- DSCR
- —
- Eligible?
- —
Short-term bridge; refi at stabilization.
Rent comps 13 comps
| Address | Beds | Baths | Sqft | Rent | $/sqft | DOM | Units | Dist |
|---|---|---|---|---|---|---|---|---|
| 8775 20th St #909 Vero Beach, FL | 2.0 | 2.0 | 1000 | $1,799 | $1.80 | 21d | 1 | 0.11mi |
| 8775 20th St #925 Vero Beach, FL | 3.0 | 2.0 | 1356 | $1,799 | $1.33 | 21d | 1 | 0.11mi |
| 8775 20th St #59 Vero Beach, FL | 2.0 | 2.0 | 1147 | $1,699 | $1.48 | 21d | 1 | 0.11mi |
| 589 Johnathans Cay Vero Beach, FL | 3.0 | 2.0 | 1409 | $1,799 | $1.28 | 13d | 1 | 0.27mi |
| 8415 22nd St Vero Beach, FL | 2.0 | 2.0 | 1100 | $2,000 | $1.82 | 13d | 1 | 0.70mi |
| 1930 Westhampton Ct Vero Beach, FL | 2.0 | 2.0 | 1531 | $1,950 | $1.27 | 21d | 1 | 0.72mi |
| 2240 86th Dr Vero Beach, FL | 2.0 | 2.0 | 951 | $1,875 | $1.97 | 21d | 1 | 0.75mi |
| 344 Heritage Blvd Vero Beach, FL | 2.0 | 2.0 | 1000 | $1,499 | $1.50 | 21d | 1 | 0.78mi |
| 174 Congress St Vero Beach, FL | 2.0 | 2.0 | 1200 | $1,700 | $1.42 | 21d | 1 | 0.82mi |
| 1625 Pointe West Way Vero Beach, FL | 3.0 | 2.5 | 1600 | $2,000 | $1.25 | 21d | 1 | 0.88mi |
| 2365 89th Dr Vero Beach, FL | 2.0 | 2.0 | 1182 | $1,700 | $1.44 | 21d | 1 | 0.95mi |
| 2050 Griffon Rd Vero Beach, FL | 1.0–2.0 | 1.0–2.0 | 850 | $2,295 | $2.70 | 13d | 31 | 1.14mi |
| 7580 Heron Cir Vero Beach, FL | 1.0–3.0 | 1.0–2.0 | 1003 | $2,467 | $2.46 | 13d | 21 | 1.30mi |
Listing history 16 events
-
2026-06-19days on market $184,900 Active 241 DOM
-
2026-06-18days on market $184,900 Active 240 DOM
-
2026-06-17days on market $184,900 Active 239 DOM
-
2026-06-16days on market $184,900 Active 238 DOM
-
2026-06-15days on market $184,900 Active 237 DOM
-
2026-06-14days on market $184,900 Active 235 DOM
-
2026-06-13days on market $184,900 Active 234 DOM
-
2026-06-10pricedays on market $184,900 Active 232 DOM
-
2026-06-09days on market $185,400 Active 231 DOM
-
2026-06-08days on market $185,400 Active 230 DOM
-
2026-06-07days on market $185,400 Active 229 DOM
-
2026-06-05days on market $185,400 Active 226 DOM
-
2026-06-02days on market $185,400 Active 225 DOM
-
2026-06-01days on market $185,400 Active 224 DOM
-
2026-05-31days on market $185,400 Active 223 DOM
-
2026-05-30days on market $185,400 Active 222 DOM
ⓘ Source: listings_history table (triggers on properties + properties_extension) + one-shot
backfill from property_details.listing_events for pre-trigger history.
Nearby sold comps map
Loading sold comps map…
Walkable amenities ~0.75 mi
Loading nearby amenities…
Taxation est. · year 1
- Rental income
- $23,884
- − Mortgage interest
- −$1,899
- − Property taxes
- −$508
- − Insurance
- −$170
- − Repairs & maintenance
- −$1,911
- − Management
- −$1,911
- − Depreciation
- −$986
- Taxable income
- $16,500
- Est. tax owed @ 24.0%
- −$3,960
- After-tax cash flow
- $12,097/yr
For passive investors: Depreciation is non-cash, so a rental often shows a tax loss while cash-flowing — sheltering income. Rental losses are passive: they offset passive income freely, and up to $25,000/yr can offset ordinary (W-2) income if you actively participate and your MAGI is under $100k (phasing out to $0 by $150k); unused losses carry forward. On sale, claimed depreciation is recaptured at up to 25%, and gains may owe capital-gains tax (a 1031 exchange can defer both). Figures are a year-1 estimate at your 24.0% rate — not tax advice; consult a CPA.
Schools (NCES district)
- District
- Indian River
- NCES district ID
- 1200930
- Math proficiency
- 48% ▼ -9.00%
- Reading proficiency
- 52% ▼ -3.00%
- Median HH income
- $46,597
- Composite
- 42.45/100
- National rank
- #3218
- State rank
- #35 of 73 in FL
Livability — West Vero Corridor
- Score
- 74/100
- State rank
- #273
- US rank
- #4421
Category grades
Schools grade is shown separately in the Schools card above.
Census & demographics
- Census place
- West Vero Corridor, FL
- County
- Indian River County · 143,738 people
- Metro
- Sebastian-Vero Beach, FL
- Population (ZIP)
- 20,686
- Household income
- $66,771
- Rent vs Own
- Severe rent burden
- 766.0
Population outlook (Indian River County) Hauer SSP2
- Today (2025)
- 165,104 people
- By 2030
- 172,869 · +4.7%
- By 2040
- 185,640 · +12.4%
- By 2050
- 194,465 · +17.8%
- By 2075
- 211,115 · +27.9%
- By 2100
- 211,781 · +28.3%
Race, ethnicity, and origin ACS 2023
- Neighborhood character
- Predominantly White (83%)
- Race & ethnicity
- White 83% Hispanic / Latino 9% Two or more races 7% Black 5%
- Hispanic origin (detail)
- Puerto Rican 4% Cuban 1%
- Common ancestry
- Romanian 5% Lithuanian 3% Slovak 2%
- Foreign-born
- 8% · Canada, Jamaica
- Languages at home
- 90% English-only · Spanish 7% Russian/Polish/Slavic 1% French/Haitian/Cajun 1%
Political lean MEDSL · Indian River
- 2024 margin
- Strong R (+27.4) · D 36.0% · R 63.4%
- 2008→2024 swing
- -12.5pp toward R · 2008: -14.8pp · 2024: -27.4pp
- All cycles
- 2024: R+27.4 2020: R+21.6 2016: R+24.5 2012: R+22.3 2008: R+14.8
Not yet ingested
- Civics
- —
Market trends
- HPI YoY
- ▼ -102.01%
- Current HPI
- 280.669
- Rent YoY
- ▲ 0.60%
- Metro
- Sebastian-Vero Beach, FL
- State GDP YoY
- ▲ 3.28%
- F500 in state
- 36
Industry mix (Fortune 500 HQ in FL)
| Industry | F500 HQs | Revenue |
|---|---|---|
| Industrial Technology | 2 | $29B |
|
||
| Insurance | 2 | $17B |
|
||
| Retail | 1 | $60B |
|
||
| Technology Distribution | 1 | $58B |
|
||
| Homebuilding | 1 | $35B |
|
||
| Technology Manufacturing | 1 | $35B |
|
||
Cash-flow waterfall
monthlySold comps — $/sqft
last 12 mo · ≤1 miLoading sold comps…