928 Nepton Rd · Elizaville, KY
Flood risk 8/10 · Major
- FEMA flood zone
- X (unshaded)
- Chance of flooding over 30 yrs
- 0.99%
- Est. flood insurance / yr
- $473 – $860
Fire risk 3/10 · Minor
- Est. fire insurance / yr
- $839 – $1,559
Heat risk 4/10 · Minor
- Hot days now (above 101°F)
- 7 days/yr
- Hot days in 30 yrs
- 19 days/yr
Wind risk 2/10 · Minimal
- Chance of severe wind over 30 yrs
- 3.0%
Air-quality risk 2/10 · Minimal
- Unhealthy air days now
- 0 days/yr
- Unhealthy air days in 30 yrs
- 1 days/yr
Risk factors via First Street. Map © Google.
Why this score? — see what drove the B grade
The composite is a weighted blend of 9 inputs, each scored 0–100. Each bar is that input's sub-score; the figure is the points it added to the 100-point composite (weight × sub-score).
- Cash flow +30.0/30.0
- 1% rule +10.0/10.0
- DSCR +10.0/10.0
- ARV discount +7.5/15.0
- Appreciation +5.0/10.0
- Schools +2.8/10.0
- Rent growth +2.5/5.0
- Condition / age +2.5/5.0
- Livability +2.0/5.0
$42,000
🖨 Deal sheet 📄 Offer letter ✓ Due diligence
Listing remarks
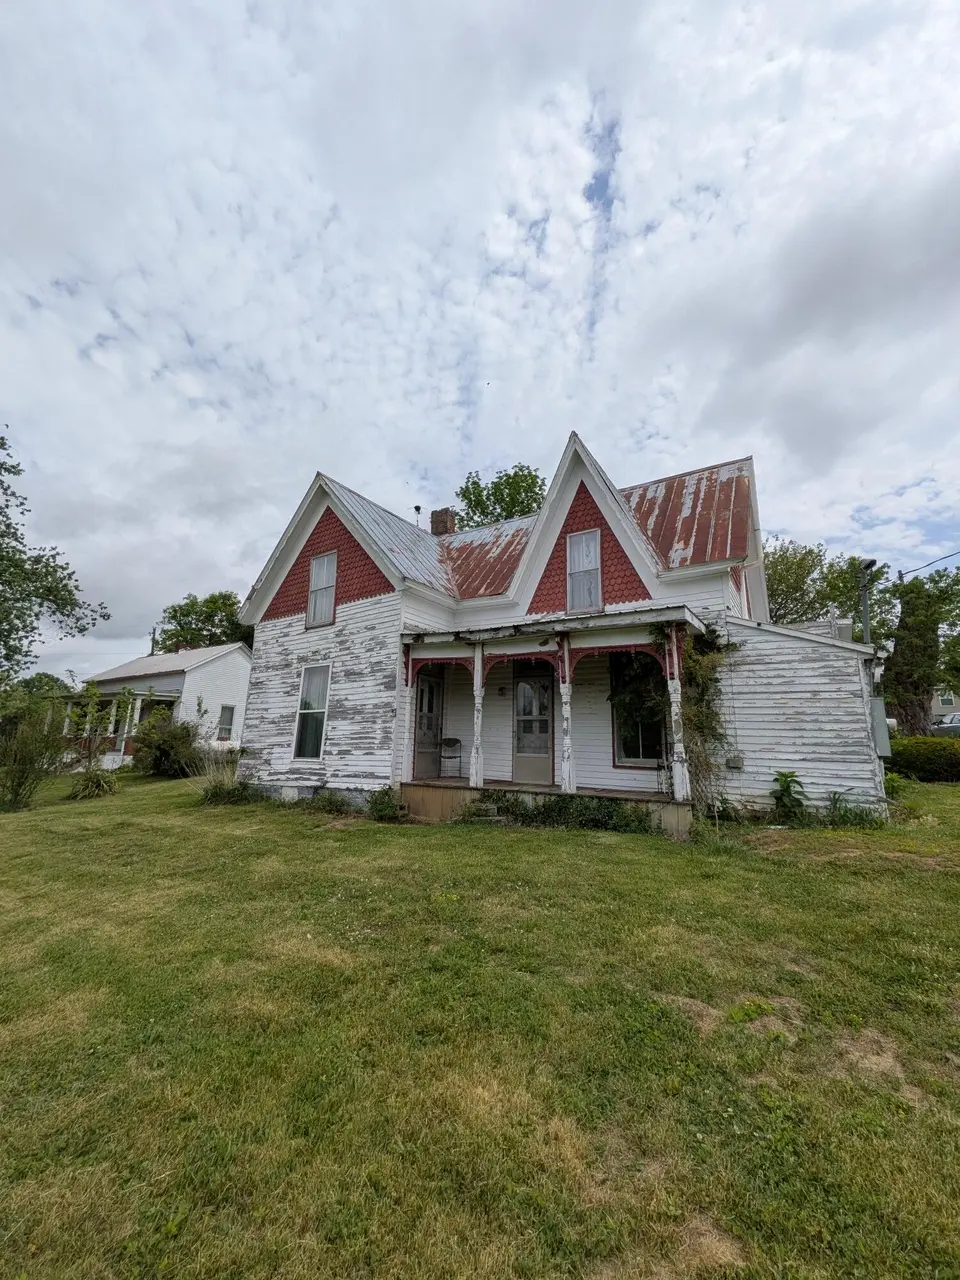
Calling all contractors and visionary buyers! Sellers are open to seller financing, making this the perfect project to preserve your cash for renovations. This 3-bed, 1-bath home is a complete rehab project situated on a huge lot. Features a substantial barn and active electric service already in place. The home requires major repairs. Sold strictly AS-IS. Exceptional potential to transform this property into a stunning home with plenty of land to spare. Schedule your preview today!
Key facts
- Huge lot
- Substantial barn
- 0.69 acre lot
Tags
Property features AI
Exterior
- Parking: Driveway
- Utilities: Public water; Public sewer
- Home design: Single family residence; Two levels; Existing structure
- Construction: Stone foundation
- Exterior features: Metal roof; Fruit trees on the property; County road frontage; Irregular lot dimensions
Interior
- Kitchen: Kitchen (appliances not listed)
- Bedrooms: Primary bedroom; Bedroom 2; Bedroom 3; Den
- Bathrooms: 1 full bathroom; Primary bath
- Interior features: Brick fireplace; Has view
Neighborhood map
What this means for you Summary
Snapshot
- This is a 3-bed/1.0-bath single-family listed at $42k.
Deal economics
- At list price, monthly cash flow is $635 ($8k/yr) — positive.
- The deal already cash-flows at list — no discount required.
- Meets the 1% rule at list price ($1k rent vs $42k).
- Recommended offer: $41k (1.5% below list) — sets the bar for market timing.
Location & tenants
- Location reads 40/100 on livability (#535 in KY) — a working-class tenant base; expect higher turnover. Strengths: cost of living A+, crime A; Watch: amenities F, commute F, employment F.
- Fleming County (rural): math 26% / reading 41% proficiency, ranked #83 of 165 in KY (top 50%) — families likely to look elsewhere, expect single-tenant / working-renter base with shorter leases.
- Zoned schools: Simons Middle School (math 26% / reading 43%, grade F, #99 of 217 statewide, top 47%, 325 students, 65% FRL).
- Market conditions: 13 active listings in the ZIP; 2 units permitted in Fleming County in 2024 (0 in 5+ unit buildings).
Forward outlook
- In year one you build about $2k of equity ($290 loan paydown + $1k appreciation (3.0% local appreciation)).
- At projected returns (3.0% appreciation + 3.0% rent growth), your $12k cash investment doubles in ~2 years — after that, you're playing with house money.
Negotiation context
- It's been on market 28 days — a 2% lower offer ($41k) is reasonable based on typical stale-listing flexibility.
- Current owner paid $11k; list at $42k implies a 285% gain — meaningful room to come down on a strong offer.
Risks & watch-outs
- Watch-outs: flood insurance adds $56/mo.
- Climate carrying-cost: severe flood risk — expect insurance premiums to compound above CPI over the hold.
Questions for the listing agent
- What's the actual annual flood-insurance premium (NFIP or private), and is the property in a SFHA with mandatory coverage?
- Is there a deadline driving the sale (1031 exchange, divorce, estate, relocation)? That informs how much negotiation room exists.
- Schools are F-rated, which usually means shorter tenancies and higher turnover. Who's the typical renter profile here, and what's been the actual vacancy rate?
- What's the average days-on-market for RENTAL listings here right now (not sales)? A rising rental-DOM trend means longer vacancies and softer asking-rent achievability than the comps imply.
- What's the recent tenant-quality profile in this submarket — average credit score on applications, eviction rate, late-payment / NSF rate, and stable-employment percentage? A property-management company in the area should have these aggregated.
- How much new for-sale + rental construction is in the pipeline within 1–3 miles? Heavy new supply typically softens prices + rents 12–24 months out; constrained supply supports both.
Investment metrics
- 1% rule
- 2.85% ✓
- Cap rate
- 26.02%
- Cash-on-cash
- 70.45%
- DSCR
- 4.13
- GRM
- 2.9
CMA / ARV
No comps found within radius.
Projected returns pro-forma
3.0% appreciation · 3.0% rent growth · sell at horizon
- IRR
- 69.6%
- Equity multiple
- 4.87×
- Total profit
- $45,523
- Equity at exit
- $18,885
- IRR
- 69.1%
- Equity multiple
- 9.97×
- Total profit
- $105,439
- Equity at exit
- $29,104
Cash invested: $11,760 (down + closing). Projections, not guarantees.
Landlord ↔ Tenant lean methodology
- Overall (STATE)
- 83 Strongly Landlord-Friendly
- State Kentucky
- 83 Strongly Landlord-Friendly · R+16
- County
- — inherits STATE
- City
- — inherits STATE
ZIP-level market 41039
- Active inventory
- 13
- Price-to-rent
- 2.9×
Monthly cashflow live
- Estimated rent
- $1,195 medium interval (Pro) →
- Mortgage (P&I)
- −$220
- Tax from tax record
- −$16 /mo · $194/yr
- Insurance
- −$18
- Flood insurance flood zone
- −$56 /mo · $666/yr
- HOA
- −$0
- Vacancy / Maint / Mgmt
- −$251
- Net cashflow
- $635
Break-even live
UW: 25.0% down · 7.5% · 30yr · 1.5% tax · 5.0% vac · 8.0% maint · 8.0% mgmt
Financing live
Cash to close
- Down payment
- $10,500
- Closing costs
- $1,260
- Reserves months
- —
- Total cash needed
- —
Loan-product check · same deal, 3 products live
Conventional
25% down · 7.5% · 30yr
- Down + closing
- —
- Monthly P&I
- —
- Monthly cashflow
- —
- DSCR
- —
- Eligible?
- —
Personal DTI + credit; lowest rate.
DSCR
20% down · 8.5% · 30yr
- Down + closing
- —
- Monthly P&I
- —
- Monthly cashflow
- —
- DSCR
- —
- Eligible?
- —
No personal income docs; deal must DSCR.
Hard money
10% down · 12.0% · 12mo
- Down + closing
- —
- Monthly P&I
- —
- Monthly cashflow
- —
- DSCR
- —
- Eligible?
- —
Short-term bridge; refi at stabilization.
Listing history 17 events
-
2026-06-18days on market $42,000 Active 28 DOM
-
2026-06-17days on market $42,000 Active 27 DOM
-
2026-06-16days on market $42,000 Active 26 DOM
-
2026-06-15days on market $42,000 Active 25 DOM
-
2026-06-14days on market $42,000 Active 23 DOM
-
2026-06-13days on market $42,000 Active 22 DOM
-
2026-06-10days on market $42,000 Active 20 DOM
-
2026-06-09days on market $42,000 Active 19 DOM
-
2026-06-08days on market $42,000 Active 18 DOM
-
2026-06-07days on market $42,000 Active 17 DOM
-
2026-06-03days on market $42,000 Active 13 DOM
-
2026-06-02days on market $42,000 Active 12 DOM
-
2026-06-01days on market $42,000 Active 11 DOM
-
2026-05-31days on market $42,000 Active 10 DOM
-
2026-05-31days on market $42,000 Active 9 DOM
-
2026-05-21$42,000 Active
-
1992-02-01soldstatus $10,900
ⓘ Source: listings_history table (triggers on properties + properties_extension) + one-shot
backfill from property_details.listing_events for pre-trigger history.
Tax reassessment forecast KY · Resets to sale price
- Current annual tax
- $194 · $16/mo
- Projected year-2 tax
- $361 · $30/mo
- Expected delta
- +$167/yr (+$14/mo · 86.0%)
ⓘ Screening estimate from a state-policy table — verify with the county assessor before closing.
Climate risk First Street
- Flood 8/10 Severe FEMA zone X (unshaded) · 99% chance over 30 yrs
- Wildfire 3/10 Moderate
- Heat 4/10 Moderate 7 d/yr ≥101°F today · 19 d/yr by 30 yrs out
- Wind 2/10 Low 3% chance of damaging wind over 30 yrs
- Air quality 2/10 Low 0 unhealthy d/yr today · 1 by 30 yrs out
Nearby sold comps map
Loading sold comps map…
Walkable amenities ~0.75 mi
Loading nearby amenities…
Taxation est. · year 1
- Rental income
- $14,344
- − Mortgage interest
- −$2,353
- − Property taxes
- −$194
- − Insurance
- −$876
- − Repairs & maintenance
- −$1,148
- − Management
- −$1,148
- − Depreciation
- −$1,222
- Taxable income
- $7,404
- Est. tax owed @ 24.0%
- −$1,777
- After-tax cash flow
- $5,841/yr
For passive investors: Depreciation is non-cash, so a rental often shows a tax loss while cash-flowing — sheltering income. Rental losses are passive: they offset passive income freely, and up to $25,000/yr can offset ordinary (W-2) income if you actively participate and your MAGI is under $100k (phasing out to $0 by $150k); unused losses carry forward. On sale, claimed depreciation is recaptured at up to 25%, and gains may owe capital-gains tax (a 1031 exchange can defer both). Figures are a year-1 estimate at your 24.0% rate — not tax advice; consult a CPA.
Schools (NCES district)
- District
- Fleming County
- NCES district ID
- 2101920
- Math proficiency
- 26% ▼ -29.00%
- Reading proficiency
- 41% ▼ -17.00%
- Median HH income
- $34,964
- Composite
- 27.61/100
- National rank
- #6928
- State rank
- #83 of 165 in KY
Livability — Elizaville
- Score
- 40/100
- State rank
- #535
- US rank
- #27306
Category grades
Schools grade is shown separately in the Schools card above.
Census & demographics
- Population (ZIP)
- 3,122
Population outlook (Fleming County) Hauer SSP2
- Today (2025)
- 14,917 people
- By 2030
- 14,997 · +0.5%
- By 2040
- 15,033 · +0.8%
- By 2050
- 14,808 · -0.7%
- By 2075
- 14,037 · -5.9%
- By 2100
- 12,176 · -18.4%
Race, ethnicity, and origin ACS 2023
- Neighborhood character
- Predominantly White (92%)
- Race & ethnicity
- White 92% Two or more races 5% Black 2%
- Common ancestry
- Portuguese 1% Slovak 1%
- Foreign-born
- 1% · Vietnam
- Languages at home
- 97% English-only · German/W. Germanic 3% Spanish 1%
Political lean MEDSL · Fleming
- 2024 margin
- Solid R (+60.6) · D 19.1% · R 79.7% · Other 1.3%
- 2008→2024 swing
- -40.9pp toward R · 2008: -19.8pp · 2024: -60.6pp
- All cycles
- 2024: R+60.6 2020: R+57.5 2016: R+54.0 2012: R+32.3 2008: R+19.8
Not yet ingested
- Civics
- —
Market trends
- HPI YoY
- —
- Current HPI
- —
- Rent YoY
- —
- Metro
- —
- State GDP YoY
- ▲ 1.81%
- F500 in state
- 4
Industry mix (Fortune 500 HQ in KY)
| Industry | F500 HQs | Revenue |
|---|---|---|
| Healthcare | 1 | $118B |
|
||
| Food / Beverage | 1 | $7B |
|
||
Price history
+285.3% since first listed2 events — show timeline
- 2026-05-21 Listed $42,000 NKMLS
- 1992-02-01 Sold (Public Records) $10,900 Public Records
Cash-flow waterfall
monthlySold comps — $/sqft
last 12 mo · ≤1 miLoading sold comps…