 🏷️ Likely Rental
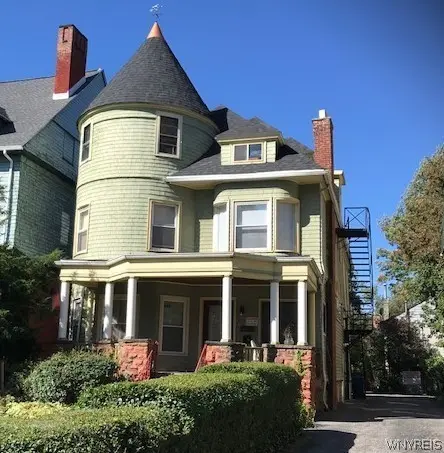
340 Elmwood Ave · Buffalo, NY
Flood risk 1/10 · Minimal
- FEMA flood zone
- X (unshaded)
- Chance of flooding over 30 yrs
- 0.0%
- Est. flood insurance / yr
- $473 – $860
Fire risk 1/10 · Minimal
- Est. fire insurance / yr
- $691 – $1,283
Heat risk 3/10 · Minor
- Hot days now (above 91°F)
- 7 days/yr
- Hot days in 30 yrs
- 15 days/yr
Wind risk 1/10 · Minimal
- Chance of severe wind over 30 yrs
- —
Air-quality risk 4/10 · Minor
- Unhealthy air days now
- 4 days/yr
- Unhealthy air days in 30 yrs
- 9 days/yr
Risk factors via First Street. Map © Google.
Why this score? — see what drove the B+ grade
The composite is a weighted blend of 9 inputs, each scored 0–100. Each bar is that input's sub-score; the figure is the points it added to the 100-point composite (weight × sub-score).
- Cash flow +30.0/30.0
- ARV discount +15.0/15.0
- 1% rule +10.0/10.0
- DSCR +10.0/10.0
- Livability +3.9/5.0
- Rent growth +3.7/5.0
- Schools +3.3/10.0
- Condition / age +2.5/5.0
- Appreciation +0.0/10.0
$599,900
🖨 Deal sheet (PDF) 📄 Offer letter ✓ Due diligence
Multi-family units
County records classify this as Multi-Family (5+ Unit). Listing-text estimate: 1 unit. estimate disagrees with records
5+ unit building — per-unit beds/baths from public records are typically unavailable; the breakdown below (if shown) is an estimate from the listing text.
Listing remarks MLS
VERY UNIQUE INVESTMENT OPPORTUNITY. PRIME BUFFALO LOCATION ON THE ELMWOOD VILLAGE STRIP. 340 ELMWOOD IS A COMBINATION APARTMENT BUILDING AND ROOM HOUSE. 340 ELMOWOOD HAS OPERATED UNDER A ROOMING HOUSE WITH LICENSES FOR MANY YEARS. PROPERTY IS IN A+ CONDITION. ROOF AND MECNANICALS ARE APPROX. 8 YEARS OLD. ALL UTITLTIES AREE INCLUDED IN RENTS. TENANTS ARE LEASED AND ALSO MONTH TO MONTH. THERE IS A SHARED DRIVEWAY, WITH ROOM TO EXPAND PARKING ON THE 200FT. DEEP LOT! PLEASE SEE SUPPLIMENTS FOR INCOME AND EXPENSES. BUILDING HAS MOSTLY ALL REPLACEMENT WINDOWS, NEWER ROOF AND MECHANICALS. THERE ARE 7 INDIVIDUAL ROOMS THAT SHARE TWO MODERN BATHROOMS THERE IS 1 SINGLE BEDROOM APARTMENT. THEERE ARE 3 MODIFIED STUDIO STYLE UNITS PROPERTY IS CURRENTLY MANAGED PROFESSIONALLY BY A 3RD PARTY MANAGER. 1-3 UNITS WILL BE SHOWN ON 1ST TOUR. PLEASE ALLOW 48 HOURS FOR APPOINTMENTS, THANK YOU
Key facts
- Expand parking
- 200ft deep lot
- Shared driveway
Tags
Neighborhood map
What this means for you Summary
Snapshot
- This is a 1-bed/?-bath multifamily listed at $600k.
Deal economics
- At list price, monthly cash flow is $4k ($50k/yr) — positive.
- The deal already cash-flows at list — no discount required.
- Meets the 1% rule at list price ($11k rent vs $600k).
- Recommended offer: $528k (12.0% below list) — sets the bar for market timing.
- Cap rate 14.7% vs local median 8.0% in Buffalo — top-decile yield for the area; either an underpriced asset or a hidden risk that comps aren't pricing in. Stress-test before assuming the spread holds.
Location & tenants
- Location reads 77/100 on livability (#195 in NY, #3,011 nationally) — a middle-class / working-renter tenant base. Strengths: commute A+, housing A+, health & safety A+; Watch: crime F, employment D-.
- Buffalo City School District (urban): math 41% / reading 40% proficiency, ranked #535 of 590 in NY (top 91%) — families likely to look elsewhere, expect single-tenant / working-renter base with shorter leases; 75% free/reduced lunch — lower-income household profile, screen leases tightly.
- Zoned schools: International School (math 8% / reading 17%, grade F, #2,048 of 2,108 statewide, top 97%, 981 students, 92% FRL); Hutchinson Central Technical High School (math 96% / reading 32%, grade B-, #807 of 1,100 statewide, top 73%, 1,175 students, 78% FRL).
- Market conditions: Rents rising fast (+4.7%/yr); 64 active listings in the ZIP; 5 comparable units currently listed for rent nearby; rentals lingering (median 45d on market — plan ~5-8 weeks vacancy on turnover, expect pricing pressure); 60% of comp listings sitting > 30 days — soft ceiling on asking rent; solid renter incomes; 1,244 units permitted in Erie County in 2024 (563 in 5+ unit buildings).
- At $10,573/mo this rent would consume 155% of the median local household income ($82k/yr) (locally 978% of renters already pay >50% of income on rent) — very limited rent-growth headroom before tenants either downsize or default.
Forward outlook
- Local home prices are declining (-3.0%/yr); year-one equity from $4k of loan paydown is wiped out by about $18k of value loss. Plan a longer hold.
- At projected returns (-3.0% appreciation + 4.7% rent growth), your $168k cash investment doubles in ~4 years — after that, you're playing with house money.
Negotiation context
- It's been on market 129 days — a 12% lower offer ($528k) is reasonable based on typical stale-listing flexibility.
- 4 sale attempts since 14y ago with the ask held roughly flat each time — persistent listings suggest the price (not the market) is what's stuck; bring a comps-based counter.
- Current owner paid $130k; list at $600k implies a 361% gain — meaningful room to come down on a strong offer.
Risks & watch-outs
- Watch-outs: built in 1900 — expect roof / HVAC / electrical / plumbing capex.
Questions for the listing agent
- It's been on market 129 days. Have you received any prior offers? Is the seller open to a 12% concession, seller financing, or rate buy-down credit?
- Built in 1900 — when were the roof, HVAC, electrical panel, plumbing, and water heater last replaced?
- Why hasn't it sold? Are there any deal-killer items the seller is aware of (foundation, flood, title, zoning, code violations)?
- Is there a deadline driving the sale (1031 exchange, divorce, estate, relocation)? That informs how much negotiation room exists.
- Crime grade is F in this area — have there been break-ins, vandalism, or insurance claims at this property in the last 3 years? What carrier currently insures it and at what premium?
- What's the average days-on-market for RENTAL listings here right now (not sales)? A rising rental-DOM trend means longer vacancies and softer asking-rent achievability than the comps imply.
- What's the recent tenant-quality profile in this submarket — average credit score on applications, eviction rate, late-payment / NSF rate, and stable-employment percentage? A property-management company in the area should have these aggregated.
- How much new apartment / multifamily construction is in the pipeline within 1–3 miles? Heavy new supply (>2% of stock underway) typically softens rents 12–24 months out; light construction supports rent growth.
Investment metrics
- 1% rule
- 1.76% ✓
- Cap rate
- 14.71%
- Cash-on-cash
- 30.05%
- DSCR
- 2.34
- GRM
- 4.7
CMA / ARV
- ARV (median comp)
- $911,103
- List price
- $599,900
- Delta
- -34.16%
- Verdict
- UNDERPRICED
- Comps
- 20 within 1.0 mi
Projected returns pro-forma
-3.0% appreciation · 4.69% rent growth · sell at horizon
- IRR
- 26.6%
- Equity multiple
- 2.13×
- Total profit
- $189,170
- Equity at exit
- $89,447
- IRR
- 35.2%
- Equity multiple
- 4.50×
- Total profit
- $588,038
- Equity at exit
- $51,868
Cash invested: $167,972 (down + closing). Projections, not guarantees.
Landlord ↔ Tenant lean methodology
- Overall (STATE)
- 15 Strongly Tenant-Friendly
- State New York
- 15 Strongly Tenant-Friendly · D+10
- County
- — inherits STATE
- City
- — inherits STATE
ZIP-level market 14222
- Home prices YoY
- -31.4%
- Rents YoY
- 4.7%
- Active inventory
- 64
- Price-to-rent
- 37.8×
Monthly cashflow live
- Estimated rent
- $10,573 high interval (Pro) →
- Mortgage (P&I)
- −$3,146
- Tax est. 1.5%
- −$750 /mo · $8,998/yr
- Insurance
- −$250
- HOA
- −$0
- Vacancy / Maint / Mgmt
- −$2,220
- Net cashflow
- $4,207
Break-even live
Sensitivity live
| Price | -10% $4,621 | -5% $4,414 | +0% $4,207 | +5% $4,000 | +10% $3,792 |
|---|---|---|---|---|---|
| Rent | -10% $3,372 | -5% $3,789 | +0% $4,207 | +5% $4,625 | +10% $5,042 |
| Rate | -1.0pp $4,509 | -0.5pp $4,359 | base $4,207 | +0.5pp $4,051 | +1.0pp $3,893 |
8-unit breakdown (identical units grouped — click to expand)
| Units | Beds | Baths | Est. rent |
|---|---|---|---|
| 8× units | 1 | 1 | $10,576 |
| #1 | 1 | 1 | $1,322 |
| #2 | 1 | 1 | $1,322 |
| #3 | 1 | 1 | $1,322 |
| #4 | 1 | 1 | $1,322 |
| #5 | 1 | 1 | $1,322 |
| #6 | 1 | 1 | $1,322 |
| #7 | 1 | 1 | $1,322 |
| #8 | 1 | 1 | $1,322 |
| Total (8 units) | $10,573 | ||
UW: 25.0% down · 7.5% · 30yr · 1.5% tax · 5.0% vac · 8.0% maint · 8.0% mgmt
Financing live
Cash to close
- Down payment
- $149,975
- Closing costs
- $17,997
- Reserves months
- —
- Total cash needed
- —
Loan-product check · same deal, 3 products live
Conventional
25% down · 7.5% · 30yr
- Down + closing
- —
- Monthly P&I
- —
- Monthly cashflow
- —
- DSCR
- —
- Eligible?
- —
Personal DTI + credit; lowest rate.
DSCR
20% down · 8.5% · 30yr
- Down + closing
- —
- Monthly P&I
- —
- Monthly cashflow
- —
- DSCR
- —
- Eligible?
- —
No personal income docs; deal must DSCR.
Hard money
10% down · 12.0% · 12mo
- Down + closing
- —
- Monthly P&I
- —
- Monthly cashflow
- —
- DSCR
- —
- Eligible?
- —
Short-term bridge; refi at stabilization.
Rent comps 5 comps
| Address | Beds | Baths | Sqft | Rent | $/sqft | DOM | Units | Dist |
|---|---|---|---|---|---|---|---|---|
| 83 Norwood Ave Unit 3rd Floor Buffalo, NY | 2.0 | 1.0 | 3486 | $1,350 | $0.39 | 45d | 1 | 0.13mi |
| 80 Anderson Pl Buffalo, NY | 1.0 | 1.0 | 4059 | $1,250 | $0.31 | 13d | 1 | 0.45mi |
| 619 Elmwood Ave Buffalo, NY | 2.0 | 1.0 | 4395 | $1,300 | $0.30 | 45d | 1 | 0.55mi |
| 530 Linwood Ave Buffalo, NY | 1.0 | 1.0 | 3443 | $1,200 | $0.35 | 45d | 1 | 0.96mi |
| 877 Prospect Ave Buffalo, NY | 2.0 | 1.0 | 5136 | $1,200 | $0.23 | 13d | 1 | 1.05mi |
Listing history 25 events
-
2026-06-21days on market $599,900 Active 129 DOM
-
2026-06-18days on market $599,900 Active 126 DOM
-
2026-06-17days on market $599,900 Active 125 DOM
-
2026-06-16days on market $599,900 Active 124 DOM
-
2026-06-15days on market $599,900 Active 123 DOM
-
2026-06-13days on market $599,900 Active 121 DOM
-
2026-06-13days on market $599,900 Active 120 DOM
-
2026-06-10days on market $599,900 Active 118 DOM
-
2026-06-09days on market $599,900 Active 117 DOM
-
2026-06-08days on market $599,900 Active 116 DOM
-
2026-06-07days on market $599,900 Active 115 DOM
-
2026-06-03days on market $599,900 Active 111 DOM
-
2026-06-02days on market $599,900 Active 110 DOM
-
2026-06-01days on market $599,900 Active 109 DOM
-
2026-05-31days on market $599,900 Active 108 DOM
-
2026-02-12historical
-
2026-02-11$599,900 Active 888-char remark
Show marketing remark (888 chars)
VERY UNIQUE INVESTMENT OPPORTUNITY. PRIME BUFFALO LOCATION ON THE ELMWOOD VILLAGE STRIP. 340 ELMWOOD IS A COMBINATION APARTMENT BUILDING AND ROOM HOUSE. 340 ELMOWOOD HAS OPERATED UNDER A ROOMING HOUSE WITH LICENSES FOR MANY YEARS. PROPERTY IS IN A+ CONDITION. ROOF AND MECNANICALS ARE APPROX. 8 YEARS OLD. ALL UTITLTIES AREE INCLUDED IN RENTS. TENANTS ARE LEASED AND ALSO MONTH TO MONTH. THERE IS A SHARED DRIVEWAY, WITH ROOM TO EXPAND PARKING ON THE 200FT. DEEP LOT! PLEASE SEE SUPPLIMENTS FOR INCOME AND EXPENSES. BUILDING HAS MOSTLY ALL REPLACEMENT WINDOWS, NEWER ROOF AND MECHANICALS. THERE ARE 7 INDIVIDUAL ROOMS THAT SHARE TWO MODERN BATHROOMS THERE IS 1 SINGLE BEDROOM APARTMENT. THEERE ARE 3 MODIFIED STUDIO STYLE UNITS PROPERTY IS CURRENTLY MANAGED PROFESSIONALLY BY A 3RD PARTY MANAGER. 1-3 UNITS WILL BE SHOWN ON 1ST TOUR. PLEASE ALLOW 48 HOURS FOR APPOINTMENTS, THANK YOU
-
2025-11-09price $639,900
-
2025-05-18price $675,000
-
2025-01-13$699,900 Active
-
2022-08-01historical
-
2022-06-29$675,000 Active
-
2022-02-03price $495
-
2013-05-10soldstatus $130,000
-
2012-06-19$198,900
ⓘ Source: listings_history table (triggers on properties + properties_extension) + one-shot
backfill from property_details.listing_events for pre-trigger history.
Climate risk First Street
- Flood 1/10 Low FEMA zone X (unshaded) · 0% chance over 30 yrs
- Wildfire 1/10 Low
- Heat 3/10 Moderate 7 d/yr ≥91°F today · 15 d/yr by 30 yrs out
- Wind 1/10 Low
- Air quality 4/10 Moderate 4 unhealthy d/yr today · 9 by 30 yrs out
Nearby sold comps map
Loading sold comps map…
Walkable amenities ~0.75 mi
Loading nearby amenities…
Taxation est. · year 1
- Rental income
- $126,876
- − Mortgage interest
- −$33,604
- − Property taxes
- −$8,998
- − Insurance
- −$3,000
- − Repairs & maintenance
- −$10,150
- − Management
- −$10,150
- − Depreciation
- −$17,452
- Taxable income
- $43,522
- Est. tax owed @ 24.0%
- −$10,445
- After-tax cash flow
- $40,037/yr
For passive investors: Depreciation is non-cash, so a rental often shows a tax loss while cash-flowing — sheltering income. Rental losses are passive: they offset passive income freely, and up to $25,000/yr can offset ordinary (W-2) income if you actively participate and your MAGI is under $100k (phasing out to $0 by $150k); unused losses carry forward. On sale, claimed depreciation is recaptured at up to 25%, and gains may owe capital-gains tax (a 1031 exchange can defer both). Figures are a year-1 estimate at your 24.0% rate — not tax advice; consult a CPA.
Schools (NCES district)
- District
- Buffalo City School District
- NCES district ID
- 3605850
- Math proficiency
- 41% ▲ 11.00%
- Reading proficiency
- 40% ▲ 7.00%
- Median HH income
- $31,665
- Composite
- 33.17/100
- National rank
- #5544
- State rank
- #535 of 590 in NY
Livability — Buffalo
- Score
- 77/100
- State rank
- #195
- US rank
- #3011
Category grades
Schools grade is shown separately in the Schools card above.
Census & demographics
- Census place
- Buffalo, NY
- County
- Erie County · 714,559 people
- City population
- 440,021
- Metro
- Buffalo-Cheektowaga, NY
- Population (ZIP)
- 15,311
- Household income
- $81,652
- Rent vs Own
- Severe rent burden
- 978.0
Population outlook (Erie County) Hauer SSP2
- Today (2025)
- 933,037 people
- By 2030
- 935,181 · +0.2%
- By 2040
- 928,531 · -0.5%
- By 2050
- 905,725 · -2.9%
- By 2075
- 834,037 · -10.6%
- By 2100
- 708,033 · -24.1%
Race, ethnicity, and origin ACS 2023
- Neighborhood character
- Predominantly White (74%)
- Race & ethnicity
- White 74% Black 11% Hispanic / Latino 8% Two or more races 7% Asian 2%
- Hispanic origin (detail)
- Mexican 1% Puerto Rican 3%
- Common ancestry
- Romanian 13% Lithuanian 2% Slovak 2%
- Foreign-born
- 7% · Canada, Vietnam, Jamaica
- Languages at home
- 89% English-only · Spanish 3% German/W. Germanic 2% French/Haitian/Cajun 1%
Political lean MEDSL · Erie
- 2024 margin
- Lean D (+9.7) · D 54.8% · R 45.2%
- 2008→2024 swing
- -7.9pp toward R · 2008: 17.5pp · 2024: 9.7pp
- All cycles
- 2024: D+9.7 2020: D+14.7 2016: D+4.8 2012: D+15.6 2008: D+17.5
Not yet ingested
- Civics
- —
Market trends
- HPI YoY
- ▼ -205.10%
- Current HPI
- 448.3711
- Rent YoY
- ▲ 4.69%
- Metro
- Buffalo-Cheektowaga, NY
- State GDP YoY
- ▲ 2.60%
- F500 in state
- 92
Industry mix (Fortune 500 HQ in NY)
| Industry | F500 HQs | Revenue |
|---|---|---|
| Financial Services | 10 | $950B |
|
||
| Consumer Goods | 9 | $162B |
|
||
| Insurance | 4 | $225B |
|
||
| Telecommunications | 2 | $144B |
|
||
| Pharmaceuticals | 2 | $112B |
|
||
| Media / Entertainment | 2 | $69B |
|
||
Price history
+201.6% since first listed10 events — show timeline
- 2026-02-12 Listing Removed — WNYREIS
- 2026-02-11 Listed $599,900 WNYREIS
- 2025-11-09 Price Changed $639,900 WNYREIS
- 2025-05-18 Price Changed $675,000 WNYREIS
- 2025-01-13 Listed $699,900 WNYREIS
- 2022-08-01 Listing Removed — WNYREIS
- 2022-06-29 Listed $675,000 WNYREIS
- 2022-02-03 Price Changed $495 RENT.
- 2013-05-10 Sold (MLS) $130,000 WNYREIS
- 2012-06-19 Listed $198,900 WNYREIS
Cash-flow waterfall
monthlySold comps — $/sqft
last 12 mo · ≤1 miLoading sold comps…