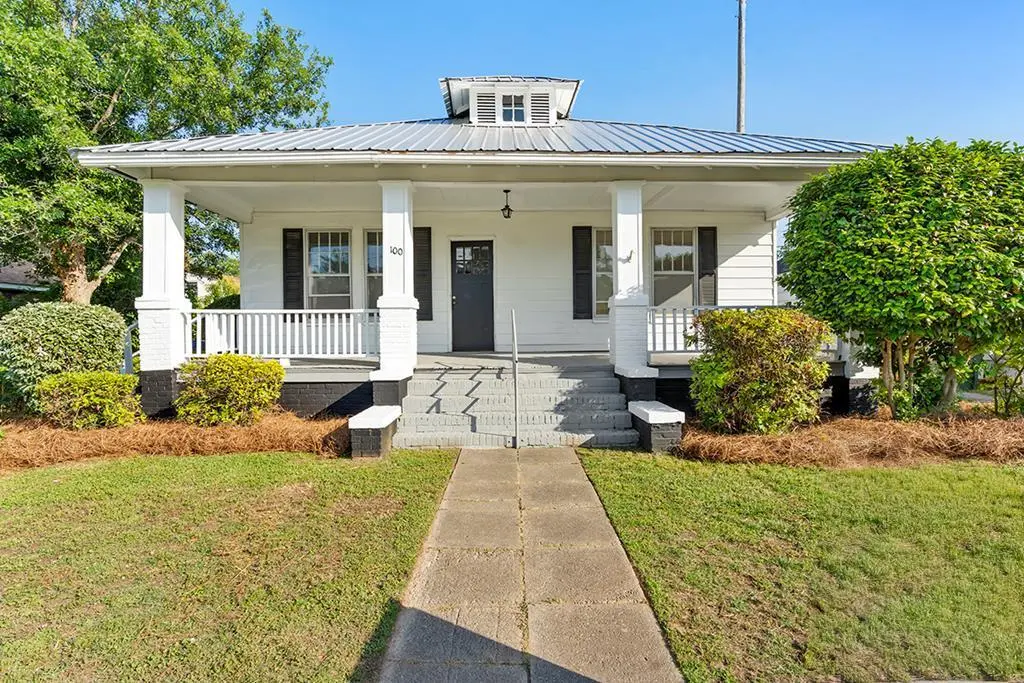
100 Grace Ter · Greenwood, SC
Flood risk 1/10 · Minimal
- FEMA flood zone
- X (unshaded)
- Chance of flooding over 30 yrs
- 0.0%
- Est. flood insurance / yr
- $507 – $1,088
Fire risk 2/10 · Minimal
- Est. fire insurance / yr
- $783 – $1,453
Heat risk 6/10 · Moderate
- Hot days now (above 105°F)
- 7 days/yr
- Hot days in 30 yrs
- 17 days/yr
Wind risk 6/10 · Moderate
- Chance of severe wind over 30 yrs
- 27.0%
Air-quality risk 4/10 · Minor
- Unhealthy air days now
- 4 days/yr
- Unhealthy air days in 30 yrs
- 4 days/yr
Risk factors via First Street. Map © Google.
Why this score? — see what drove the C- grade
The composite is a weighted blend of 9 inputs, each scored 0–100. Each bar is that input's sub-score; the figure is the points it added to the 100-point composite (weight × sub-score).
- Cash flow +22.0/30.0
- ARV discount +7.5/15.0
- DSCR +7.0/10.0
- 1% rule +5.0/10.0
- Livability +3.2/5.0
- Schools +2.9/10.0
- Rent growth +2.5/5.0
- Condition / age +2.5/5.0
- Appreciation +0.0/10.0
$189,900
🖨 Deal sheet 📄 Offer letter ✓ Due diligence
Listing remarks MLS
Great 3 BR, 1.5 BA home with great curb appeal. Excellent investment property for investors or rental property for Lander University students. Nice back yard with vineyard, pecan trees, and dog fence. Call me today for your private showing! Seller says PRICE IS NEGOTIABLE and to make her an offer!
Key facts
- Covered front porch
- Metal roof
- Central heat and air
Tags
Property features AI
Finance
- Other: Property is not in a subdivision; Directions: turn off Grace beside First Baptist Church
- HOA & community: No community features listed
Exterior
- Parking: Detached parking
- Utilities: Sewer connected
- Home design: Single-family residential property
- Construction: Aluminum siding and plaster exterior; Metal roof
- Exterior features: Covered patio/porch; Outbuilding on the property; Level, city lot; Road frontage along a city street (road maintained by public)
Interior
- Kitchen: Electric range
- Flooring: Hardwood floors
- Bathrooms: 1 full bathroom; 1 half bathroom
- Heating & cooling: Natural gas heating; Central air conditioning
- Interior features: Other interior features; No fireplace; Crawl space (no full basement)
Neighborhood map
What this means for you Summary
Snapshot
- This is a 3-bed/1.5-bath other listed at $190k.
Deal economics
- At list price, monthly cash flow is $303 ($4k/yr) — positive.
- The deal already cash-flows at list — no discount required.
- Meets the 1% rule at list price ($2k rent vs $190k).
- Cap rate 8.2% vs local median 3.6% in Greenwood — top-decile yield for the area; either an underpriced asset or a hidden risk that comps aren't pricing in. Stress-test before assuming the spread holds.
Location & tenants
- Location reads 63/100 on livability (#167 in SC) — a middle-class / working-renter tenant base. Strengths: cost of living A+, health & safety A+, housing A; Watch: amenities D, schools F, crime F.
- Greenwood 50 (town): math 31% / reading 39% proficiency, ranked #43 of 80 in SC (top 54%) — families likely to look elsewhere, expect single-tenant / working-renter base with shorter leases.
- Market conditions: 253 active listings in the ZIP; 193 units permitted in Greenwood County in 2024 (0 in 5+ unit buildings).
- This rent runs 42% of the median local income ($55k/yr) — at the standard rent-burdened threshold; future hikes will face affordability resistance.
Forward outlook
- Local home prices are declining (-3.0%/yr); year-one equity from $1k of loan paydown is wiped out by about $6k of value loss. Plan a longer hold.
- Greenwood County population projected to shrink 8% by 2050 — rents likely to lag national; underwrite the cash flow, not the appreciation.
Negotiation context
- Only 8 days on market — expect competitive offers; lowballing is unlikely to land.
- 3 sale attempts since 9y ago with the ask held roughly flat each time — persistent listings suggest the price (not the market) is what's stuck; bring a comps-based counter.
- Current owner paid $45k; list at $190k implies a 323% gain — meaningful room to come down on a strong offer.
Risks & watch-outs
- Watch-outs: built in 1932 — expect roof / HVAC / electrical / plumbing capex.
- Climate carrying-cost: major wind risk, 27% chance of damaging wind over 30y; extreme-heat days projected 7→17/yr by 2055 (HVAC capex compounding) — expect insurance premiums to compound above CPI over the hold.
Questions for the listing agent
- Built in 1932 — when were the roof, HVAC, electrical panel, plumbing, and water heater last replaced?
- Is there a deadline driving the sale (1031 exchange, divorce, estate, relocation)? That informs how much negotiation room exists.
- Schools are F-rated, which usually means shorter tenancies and higher turnover. Who's the typical renter profile here, and what's been the actual vacancy rate?
- Crime grade is F in this area — have there been break-ins, vandalism, or insurance claims at this property in the last 3 years? What carrier currently insures it and at what premium?
- What's the average days-on-market for RENTAL listings here right now (not sales)? A rising rental-DOM trend means longer vacancies and softer asking-rent achievability than the comps imply.
- What's the recent tenant-quality profile in this submarket — average credit score on applications, eviction rate, late-payment / NSF rate, and stable-employment percentage? A property-management company in the area should have these aggregated.
- How much new for-sale + rental construction is in the pipeline within 1–3 miles? Heavy new supply typically softens prices + rents 12–24 months out; constrained supply supports both.
Investment metrics
- 1% rule
- 1.00% ✓
- Cap rate
- 8.21%
- Cash-on-cash
- 6.83%
- DSCR
- 1.30
- GRM
- 8.3
CMA / ARV
No comps found within radius.
Projected returns pro-forma
-3.0% appreciation · 3.0% rent growth · sell at horizon
- IRR
- -5.8%
- Equity multiple
- 0.78×
- Total profit
- $-11,535
- Equity at exit
- $28,315
- IRR
- 3.8%
- Equity multiple
- 1.27×
- Total profit
- $14,613
- Equity at exit
- $16,419
Cash invested: $53,172 (down + closing). Projections, not guarantees.
Landlord ↔ Tenant lean methodology
- Overall (STATE)
- 90 Strongly Landlord-Friendly
- State South Carolina
- 90 Strongly Landlord-Friendly · R+6
- County
- — inherits STATE
- City
- — inherits STATE
ZIP-level market 29649
- Active inventory
- 253
- Price-to-rent
- 8.3×
Monthly cashflow live
- Estimated rent
- $1,902 medium interval (Pro) →
- Mortgage (P&I)
- −$996
- Tax from tax record
- −$125 /mo · $1,497/yr
- Insurance
- −$79
- HOA
- −$0
- Vacancy / Maint / Mgmt
- −$399
- Net cashflow
- $303
Break-even live
UW: 25.0% down · 7.5% · 30yr · 1.5% tax · 5.0% vac · 8.0% maint · 8.0% mgmt
Financing live
Cash to close
- Down payment
- $47,475
- Closing costs
- $5,697
- Reserves months
- —
- Total cash needed
- —
Loan-product check · same deal, 3 products live
Conventional
25% down · 7.5% · 30yr
- Down + closing
- —
- Monthly P&I
- —
- Monthly cashflow
- —
- DSCR
- —
- Eligible?
- —
Personal DTI + credit; lowest rate.
DSCR
20% down · 8.5% · 30yr
- Down + closing
- —
- Monthly P&I
- —
- Monthly cashflow
- —
- DSCR
- —
- Eligible?
- —
No personal income docs; deal must DSCR.
Hard money
10% down · 12.0% · 12mo
- Down + closing
- —
- Monthly P&I
- —
- Monthly cashflow
- —
- DSCR
- —
- Eligible?
- —
Short-term bridge; refi at stabilization.
Listing history 8 events
-
2026-06-19days on market $189,900 Active 8 DOM
-
2026-06-18days on market $189,900 Active 7 DOM
-
2026-06-17days on market $189,900 Active 6 DOM
-
2026-06-16days on market $189,900 Active 5 DOM
-
2026-06-15days on market $189,900 Active 4 DOM
-
2026-06-14days on market $189,900 Active 2 DOM
-
2026-06-12remarks 699-char remark
-
2026-06-12$189,900 Active 1 DOM
ⓘ Source: listings_history table (triggers on properties + properties_extension) + one-shot
backfill from property_details.listing_events for pre-trigger history.
Tax reassessment forecast SC · Resets to sale price
- Current annual tax
- $1,497 · $125/mo
- Projected year-2 tax
- $1,497 · $125/mo
- Expected delta
- $0/yr ($0/mo · 0.0%)
ⓘ Screening estimate from a state-policy table — verify with the county assessor before closing.
Climate risk First Street
- Flood 1/10 Low FEMA zone X (unshaded) · 0% chance over 30 yrs
- Wildfire 2/10 Low
- Heat 6/10 Major 7 d/yr ≥105°F today · 17 d/yr by 30 yrs out
- Wind 6/10 Major 27% chance of damaging wind over 30 yrs
- Air quality 4/10 Moderate 4 unhealthy d/yr today · 4 by 30 yrs out
Nearby sold comps map
Loading sold comps map…
Walkable amenities ~0.75 mi
Loading nearby amenities…
Taxation est. · year 1
- Rental income
- $22,821
- − Mortgage interest
- −$10,637
- − Property taxes
- −$1,497
- − Insurance
- −$950
- − Repairs & maintenance
- −$1,826
- − Management
- −$1,826
- − Depreciation
- −$5,524
- Taxable income
- $562
- Est. tax owed @ 24.0%
- −$135
- After-tax cash flow
- $3,497/yr
For passive investors: Depreciation is non-cash, so a rental often shows a tax loss while cash-flowing — sheltering income. Rental losses are passive: they offset passive income freely, and up to $25,000/yr can offset ordinary (W-2) income if you actively participate and your MAGI is under $100k (phasing out to $0 by $150k); unused losses carry forward. On sale, claimed depreciation is recaptured at up to 25%, and gains may owe capital-gains tax (a 1031 exchange can defer both). Figures are a year-1 estimate at your 24.0% rate — not tax advice; consult a CPA.
Schools (NCES district)
- District
- Greenwood 50
- NCES district ID
- 4502340
- Math proficiency
- 31% ▼ -4.00%
- Reading proficiency
- 39% ▲ 2.00%
- Median HH income
- $37,663
- Composite
- 29.14/100
- National rank
- #6585
- State rank
- #43 of 80 in SC
Livability — Greenwood
- Score
- 63/100
- State rank
- #167
- US rank
- #15097
Category grades
Schools grade is shown separately in the Schools card above.
Census & demographics
- Census place
- Greenwood, SC
- County
- Greenwood County · 26,275 people
- City population
- 26,275
- Metro
- Greenwood, SC
- Population (ZIP)
- 26,275
- Household income
- $54,585
- Rent vs Own
- Severe rent burden
- 566.0
Population outlook (Greenwood County) Hauer SSP2
- Today (2025)
- 69,627 people
- By 2030
- 68,905 · -1.0%
- By 2040
- 66,640 · -4.3%
- By 2050
- 63,768 · -8.4%
- By 2075
- 55,769 · -19.9%
- By 2100
- 47,293 · -32.1%
Race, ethnicity, and origin ACS 2023
- Neighborhood character
- Predominantly White (65%)
- Race & ethnicity
- White 65% Black 25% Hispanic / Latino 4% Two or more races 4% Asian 2%
- Common ancestry
- Serbian 3% Italian 3% Slovak 3%
- Foreign-born
- 4% · Canada, China
- Languages at home
- 97% English-only · Spanish 2%
Political lean MEDSL · Greenwood
- 2024 margin
- Strong R (+29.0) · D 34.9% · R 63.8% · Other 1.3%
- 2008→2024 swing
- -13.3pp toward R · 2008: -15.7pp · 2024: -29.0pp
- All cycles
- 2024: R+29.0 2020: R+22.8 2016: R+21.8 2012: R+15.4 2008: R+15.7
Not yet ingested
- Civics
- —
Market trends
- HPI YoY
- ▼ -128.00%
- Current HPI
- 167.9262
- Rent YoY
- —
- Metro
- Greenwood, SC
- State GDP YoY
- ▲ 4.51%
- F500 in state
- 2
Industry mix (Fortune 500 HQ in SC)
| Industry | F500 HQs | Revenue |
|---|---|---|
| Packaging | 1 | $7B |
|
||
Price history
+322.9% since first listed5 events — show timeline
- 2026-06-11 Relisted — GAOR
- 2026-05-22 Delisted — GAOR
- 2026-05-21 Listed $189,900 GAOR
- 2017-10-03 Sold (MLS) $44,900 GAOR
- 2017-05-24 Listed $44,900 GAOR
Property tax history
-2.6%/yrLatest (2025): $1,497 · +1.6% YoY. Source: county tax records.
Cash-flow waterfall
monthlySold comps — $/sqft
last 12 mo · ≤1 miLoading sold comps…