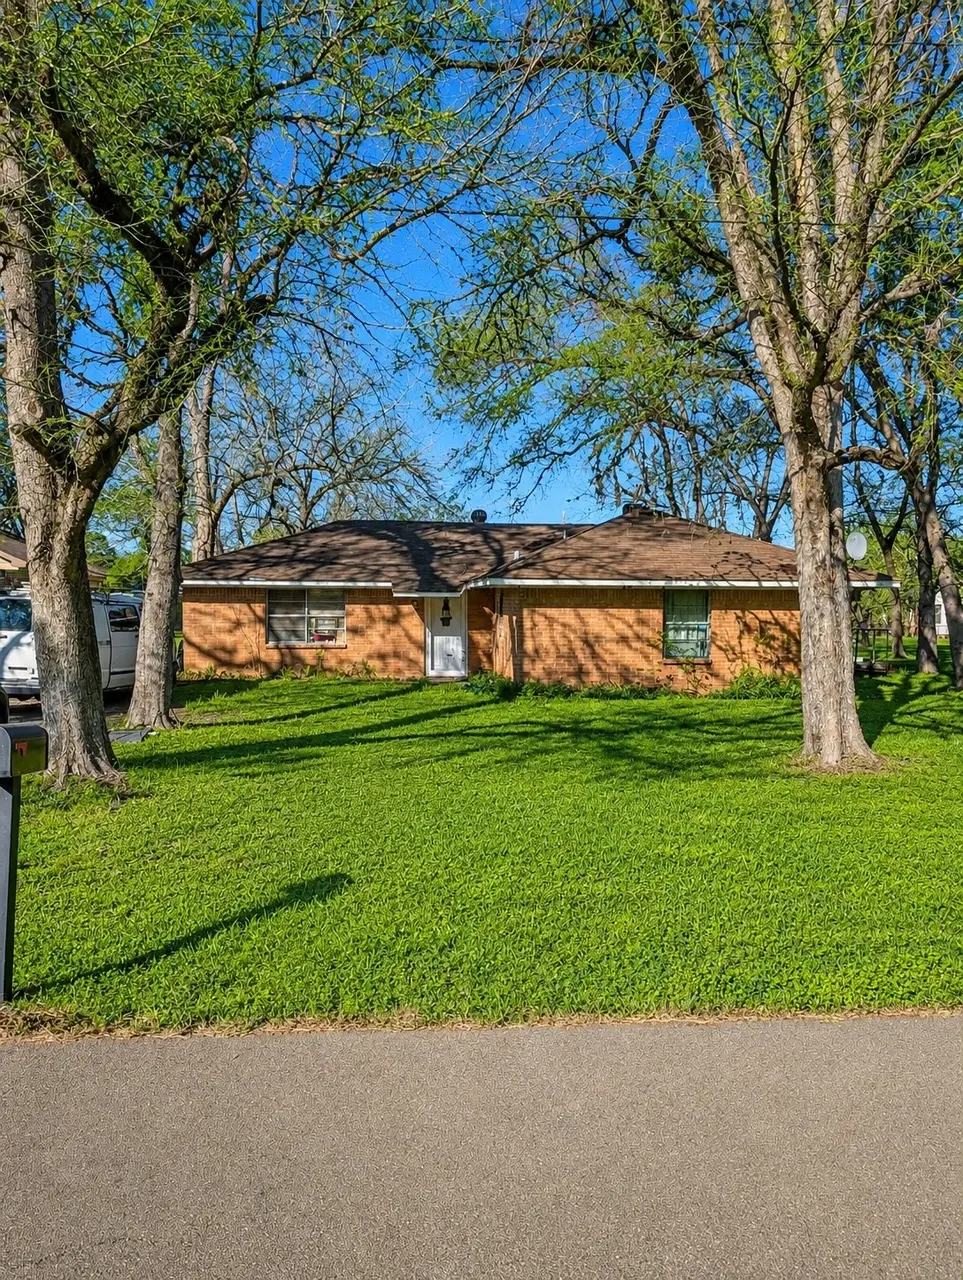
1700 W Republic Ave · Baytown, TX
Flood risk 7/10 · Major
- FEMA flood zone
- X (shaded)
- Chance of flooding over 30 yrs
- 0.74%
- Est. flood insurance / yr
- $507 – $1,088
Fire risk 1/10 · Minimal
- Est. fire insurance / yr
- $1,222 – $2,270
Heat risk 9/10 · Severe
- Hot days now (above 109°F)
- 7 days/yr
- Hot days in 30 yrs
- 25 days/yr
Wind risk 9/10 · Severe
- Chance of severe wind over 30 yrs
- 99.0%
Air-quality risk 2/10 · Minimal
- Unhealthy air days now
- 1 days/yr
- Unhealthy air days in 30 yrs
- 2 days/yr
Risk factors via First Street. Map © Google.
Why this score? — see what drove the C+ grade
The composite is a weighted blend of 9 inputs, each scored 0–100. Each bar is that input's sub-score; the figure is the points it added to the 100-point composite (weight × sub-score).
- Cash flow +22.2/30.0
- ARV discount +15.0/15.0
- DSCR +7.1/10.0
- 1% rule +5.8/10.0
- Livability +3.5/5.0
- Schools +3.2/10.0
- Rent growth +2.8/5.0
- Condition / age +2.5/5.0
- Appreciation +0.0/10.0
$125,500
🖨 Deal sheet 📄 Offer letter ✓ Due diligence
Listing remarks
Looking for a home, you can make your own or a great investment opportunity? This property is full of potential and ready for your vision! Featuring a solid layout and spacious lot, this home offers endless possibilities to renovate, update, and create something special. Conveniently located near shopping, dining, and major highways for easy access around town. Buyer to independently verify room measurements, deed restrictions, schools, and all property information.
Key facts
- Spacious lot
- Conveniently located
- 7,562 sq ft lot
Tags
Property features AI
Finance
- Other: Seller disclosure available
- Financial info: Lease not considered
Exterior
- Parking: No parking
- Utilities: Public water; Public sewer; Electric power
- Home design: Residential property; Single-story (rooms listed on first level); Facing direction not provided
- Construction: Brick construction; Built in 1950; Composition roof; Slab foundation
- Exterior features: Lot includes other features
Interior
- Kitchen: Gas oven; Gas range
- Bedrooms: Primary bedroom on first level (13 x 14); Bedroom on first level (12 x 13); Bedroom on first level (11 x 11); Three total rooms
- Bathrooms: 1 full bathroom; 1 half bathroom
- Heating & cooling: Central heating (electric); Central air (electric)
- Interior features: Ceiling fan(s); Washer hookup
- Laundry & utility: Washer hookup
Neighborhood map
What this means for you Summary
Snapshot
- This is a 3-bed/1.5-bath single-family listed at $126k.
Deal economics
- At list price, monthly cash flow is $137 ($2k/yr) — positive.
- The deal already cash-flows at list — no discount required.
- Meets the 1% rule at list price ($1k rent vs $126k).
- Recommended offer: $124k (1.5% below list) — sets the bar for market timing.
- Cap rate 8.2% vs local median 4.2% in Baytown — top-decile yield for the area; either an underpriced asset or a hidden risk that comps aren't pricing in. Stress-test before assuming the spread holds.
Location & tenants
- Location reads 69/100 on livability (#412 in TX) — a middle-class / working-renter tenant base. Strengths: cost of living A+, housing A+; Watch: employment D+, crime F, amenities F.
- Goose Creek CISD (urban): math 37% / reading 36% proficiency, ranked #473 of 826 in TX (top 57%) — families likely to look elsewhere, expect single-tenant / working-renter base with shorter leases; 61% free/reduced lunch — lower-income household profile, screen leases tightly.
- Zoned schools: Horace Mann J H (math 34% / reading 28%, grade F, #1,015 of 1,662 statewide, top 62%, 811 students, 87% FRL); High Point School (12 students, 75% FRL) — zoned schools average 81% FRL vs 61% district-wide (20 pts higher); higher-poverty schools than district average — tighter screening recommended.
- Market conditions: Rents rising (+1.3%/yr); 271 active listings in the ZIP; 7 comparable units currently listed for rent nearby; rentals at typical pace (median 24d on market — plan ~3-4 weeks tenant-placement turnaround); 43% of comp listings sitting > 30 days — soft ceiling on asking rent; 29,883 units permitted in Harris County in 2024 (8,621 in 5+ unit buildings).
Forward outlook
- Local home prices are declining (-3.0%/yr); year-one equity from $868 of loan paydown is wiped out by about $4k of value loss. Plan a longer hold.
- Harris County population projected at +47% by 2050 — long-run rental-demand tailwind backs the buy-and-hold thesis.
Negotiation context
- It's been on market 26 days — a 2% lower offer ($124k) is reasonable based on typical stale-listing flexibility.
Risks & watch-outs
- Watch-outs: flood insurance adds $66/mo; built in 1950 — expect roof / HVAC / electrical / plumbing capex.
- Climate carrying-cost: major flood risk; severe wind risk, 99% chance of damaging wind over 30y; extreme-heat days projected 7→25/yr by 2055 (HVAC capex compounding) — expect insurance premiums to compound above CPI over the hold.
Questions for the listing agent
- Built in 1950 — when were the roof, HVAC, electrical panel, plumbing, and water heater last replaced?
- What's the actual annual flood-insurance premium (NFIP or private), and is the property in a SFHA with mandatory coverage?
- Is there a deadline driving the sale (1031 exchange, divorce, estate, relocation)? That informs how much negotiation room exists.
- Schools are D-rated, which usually means shorter tenancies and higher turnover. Who's the typical renter profile here, and what's been the actual vacancy rate?
- Crime grade is F in this area — have there been break-ins, vandalism, or insurance claims at this property in the last 3 years? What carrier currently insures it and at what premium?
- What's the average days-on-market for RENTAL listings here right now (not sales)? A rising rental-DOM trend means longer vacancies and softer asking-rent achievability than the comps imply.
- What's the recent tenant-quality profile in this submarket — average credit score on applications, eviction rate, late-payment / NSF rate, and stable-employment percentage? A property-management company in the area should have these aggregated.
- How much new for-sale + rental construction is in the pipeline within 1–3 miles? Heavy new supply typically softens prices + rents 12–24 months out; constrained supply supports both.
Investment metrics
- 1% rule
- 1.08% ✓
- Cap rate
- 8.24%
- Cash-on-cash
- 6.95%
- DSCR
- 1.31
- GRM
- 7.7
CMA / ARV
- ARV (on-the-fly)
- $232,960
- Comps found
- 6
Show comp detail 6 sales within ~0.75 mi
| Address | Dist | Beds/Ba | Sqft | Sold | Price | $/sf | Match |
|---|---|---|---|---|---|---|---|
| 1606 W Humble St | 0.07mi | 3/1.0 | 1,476 (+1%) | 4mo | $125,000 | $85 | 90 |
| 1906 Texoma St | 0.17mi | 3/2.0 | 1,517 (+4%) | 14mo | $258,000 | $170 | 71 |
| 1902 W Gulf St | 0.15mi | 3/1.0 | 1,284 (-12%) | 11mo | $129,999 | $101 | 62 |
| 1302 Edison St | 0.60mi | 3/2.0 | 1,436 (-1%) | 16mo | $245,000 | $171 | 54 |
| 1101 Johnson St | 0.62mi | 4/2.0 (+1) | 1,300 (-11%) | 1mo | $208,000 | $160 | 45 |
| 1300 Burbank St | 0.66mi | 3/1.0 | 1,248 (-14%) | 4mo | $174,999 | $140 | 40 |
Match score weights: distance 35% · size 25% · config 20% · recency 20%. Top-matched comps best support the ARV.
Projected returns pro-forma
-3.0% appreciation · 1.3% rent growth · sell at horizon
- IRR
- -11.0%
- Equity multiple
- 0.61×
- Total profit
- $-13,821
- Equity at exit
- $18,712
- IRR
- -4.5%
- Equity multiple
- 0.73×
- Total profit
- $-9,583
- Equity at exit
- $10,851
Cash invested: $35,140 (down + closing). Projections, not guarantees.
Landlord ↔ Tenant lean methodology
- Overall (STATE)
- 87 Strongly Landlord-Friendly
- State Texas
- 87 Strongly Landlord-Friendly · R+5
- County
- — inherits STATE
- City
- — inherits STATE
ZIP-level market 77520
- Rents YoY
- 1.3%
- Active inventory
- 271
- Price-to-rent
- 7.7×
Monthly cashflow live
- Estimated rent
- $1,356 high interval (Pro) →
- Mortgage (P&I)
- −$658
- Tax from tax record
- −$157 /mo · $1,889/yr
- Insurance
- −$52
- Flood insurance flood zone
- −$66 /mo · $798/yr
- HOA
- −$0
- Vacancy / Maint / Mgmt
- −$285
- Net cashflow
- $137
Break-even live
UW: 25.0% down · 7.5% · 30yr · 1.5% tax · 5.0% vac · 8.0% maint · 8.0% mgmt
Financing live
Cash to close
- Down payment
- $31,375
- Closing costs
- $3,765
- Reserves months
- —
- Total cash needed
- —
Loan-product check · same deal, 3 products live
Conventional
25% down · 7.5% · 30yr
- Down + closing
- —
- Monthly P&I
- —
- Monthly cashflow
- —
- DSCR
- —
- Eligible?
- —
Personal DTI + credit; lowest rate.
DSCR
20% down · 8.5% · 30yr
- Down + closing
- —
- Monthly P&I
- —
- Monthly cashflow
- —
- DSCR
- —
- Eligible?
- —
No personal income docs; deal must DSCR.
Hard money
10% down · 12.0% · 12mo
- Down + closing
- —
- Monthly P&I
- —
- Monthly cashflow
- —
- DSCR
- —
- Eligible?
- —
Short-term bridge; refi at stabilization.
Rent comps 7 comps
| Address | Beds | Baths | Sqft | Rent | $/sqft | DOM | Units | Dist |
|---|---|---|---|---|---|---|---|---|
| 811 Barrymore Blvd Baytown, TX | 3.0 | 2.0 | 1200 | $1,300 | $1.08 | 5d | 1 | 0.61mi |
| 1601 Garth Rd Baytown, TX | 2.0–3.0 | 1.0–2.5 | 1190 | $1,499 | $1.26 | 2d | 5 | 0.74mi |
| 1607 Garth Rd Baytown, TX | 2.0 | 2.0 | 1017 | $1,025 | $1.01 | 43d | 1 | 0.75mi |
| 1305 Memorial Dr Baytown, TX | 1.0–2.0 | 1.0 | 845 | $1,193 | $1.41 | 24d | 3 | 0.91mi |
| 508 Forrest St Baytown, TX | 2.0 | 1.0 | 980 | $1,299 | $1.33 | 5d | 1 | 1.09mi |
| 516 William Ave Baytown, TX | 2.0 | 1.0 | 931 | $1,250 | $1.34 | 43d | 1 | 1.20mi |
| 105 E Adoue St Baytown, TX | 3.0 | 1.0 | 1040 | $1,200 | $1.15 | 43d | 1 | 1.43mi |
Listing history 14 events
-
2026-06-18days on market $125,500 Active 26 DOM
-
2026-06-17days on market $125,500 Active 25 DOM
-
2026-06-16days on market $125,500 Active 24 DOM
-
2026-06-15days on market $125,500 Active 23 DOM
-
2026-06-13statusdays on market $125,500 Active 21 DOM
-
2026-06-09days on market $125,500 Pending 17 DOM
-
2026-06-07statusdays on market $125,500 Pending 15 DOM
-
2026-06-04days on market $125,500 Active 12 DOM
-
2026-06-03days on market $125,500 Active 11 DOM
-
2026-06-02days on market $125,500 Active 10 DOM
-
2026-06-01days on market $125,500 Active 9 DOM
-
2026-05-31days on market $125,500 Active 8 DOM
-
2026-05-23$125,500 Active
-
1994-02-01soldstatus
ⓘ Source: listings_history table (triggers on properties + properties_extension) + one-shot
backfill from property_details.listing_events for pre-trigger history.
Tax reassessment forecast TX · Resets to sale price
- Current annual tax
- $1,889 · $157/mo
- Projected year-2 tax
- $2,297 · $191/mo
- Expected delta
- +$407/yr (+$34/mo · 21.6%)
ⓘ Screening estimate from a state-policy table — verify with the county assessor before closing.
Climate risk First Street
- Flood 7/10 Severe FEMA zone X (shaded) · 74% chance over 30 yrs
- Wildfire 1/10 Low
- Heat 9/10 Extreme 7 d/yr ≥109°F today · 25 d/yr by 30 yrs out
- Wind 9/10 Extreme 99% chance of damaging wind over 30 yrs
- Air quality 2/10 Low 1 unhealthy d/yr today · 2 by 30 yrs out
Nearby sold comps map
Loading sold comps map…
Walkable amenities ~0.75 mi
Loading nearby amenities…
Taxation est. · year 1
- Rental income
- $16,276
- − Mortgage interest
- −$7,030
- − Property taxes
- −$1,889
- − Insurance
- −$1,425
- − Repairs & maintenance
- −$1,302
- − Management
- −$1,302
- − Depreciation
- −$3,651
- Taxable loss
- −$324
- Est. tax savings @ 24.0%
- +$78
- After-tax cash flow
- $1,724/yr
For passive investors: Depreciation is non-cash, so a rental often shows a tax loss while cash-flowing — sheltering income. Rental losses are passive: they offset passive income freely, and up to $25,000/yr can offset ordinary (W-2) income if you actively participate and your MAGI is under $100k (phasing out to $0 by $150k); unused losses carry forward. On sale, claimed depreciation is recaptured at up to 25%, and gains may owe capital-gains tax (a 1031 exchange can defer both). Figures are a year-1 estimate at your 24.0% rate — not tax advice; consult a CPA.
Schools (NCES district)
- District
- Goose Creek CISD
- NCES district ID
- 4821150
- Math proficiency
- 37% ▼ -11.00%
- Reading proficiency
- 36% ▼ -4.00%
- Median HH income
- $52,468
- Composite
- 31.84/100
- National rank
- #5877
- State rank
- #473 of 826 in TX
Livability — Baytown
- Score
- 69/100
- State rank
- #412
- US rank
- #8494
Category grades
Schools grade is shown separately in the Schools card above.
Census & demographics
- Census place
- Baytown, TX
- County
- Harris County · 4,702,590 people
- City population
- 135,579
- Metro
- Houston-The Woodlands-Sugar Land, TX
- Population (ZIP)
- 36,355
- Household income
- $54,278
- Rent vs Own
- Severe rent burden
- 1559.0
Population outlook (Harris County) Hauer SSP2
- Today (2025)
- 5,571,493 people
- By 2030
- 6,089,821 · +9.3%
- By 2040
- 7,142,806 · +28.2%
- By 2050
- 8,185,864 · +46.9%
- By 2075
- 10,574,329 · +89.8%
- By 2100
- 12,109,958 · +117.4%
Race, ethnicity, and origin ACS 2023
- Neighborhood character
- Diverse neighborhood (Simpson 0.60)
- Race & ethnicity
- Hispanic / Latino 55% White 30% Two or more races 19% Black 10% Asian 2%
- Hispanic origin (detail)
- Mexican 48%
- Common ancestry
- Italian 1% Lithuanian 1% Romanian 1%
- Foreign-born
- 21% · Canada, Vietnam
- Languages at home
- 55% English-only · Spanish 43% Other Asian/Pacific 1% Other Indo-European 1%
Political lean MEDSL · Harris
- 2024 margin
- Lean D (+5.5) · D 52.0% · R 46.4% · Other 1.6%
- 2008→2024 swing
- +3.9pp toward D · 2008: 1.6pp · 2024: 5.5pp
- All cycles
- 2024: D+5.5 2020: D+13.3 2016: D+12.4 2012: D+0.1 2008: D+1.6
Not yet ingested
- Civics
- —
Market trends
- HPI YoY
- ▼ -143.36%
- Current HPI
- 262.066
- Rent YoY
- ▲ 1.30%
- Metro
- Houston-The Woodlands-Sugar Land, TX
- State GDP YoY
- ▲ 3.95%
- F500 in state
- 110
Industry mix (Fortune 500 HQ in TX)
| Industry | F500 HQs | Revenue |
|---|---|---|
| Energy | 16 | $1,198B |
|
||
| Technology | 5 | $198B |
|
||
| Engineering / Construction | 4 | $72B |
|
||
| Energy Services | 3 | $60B |
|
||
| Utilities | 3 | $41B |
|
||
| Healthcare | 2 | $330B |
|
||
Price history
2 events — show timeline
- 2026-05-23 Listed $125,500 HARMLS
- 1994-02-01 Sold (Public Records) — Public Records
Property tax history
+7.9%/yrLatest (2025): $1,889 · +10.3% YoY. Source: county tax records.
Cash-flow waterfall
monthlySold comps — $/sqft
last 12 mo · ≤1 miLoading sold comps…