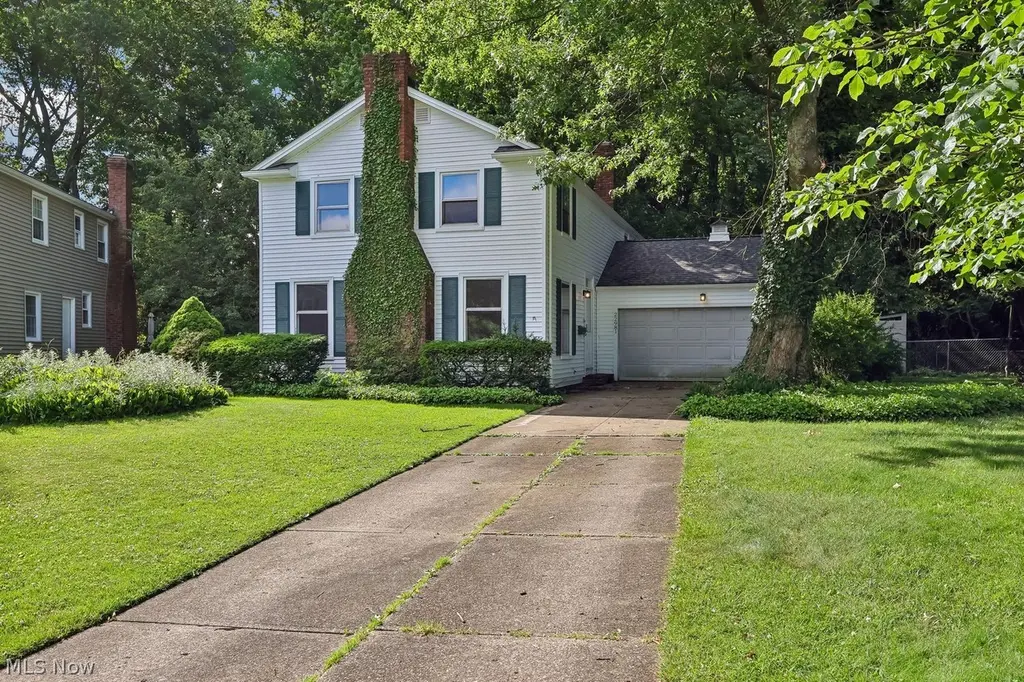
22981 Stoneybrook Dr · North Olmsted, OH
Flood risk 1/10 · Minimal
- FEMA flood zone
- X (unshaded)
- Chance of flooding over 30 yrs
- 0.0%
- Est. flood insurance / yr
- $473 – $860
Fire risk 1/10 · Minimal
- Est. fire insurance / yr
- $713 – $1,323
Heat risk 3/10 · Minor
- Hot days now (above 95°F)
- 7 days/yr
- Hot days in 30 yrs
- 17 days/yr
Wind risk 1/10 · Minimal
- Chance of severe wind over 30 yrs
- —
Air-quality risk 2/10 · Minimal
- Unhealthy air days now
- 1 days/yr
- Unhealthy air days in 30 yrs
- 3 days/yr
Risk factors via First Street. Map © Google.
Why this score? — see what drove the C+ grade
The composite is a weighted blend of 9 inputs, each scored 0–100. Each bar is that input's sub-score; the figure is the points it added to the 100-point composite (weight × sub-score).
- Cash flow +21.6/30.0
- ARV discount +15.0/15.0
- DSCR +6.9/10.0
- 1% rule +6.3/10.0
- Schools +4.7/10.0
- Livability +4.3/5.0
- Rent growth +3.0/5.0
- Condition / age +2.5/5.0
- Appreciation +0.0/10.0
$295,000
🖨 Deal sheet 📄 Offer letter ✓ Due diligence
Listing remarks
First time offered in decades! This well-maintained North Olmsted home has been lovingly owned by the same family for approximately 60 years and offers 2,070 square feet of living space on a pie-shaped 9,850-square-foot lot. The flexible floor plan includes four bedrooms, including a main-floor bedroom with an adjoining flex room and full bath, creating an ideal space for guests, hobbies, a home office, or potential first-floor living. The flex space also offers the possibility of adding a first-floor laundry area. Beautiful hardwood floors run throughout (we checked under the carpet!). Improvements include a new roof (August 2023), new siding, gutters, downspouts and rear door (September 2
Key facts
- New air conditioning
- New siding
- Main-floor bedroom
Tags
Neighborhood map
What this means for you Summary
Snapshot
- This is a 4-bed/2.5-bath single-family listed at $295k.
Deal economics
- At list price, monthly cash flow is $451 ($5k/yr) — positive.
- The deal already cash-flows at list — no discount required.
- Meets the 1% rule at list price ($3k rent vs $295k).
- Cap rate 8.1% vs local median 4.0% in North Olmsted — top-decile yield for the area; either an underpriced asset or a hidden risk that comps aren't pricing in. Stress-test before assuming the spread holds.
Location & tenants
- Location reads 86/100 on livability (#38 in OH, #372 nationally) — a professional / high-income tenant draw. Strengths: crime A+, amenities A+, employment A+; Watch: commute F.
- North Olmsted City (suburban): math 51% / reading 57% proficiency, ranked #368 of 656 in OH (top 56%) — acceptable for families but not a draw, mixed tenant base, ~2y average lease.
- Market conditions: Rents rising (+1.9%/yr); 159 active listings in the ZIP; 3 comparable units currently listed for rent nearby; rentals leasing fast (median 2d on market — plan ~1-2 weeks tenant-placement turnaround); solid renter incomes; 1,441 units permitted in Cuyahoga County in 2024 (700 in 5+ unit buildings).
- At $3,319/mo this rent would consume 47% of the median local household income ($84k/yr) (locally 667% of renters already pay >50% of income on rent) — very limited rent-growth headroom before tenants either downsize or default.
Forward outlook
- Local home prices are declining (-3.0%/yr); year-one equity from $2k of loan paydown is wiped out by about $9k of value loss. Plan a longer hold.
- Cuyahoga County population projected to shrink 8% by 2050 — rents likely to lag national; underwrite the cash flow, not the appreciation.
Negotiation context
- Only 1 days on market — expect competitive offers; lowballing is unlikely to land.
Questions for the listing agent
- Built in 1962 — when were the roof, HVAC, electrical panel, plumbing, and water heater last replaced?
- Is there a deadline driving the sale (1031 exchange, divorce, estate, relocation)? That informs how much negotiation room exists.
- Schools are B-rated — typically a magnet for longer-tenancy family renters. What's the average tenant stay here, and is there a school-zone premium baked into asking?
- What's the average days-on-market for RENTAL listings here right now (not sales)? A rising rental-DOM trend means longer vacancies and softer asking-rent achievability than the comps imply.
- What's the recent tenant-quality profile in this submarket — average credit score on applications, eviction rate, late-payment / NSF rate, and stable-employment percentage? A property-management company in the area should have these aggregated.
- How much new for-sale + rental construction is in the pipeline within 1–3 miles? Heavy new supply typically softens prices + rents 12–24 months out; constrained supply supports both.
Investment metrics
- 1% rule
- 1.13% ✓
- Cap rate
- 8.13%
- Cash-on-cash
- 6.55%
- DSCR
- 1.29
- GRM
- 7.4
CMA / ARV
- ARV (on-the-fly)
- $420,210
- Comps found
- 12
Show comp detail 12 sales within ~0.75 mi
| Address | Dist | Beds/Ba | Sqft | Sold | Price | $/sf | Match |
|---|---|---|---|---|---|---|---|
| 23066 Stoneybrook Dr | 0.07mi | 3/2.5 (-1) | 1,848 (-11%) | 1mo | $365,000 | $198 | 73 |
| 23045 Clifford Dr | 0.09mi | 4/2.0 | 1,800 (-13%) | 7mo | $265,000 | $147 | 66 |
| 23643 Stoneybrook Dr | 0.42mi | 4/2.5 | 1,944 (-6%) | 5mo | $375,000 | $193 | 66 |
| 3195 W 230th St | 0.24mi | 4/2.5 | 1,789 (-14%) | 10mo | $345,000 | $193 | 58 |
| 3261 Bridgeport Dr | 0.33mi | 3/2.5 (-1) | 2,228 (+8%) | 12mo | $480,000 | $215 | 57 |
| 4364 W 219th St | 0.64mi | 3/2.0 (-1) | 1,984 (-4%) | 2mo | $393,000 | $198 | 54 |
| 3691 Beverly Hills Dr | 0.49mi | 3/3.0 (-1) | 2,267 (+10%) | 10mo | $460,000 | $203 | 46 |
| 4464 W 224th St | 0.66mi | 3/2.0 (-1) | 1,855 (-10%) | 1mo | $310,000 | $167 | 44 |
| 3525 Chrisfield Dr | 0.66mi | 3/2.0 (-1) | 1,896 (-8%) | 9mo | $435,000 | $229 | 41 |
| 3565 Chrisfield Dr | 0.63mi | 4/2.5 | 2,345 (+13%) | 11mo | $566,001 | $241 | 39 |
| 4171 W 222nd St | 0.50mi | 3/2.0 (-1) | 1,768 (-15%) | 10mo | $380,000 | $215 | 37 |
| 3385 Palmer Dr | 0.72mi | 5/2.5 (+1) | 2,308 (+12%) | 8mo | $700,000 | $303 | 36 |
Match score weights: distance 35% · size 25% · config 20% · recency 20%. Top-matched comps best support the ARV.
Projected returns pro-forma
-3.0% appreciation · 1.85% rent growth · sell at horizon
- IRR
- -7.6%
- Equity multiple
- 0.72×
- Total profit
- $-22,760
- Equity at exit
- $43,985
- IRR
- 0.4%
- Equity multiple
- 1.03×
- Total profit
- $2,456
- Equity at exit
- $25,506
Cash invested: $82,600 (down + closing). Projections, not guarantees.
Landlord ↔ Tenant lean methodology
- Overall (STATE)
- 73 Landlord-Friendly
- State Ohio
- 73 Landlord-Friendly · R+6
- County
- — inherits STATE
- City
- — inherits STATE
ZIP-level market 44070
- Rents YoY
- 1.9%
- Active inventory
- 159
- Price-to-rent
- 7.4×
Monthly cashflow live
- Estimated rent
- $3,319 medium interval (Pro) →
- Mortgage (P&I)
- −$1,547
- Tax from tax record
- −$502 /mo · $6,019/yr
- Insurance
- −$123
- HOA
- −$0
- Vacancy / Maint / Mgmt
- −$697
- Net cashflow
- $451
Break-even live
UW: 25.0% down · 7.5% · 30yr · 1.5% tax · 5.0% vac · 8.0% maint · 8.0% mgmt
Financing live
Cash to close
- Down payment
- $73,750
- Closing costs
- $8,850
- Reserves months
- —
- Total cash needed
- —
Loan-product check · same deal, 3 products live
Conventional
25% down · 7.5% · 30yr
- Down + closing
- —
- Monthly P&I
- —
- Monthly cashflow
- —
- DSCR
- —
- Eligible?
- —
Personal DTI + credit; lowest rate.
DSCR
20% down · 8.5% · 30yr
- Down + closing
- —
- Monthly P&I
- —
- Monthly cashflow
- —
- DSCR
- —
- Eligible?
- —
No personal income docs; deal must DSCR.
Hard money
10% down · 12.0% · 12mo
- Down + closing
- —
- Monthly P&I
- —
- Monthly cashflow
- —
- DSCR
- —
- Eligible?
- —
Short-term bridge; refi at stabilization.
Rent comps 3 comps
| Address | Beds | Baths | Sqft | Rent | $/sqft | DOM | Units | Dist |
|---|---|---|---|---|---|---|---|---|
| 4566 W 226th St Cleveland, OH | 3.0 | 1.0 | 1488 | $1,895 | $1.27 | 43d | 1 | 0.69mi |
| 22603 Center Ridge Rd Rocky River, OH | 1.0–3.0 | 1.0–2.5 | 2190 | $6,295 | $2.87 | 1d | 23 | 0.86mi |
| 21216 N Park Dr Cleveland, OH | 4.0 | 1.5 | 2150 | $2,325 | $1.08 | 1d | 1 | 1.05mi |
Listing history 2 events
-
2026-06-18remarks 699-char remark
-
2026-06-18$295,000 Active 1 DOM
ⓘ Source: listings_history table (triggers on properties + properties_extension) + one-shot
backfill from property_details.listing_events for pre-trigger history.
Tax reassessment forecast OH · Partial reset (capped growth)
- Current annual tax
- $6,019 · $502/mo
- Projected year-2 tax
- $6,019 · $502/mo
- Expected delta
- $0/yr ($0/mo · 0.0%)
ⓘ Screening estimate from a state-policy table — verify with the county assessor before closing.
Climate risk First Street
- Flood 1/10 Low FEMA zone X (unshaded) · 0% chance over 30 yrs
- Wildfire 1/10 Low
- Heat 3/10 Moderate 7 d/yr ≥95°F today · 17 d/yr by 30 yrs out
- Wind 1/10 Low
- Air quality 2/10 Low 1 unhealthy d/yr today · 3 by 30 yrs out
Nearby sold comps map
Loading sold comps map…
Walkable amenities ~0.75 mi
Loading nearby amenities…
Taxation est. · year 1
- Rental income
- $39,832
- − Mortgage interest
- −$16,525
- − Property taxes
- −$6,019
- − Insurance
- −$1,475
- − Repairs & maintenance
- −$3,187
- − Management
- −$3,187
- − Depreciation
- −$8,582
- Taxable income
- $858
- Est. tax owed @ 24.0%
- −$206
- After-tax cash flow
- $5,203/yr
For passive investors: Depreciation is non-cash, so a rental often shows a tax loss while cash-flowing — sheltering income. Rental losses are passive: they offset passive income freely, and up to $25,000/yr can offset ordinary (W-2) income if you actively participate and your MAGI is under $100k (phasing out to $0 by $150k); unused losses carry forward. On sale, claimed depreciation is recaptured at up to 25%, and gains may owe capital-gains tax (a 1031 exchange can defer both). Figures are a year-1 estimate at your 24.0% rate — not tax advice; consult a CPA.
Schools (NCES district)
- District
- North Olmsted City
- NCES district ID
- 3904452
- Math proficiency
- 51% ▼ -17.00%
- Reading proficiency
- 57% ▼ -7.00%
- Median HH income
- $59,338
- Composite
- 46.98/100
- National rank
- #2353
- State rank
- #368 of 656 in OH
Livability — North Olmsted
- Score
- 86/100
- State rank
- #38
- US rank
- #372
Category grades
Schools grade is shown separately in the Schools card above.
Census & demographics
- Census place
- North Olmsted, OH
- County
- Cuyahoga County · 1,090,369 people
- City population
- 31,924
- Metro
- Cleveland-Elyria, OH
- Population (ZIP)
- 31,924
- Household income
- $84,363
- Rent vs Own
- Severe rent burden
- 667.0
Population outlook (Cuyahoga County) Hauer SSP2
- Today (2025)
- 1,244,621 people
- By 2030
- 1,230,093 · -1.2%
- By 2040
- 1,189,108 · -4.5%
- By 2050
- 1,145,706 · -7.9%
- By 2075
- 1,076,557 · -13.5%
- By 2100
- 978,987 · -21.3%
Race, ethnicity, and origin ACS 2023
- Neighborhood character
- Predominantly White (85%)
- Race & ethnicity
- White 85% Hispanic / Latino 7% Two or more races 6% Asian 3% Black 2%
- Hispanic origin (detail)
- Mexican 3% Puerto Rican 3%
- Common ancestry
- Romanian 9% Slovak 2% Lithuanian 1%
- Foreign-born
- 8% · Canada
- Languages at home
- 88% English-only · Spanish 3% Other Indo-European 3% Arabic 3%
Political lean MEDSL · Cuyahoga
- 2024 margin
- Solid D (+31.5) · D 65.4% · R 33.9%
- 2008→2024 swing
- -7.4pp toward R · 2008: 38.9pp · 2024: 31.5pp
- All cycles
- 2024: D+31.5 2020: D+34.1 2016: D+35.0 2012: D+38.7 2008: D+38.9
Not yet ingested
- Civics
- —
Market trends
- HPI YoY
- ▼ -243.21%
- Current HPI
- 214.2257
- Rent YoY
- ▲ 1.85%
- Metro
- Cleveland-Elyria, OH
- State GDP YoY
- ▲ 1.98%
- F500 in state
- 48
Industry mix (Fortune 500 HQ in OH)
| Industry | F500 HQs | Revenue |
|---|---|---|
| Insurance | 3 | $145B |
|
||
| Industrial Machinery | 3 | $49B |
|
||
| Financial Services | 3 | $24B |
|
||
| Consumer Goods | 2 | $93B |
|
||
| Aerospace / Defense | 2 | $47B |
|
||
| Utilities | 2 | $33B |
|
||
Price history
1 event — show timeline
- 2026-06-18 Listed $295,000 MLSNOW
Property tax history
+3.8%/yrLatest (2025): $6,019 · -1.5% YoY. Source: county tax records.
Cash-flow waterfall
monthlySold comps — $/sqft
last 12 mo · ≤1 miLoading sold comps…