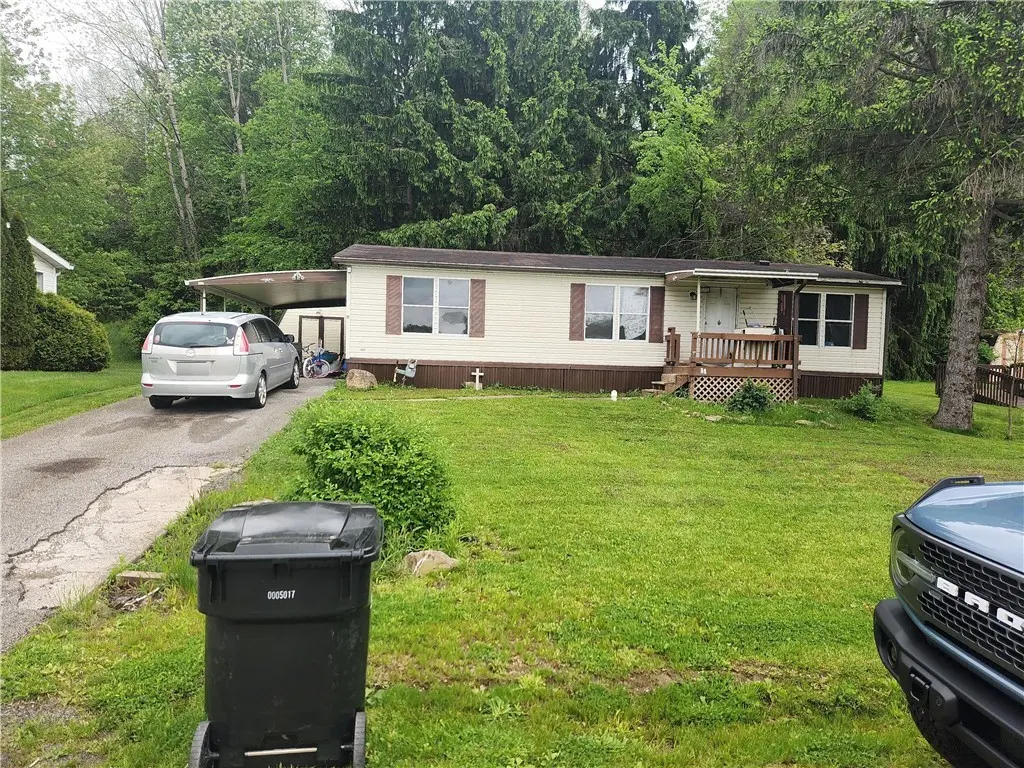
11 Pine Ct · South Beaver, PA
Flood risk 4/10 · Minor
- FEMA flood zone
- X (unshaded)
- Chance of flooding over 30 yrs
- 0.24%
- Est. flood insurance / yr
- $507 – $1,088
Fire risk 1/10 · Minimal
- Est. fire insurance / yr
- $511 – $949
Heat risk 3/10 · Minor
- Hot days now (above 95°F)
- 7 days/yr
- Hot days in 30 yrs
- 18 days/yr
Wind risk 2/10 · Minimal
- Chance of severe wind over 30 yrs
- —
Air-quality risk 3/10 · Minor
- Unhealthy air days now
- 2 days/yr
- Unhealthy air days in 30 yrs
- 4 days/yr
Risk factors via First Street. Map © Google.
Why this score? — see what drove the D+ grade
The composite is a weighted blend of 9 inputs, each scored 0–100. Each bar is that input's sub-score; the figure is the points it added to the 100-point composite (weight × sub-score).
- Cash flow +15.0/30.0
- ARV discount +7.5/15.0
- 1% rule +5.0/10.0
- DSCR +5.0/10.0
- Schools +4.4/10.0
- Rent growth +3.3/5.0
- Livability +2.5/5.0
- Condition / age +2.5/5.0
- Appreciation +0.0/10.0
$29,900
🖨 Deal sheet 📄 Offer letter ✓ Due diligence
Listing remarks MLS
Well maintained double wide mobile home -with 3 bedrooms - carport -shed -disabilty ramp - Move right in -Buyer subject to Pinehurst Estate Application Approval
Key facts
- Built 1991
- Listed 30 days
Property features AI
Exterior
- Parking: Off-street parking
- Utilities: Public water; Public sewer
- Home design: Single-story home
- Construction: Vinyl siding; Asphalt roof
Interior
- Bathrooms: 2 full bathrooms
- Heating & cooling: Electric heating; Heat pump; Central air conditioning
- Interior features: Resale condition
Neighborhood map
What this means for you Summary
Snapshot
- This is a 3-bed/2.0-bath manufactured listed at $30k.
Deal economics
- At list price, monthly cash flow is $774 ($9k/yr) — positive.
- The deal already cash-flows at list — no discount required.
- Meets the 1% rule at list price ($1k rent vs $30k).
- Recommended offer: $29k (1.5% below list) — sets the bar for market timing.
Location & tenants
- Location reads: area grade D — affects rentability + tenant quality, not the cash-flow math above.
- Blackhawk SD (rural): math 43% / reading 59% proficiency, ranked #157 of 539 in PA (top 29%) — acceptable for families but not a draw, mixed tenant base, ~2y average lease.
- Market conditions: Rents rising (+3.1%/yr); 143 active listings in the ZIP; 1 comparable units currently listed for rent nearby; 272 units permitted in Beaver County in 2024 (80 in 5+ unit buildings).
Forward outlook
- Local home prices are declining (-3.0%/yr); year-one equity from $207 of loan paydown is wiped out by about $897 of value loss. Plan a longer hold.
- Beaver County population projected at -14% by 2050 — secular population decline; favor cash flow + early exit over multi-decade hold.
- At projected returns (-3.0% appreciation + 3.1% rent growth), your $8k cash investment doubles in ~1 year — after that, you're playing with house money.
Negotiation context
- It's been on market 30 days — a 2% lower offer ($29k) is reasonable based on typical stale-listing flexibility.
- 2 sale attempts since 14y ago; this cycle's ask has dropped $10k (25%) from the opening price — seller is motivated, your offer sets the floor, not the list.
- Current owner paid $25k; 20% above their basis — modest negotiation headroom, anchor on the comps not their cost.
Questions for the listing agent
- Is there a deadline driving the sale (1031 exchange, divorce, estate, relocation)? That informs how much negotiation room exists.
- The area grade is low — what's the realistic commute time and amenity access for the typical tenant pool here? Any planned neighborhood developments (good or bad) we should know about?
- What's the average days-on-market for RENTAL listings here right now (not sales)? A rising rental-DOM trend means longer vacancies and softer asking-rent achievability than the comps imply.
- What's the recent tenant-quality profile in this submarket — average credit score on applications, eviction rate, late-payment / NSF rate, and stable-employment percentage? A property-management company in the area should have these aggregated.
- How much new for-sale + rental construction is in the pipeline within 1–3 miles? Heavy new supply typically softens prices + rents 12–24 months out; constrained supply supports both.
Investment metrics
- 1% rule
- 4.19% ✓
- Cap rate
- 37.36%
- Cash-on-cash
- 110.94%
- DSCR
- 5.94
- GRM
- 2.0
CMA / ARV
No comps found within radius.
Projected returns pro-forma
-3.0% appreciation · 3.07% rent growth · sell at horizon
- IRR
- —
- Equity multiple
- 6.32×
- Total profit
- $44,566
- Equity at exit
- $4,458
- IRR
- —
- Equity multiple
- 13.27×
- Total profit
- $102,749
- Equity at exit
- $2,585
Cash invested: $8,372 (down + closing). Projections, not guarantees.
Landlord ↔ Tenant lean methodology
- Overall (STATE)
- 62 Landlord-Friendly
- State Pennsylvania
- 62 Landlord-Friendly · EVEN
- County
- — inherits STATE
- City
- — inherits STATE
ZIP-level market 15010
- Home prices YoY
- -22.6%
- Rents YoY
- 3.1%
- Active inventory
- 143
- Price-to-rent
- 2.0×
Monthly cashflow live
- Estimated rent
- $1,253 medium interval (Pro) →
- Mortgage (P&I)
- −$157
- Tax from tax record
- −$47 /mo · $563/yr
- Insurance
- −$12
- HOA
- −$0
- Vacancy / Maint / Mgmt
- −$263
- Net cashflow
- $774
Break-even live
UW: 25.0% down · 7.5% · 30yr · 1.5% tax · 5.0% vac · 8.0% maint · 8.0% mgmt
Financing live
Cash to close
- Down payment
- $7,475
- Closing costs
- $897
- Reserves months
- —
- Total cash needed
- —
Loan-product check · same deal, 3 products live
Conventional
25% down · 7.5% · 30yr
- Down + closing
- —
- Monthly P&I
- —
- Monthly cashflow
- —
- DSCR
- —
- Eligible?
- —
Personal DTI + credit; lowest rate.
DSCR
20% down · 8.5% · 30yr
- Down + closing
- —
- Monthly P&I
- —
- Monthly cashflow
- —
- DSCR
- —
- Eligible?
- —
No personal income docs; deal must DSCR.
Hard money
10% down · 12.0% · 12mo
- Down + closing
- —
- Monthly P&I
- —
- Monthly cashflow
- —
- DSCR
- —
- Eligible?
- —
Short-term bridge; refi at stabilization.
Rent comps 1 comps
| Address | Beds | Baths | Sqft | Rent | $/sqft | DOM | Units | Dist |
|---|---|---|---|---|---|---|---|---|
| 116 Adams St Unit REAR Beaver Falls, PA | 3.0 | 2.0 | 1081 | $1,450 | $1.34 | 43d | 1 | 1.45mi |
Listing history 16 events
-
2026-06-18days on market $29,900 Active 30 DOM
-
2026-06-17days on market $29,900 Active 29 DOM
-
2026-06-16days on market $29,900 Active 28 DOM
-
2026-06-15days on market $29,900 Active 27 DOM
-
2026-06-13days on market $29,900 Active 25 DOM
-
2026-06-09days on market $29,900 Active 21 DOM
-
2026-06-08days on market $29,900 Active 20 DOM
-
2026-06-07days on market $29,900 Active 19 DOM
-
2026-06-03pricedays on market $29,900 Active 15 DOM
-
2026-06-02days on market $34,900 Active 14 DOM
-
2026-06-01days on market $34,900 Active 13 DOM
-
2026-05-31days on market $34,900 Active 12 DOM
-
2026-05-19$39,900 Active
-
2012-04-23price $24,900 160-char remark
Show marketing remark (160 chars)
Well maintained double wide mobile home -with 3 bedrooms - carport -shed -disabilty ramp - Move right in -Buyer subject to Pinehurst Estate Application Approval
-
2012-04-20soldstatus $25,000 160-char remark
Show marketing remark (160 chars)
Well maintained double wide mobile home -with 3 bedrooms - carport -shed -disabilty ramp - Move right in -Buyer subject to Pinehurst Estate Application Approval
-
2012-02-07$25,000 160-char remark
Show marketing remark (160 chars)
Well maintained double wide mobile home -with 3 bedrooms - carport -shed -disabilty ramp - Move right in -Buyer subject to Pinehurst Estate Application Approval
ⓘ Source: listings_history table (triggers on properties + properties_extension) + one-shot
backfill from property_details.listing_events for pre-trigger history.
Tax reassessment forecast PA · Partial reset (capped growth)
- Current annual tax
- $563 · $47/mo
- Projected year-2 tax
- $563 · $47/mo
- Expected delta
- $0/yr ($0/mo · 0.0%)
ⓘ Screening estimate from a state-policy table — verify with the county assessor before closing.
Climate risk First Street
- Flood 4/10 Moderate FEMA zone X (unshaded) · 24% chance over 30 yrs
- Wildfire 1/10 Low
- Heat 3/10 Moderate 7 d/yr ≥95°F today · 18 d/yr by 30 yrs out
- Wind 2/10 Low
- Air quality 3/10 Moderate 2 unhealthy d/yr today · 4 by 30 yrs out
Nearby sold comps map
Loading sold comps map…
Walkable amenities ~0.75 mi
Loading nearby amenities…
Taxation est. · year 1
- Rental income
- $15,040
- − Mortgage interest
- −$1,675
- − Property taxes
- −$563
- − Insurance
- −$150
- − Repairs & maintenance
- −$1,203
- − Management
- −$1,203
- − Depreciation
- −$870
- Taxable income
- $9,377
- Est. tax owed @ 24.0%
- −$2,251
- After-tax cash flow
- $7,038/yr
For passive investors: Depreciation is non-cash, so a rental often shows a tax loss while cash-flowing — sheltering income. Rental losses are passive: they offset passive income freely, and up to $25,000/yr can offset ordinary (W-2) income if you actively participate and your MAGI is under $100k (phasing out to $0 by $150k); unused losses carry forward. On sale, claimed depreciation is recaptured at up to 25%, and gains may owe capital-gains tax (a 1031 exchange can defer both). Figures are a year-1 estimate at your 24.0% rate — not tax advice; consult a CPA.
Schools (NCES district)
- District
- Blackhawk SD
- NCES district ID
- 4203688
- Math proficiency
- 43% ▼ -16.00%
- Reading proficiency
- 59% ▼ -13.00%
- Median HH income
- $55,517
- Composite
- 44.08/100
- National rank
- #2876
- State rank
- #157 of 539 in PA
Livability — South Beaver
No livability data for this city. (Only ~50 U.S. cities are tracked.)
Census & demographics
- County
- Beaver County · 116,001 people
- Metro
- Pittsburgh, PA
- Population (ZIP)
- 28,542
- Household income
- $71,200
- Rent vs Own
- Severe rent burden
- 519.0
Population outlook (Beaver County) Hauer SSP2
- Today (2025)
- 164,976 people
- By 2030
- 161,449 · -2.1%
- By 2040
- 151,752 · -8.0%
- By 2050
- 141,155 · -14.4%
- By 2075
- 118,142 · -28.4%
- By 2100
- 91,740 · -44.4%
Race, ethnicity, and origin ACS 2023
- Neighborhood character
- Predominantly White (85%)
- Race & ethnicity
- White 85% Black 9% Two or more races 4% Hispanic / Latino 1%
- Common ancestry
- Romanian 5% Slovak 2% Iranian 1%
- Foreign-born
- 2% · Canada
- Languages at home
- 98% English-only · Spanish 1%
Political lean MEDSL · Beaver
- 2024 margin
- Strong R (+20.7) · D 39.2% · R 59.9%
- 2008→2024 swing
- -17.9pp toward R · 2008: -2.8pp · 2024: -20.7pp
- All cycles
- 2024: R+20.7 2020: R+17.7 2016: R+20.1 2012: R+6.6 2008: R+2.8
Not yet ingested
- Civics
- —
Market trends
- HPI YoY
- ▼ -76.25%
- Current HPI
- 261.2703
- Rent YoY
- ▲ 3.07%
- Metro
- Pittsburgh, PA
- State GDP YoY
- ▲ 1.68%
- F500 in state
- 34
Industry mix (Fortune 500 HQ in PA)
| Industry | F500 HQs | Revenue |
|---|---|---|
| Healthcare | 2 | $309B |
|
||
| Insurance | 2 | $27B |
|
||
| Telecommunications / Media | 1 | $124B |
|
||
| Industrial Distribution | 1 | $22B |
|
||
| Financial Services | 1 | $20B |
|
||
| Chemicals / Materials | 1 | $18B |
|
||
Price history
+59.6% since first listed4 events — show timeline
- 2026-05-19 Listed $39,900 West Penn MLS
- 2012-04-23 Price Changed $24,900 West Penn MLS
- 2012-04-20 Sold (MLS) $25,000 West Penn MLS
- 2012-02-07 Listed $25,000 West Penn MLS
Property tax history
-4.3%/yrLatest (2026): $563 · +6.3% YoY. Source: county tax records.
Cash-flow waterfall
monthlySold comps — $/sqft
last 12 mo · ≤1 miLoading sold comps…