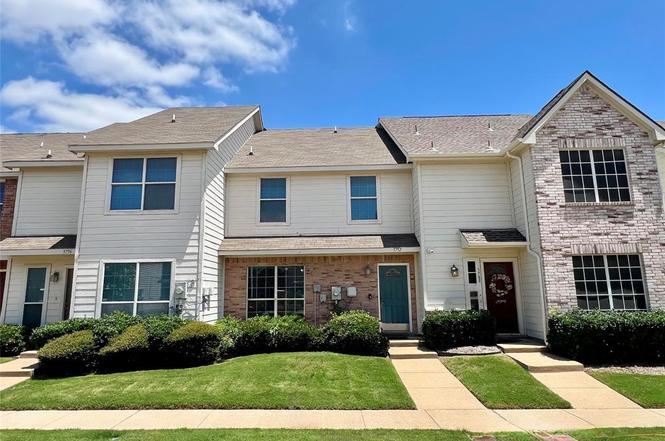
5752 Giddyup Ln · Fort Worth, TX
Flood risk 1/10 · Minimal
- FEMA flood zone
- X (unshaded)
- Chance of flooding over 30 yrs
- 0.0%
- Est. flood insurance / yr
- $507 – $1,088
Fire risk 3/10 · Minor
- Est. fire insurance / yr
- $1,222 – $2,270
Heat risk 7/10 · Major
- Hot days now (above 109°F)
- 7 days/yr
- Hot days in 30 yrs
- 23 days/yr
Wind risk 4/10 · Minor
- Chance of severe wind over 30 yrs
- 20.0%
Air-quality risk 3/10 · Minor
- Unhealthy air days now
- 3 days/yr
- Unhealthy air days in 30 yrs
- 4 days/yr
Risk factors via First Street. Map © Google.
Why this score? — see what drove the D grade
The composite is a weighted blend of 9 inputs, each scored 0–100. Each bar is that input's sub-score; the figure is the points it added to the 100-point composite (weight × sub-score).
- ARV discount +10.7/15.0
- Cash flow +10.1/30.0
- 1% rule +4.1/10.0
- Livability +4.0/5.0
- Schools +3.5/10.0
- DSCR +2.9/10.0
- Rent growth +2.9/5.0
- Condition / age +2.5/5.0
- Appreciation +0.0/10.0
$229,000
🖨 Deal sheet 📄 Offer letter ✓ Due diligence
Listing remarks MLS
Very Nice Townhome Located in growing area with Great amenities. This 3 Bed rm 2 Bath and half bath home has easy excess to Highways, Shopping, and close to Lake. Nice community with pool and playground for kids. Buyer and Buyers agent to verify all schools and Measurements.
Key facts
- $150 HOA
- 2 parking spots
- Built 2005
Property features AI
Finance
- Other: No known restrictions
- Financial info: Listing terms include Cash, Conventional, FHA, VA Loan, and Other
- HOA & community: Mandatory association; Monthly association fee of $150; Association covers front yard maintenance, grounds maintenance, and full use of facilities; HOA managed by Goodwin TX
Exterior
- Parking: Assigned parking; Carport (2 spaces); Two covered spaces; Open parking available
- Utilities: City water; City sewer; Municipal utility district
- Home design: Residential townhouse; Attached property; Two stories; Built in 2005; No accessibility features reported; Subdivision: Remington Point Add
- Construction: Brick and siding exterior; Composition roof; Slab foundation
- Exterior features: Playground; Community mailbox; Concrete and curbs
Interior
- Kitchen: Dishwasher; Disposal; Electric cooktop; Electric oven; Refrigerator; Pantry
- Bedrooms: Primary bedroom on level 2 (13 x 11); Bedroom on level 2 (11 x 9); Bedroom on level 2 (11 x 9)
- Flooring: Carpet; Ceramic tile
- Bathrooms: Two full bathrooms; One half bathroom; Total of three bathrooms
- Heating & cooling: Central heating (electric); Central air conditioning (electric)
- Interior features: Open floorplan; Decorative lighting; Pantry; Cable TV available; High speed internet available; 10 total rooms; One living area; One dining area; Two levels
- Laundry & utility: Washer; Utility room on level 1 (6 x 5); Electric water heater
Neighborhood map
What this means for you Summary
Snapshot
- This is a 3-bed/1.0-bath townhouse listed at $229k.
Deal economics
- At list price, monthly cash flow is $-136 ($-2k/yr) — negative.
- To cash-flow at today's rent, offer at most $205k (10.5% below list).
- To meet the 1% rule (rent ≥ 1% of price), the offer needs to be $209k (8.9% below list).
- Recommended offer: $205k (10.5% below list) — sets the bar for cash-flow.
- Cap rate 5.6% vs local median 3.9% in Fort Worth — top-decile yield for the area; either an underpriced asset or a hidden risk that comps aren't pricing in. Stress-test before assuming the spread holds.
Location & tenants
- Location reads 80/100 on livability (#49 in TX, #1,954 nationally) — a professional / high-income tenant draw. Strengths: amenities A+, cost of living A+, housing A+; Watch: schools D+, crime F.
- Eagle Mt-Saginaw ISD (urban): math 35% / reading 42% proficiency, ranked #361 of 826 in TX (top 44%) — families likely to look elsewhere, expect single-tenant / working-renter base with shorter leases.
- Market conditions: Rents rising (+1.5%/yr); 1050 active listings in the ZIP; 40 comparable units currently listed for rent nearby; rentals leasing fast (median 12d on market — plan ~1-2 weeks tenant-placement turnaround); solid renter incomes; 18,938 units permitted in Tarrant County in 2024 (8,336 in 5+ unit buildings).
Forward outlook
- Local home prices are declining (-3.0%/yr); year-one equity from $2k of loan paydown is wiped out by about $7k of value loss. Plan a longer hold.
- Tarrant County population projected at +41% by 2050 — long-run rental-demand tailwind backs the buy-and-hold thesis.
Negotiation context
- Only 1 days on market — expect competitive offers; lowballing is unlikely to land.
- 3 sale attempts since 13y ago with the ask held roughly flat each time — persistent listings suggest the price (not the market) is what's stuck; bring a comps-based counter.
Risks & watch-outs
- Climate carrying-cost: extreme-heat days projected 7→23/yr by 2055 (HVAC capex compounding) — expect insurance premiums to compound above CPI over the hold.
Questions for the listing agent
- What do current leases actually rent for vs. the listed asking? Can we see a recent rent roll and the last 12 months of T-12 income?
- What does the HOA fee cover, when was the last increase, and are there any pending special assessments or reserve-fund shortfalls?
- Is there a deadline driving the sale (1031 exchange, divorce, estate, relocation)? That informs how much negotiation room exists.
- Schools are D-rated, which usually means shorter tenancies and higher turnover. Who's the typical renter profile here, and what's been the actual vacancy rate?
- Crime grade is F in this area — have there been break-ins, vandalism, or insurance claims at this property in the last 3 years? What carrier currently insures it and at what premium?
- The area grade is low — what's the realistic commute time and amenity access for the typical tenant pool here? Any planned neighborhood developments (good or bad) we should know about?
- What's the average days-on-market for RENTAL listings here right now (not sales)? A rising rental-DOM trend means longer vacancies and softer asking-rent achievability than the comps imply.
- What's the recent tenant-quality profile in this submarket — average credit score on applications, eviction rate, late-payment / NSF rate, and stable-employment percentage? A property-management company in the area should have these aggregated.
- How much new for-sale + rental construction is in the pipeline within 1–3 miles? Heavy new supply typically softens prices + rents 12–24 months out; constrained supply supports both.
Investment metrics
- 1% rule
- 0.91% ✗
- Cap rate
- 5.58%
- Cash-on-cash
- -2.54%
- DSCR
- 0.89
- GRM
- 9.2
CMA / ARV
- ARV (on-the-fly)
- $246,656
- Comps found
- 4
Show comp detail 4 sales within ~0.75 mi
| Address | Dist | Beds/Ba | Sqft | Sold | Price | $/sf | Match |
|---|---|---|---|---|---|---|---|
| 5724 Giddyup Ln | 0.03mi | 3/2.5 | 1,321 (+1%) | 23mo | $249,900 | $189 | 72 |
| 5652 Giddyup Ln | 0.07mi | 4/2.5 (+1) | 1,465 (+12%) | 5mo | $235,000 | $160 | 62 |
| 5616 Giddyup Ln | 0.10mi | 2/2.5 (-1) | 1,200 (-8%) | 11mo | $225,000 | $188 | 61 |
| 5653 Giddyup Ln | 0.06mi | 2/2.5 (-1) | 1,160 (-12%) | 8mo | $204,900 | $177 | 60 |
Match score weights: distance 35% · size 25% · config 20% · recency 20%. Top-matched comps best support the ARV.
Projected returns pro-forma
-3.0% appreciation · 1.51% rent growth · sell at horizon
- IRR
- -22.3%
- Equity multiple
- 0.24×
- Total profit
- $-48,666
- Equity at exit
- $34,145
- IRR
- -21.1%
- Equity multiple
- -0.02×
- Total profit
- $-65,133
- Equity at exit
- $19,800
Cash invested: $64,120 (down + closing). Projections, not guarantees.
Landlord ↔ Tenant lean methodology
- Overall (STATE)
- 87 Strongly Landlord-Friendly
- State Texas
- 87 Strongly Landlord-Friendly · R+5
- County
- — inherits STATE
- City
- — inherits STATE
ZIP-level market 76179
- Rents YoY
- 1.5%
- Active inventory
- 1050
- Price-to-rent
- 9.2×
Monthly cashflow live
- Estimated rent
- $2,085 high interval (Pro) →
- Mortgage (P&I)
- −$1,201
- Tax from tax record
- −$336 /mo · $4,038/yr
- Insurance
- −$95
- HOA
- −$150
- Vacancy / Maint / Mgmt
- −$438
- Net cashflow
- $-136
Break-even live
UW: 25.0% down · 7.5% · 30yr · 1.5% tax · 5.0% vac · 8.0% maint · 8.0% mgmt
Financing live
Cash to close
- Down payment
- $57,250
- Closing costs
- $6,870
- Reserves months
- —
- Total cash needed
- —
Loan-product check · same deal, 3 products live
Conventional
25% down · 7.5% · 30yr
- Down + closing
- —
- Monthly P&I
- —
- Monthly cashflow
- —
- DSCR
- —
- Eligible?
- —
Personal DTI + credit; lowest rate.
DSCR
20% down · 8.5% · 30yr
- Down + closing
- —
- Monthly P&I
- —
- Monthly cashflow
- —
- DSCR
- —
- Eligible?
- —
No personal income docs; deal must DSCR.
Hard money
10% down · 12.0% · 12mo
- Down + closing
- —
- Monthly P&I
- —
- Monthly cashflow
- —
- DSCR
- —
- Eligible?
- —
Short-term bridge; refi at stabilization.
Rent comps 40 comps
| Address | Beds | Baths | Sqft | Rent | $/sqft | DOM | Units | Dist |
|---|---|---|---|---|---|---|---|---|
| 5744 Giddyup Ln Fort Worth, TX | 3.0 | 2.5 | 1321 | $1,750 | $1.32 | 24d | 1 | 0.03mi |
| 5624 Giddyup Ln Fort Worth, TX | 2.0 | 2.5 | 1160 | $1,700 | $1.47 | 11d | 1 | 0.07mi |
| 1225 Goodland Ter Fort Worth, TX | 3.0 | 2.0 | 1728 | $2,225 | $1.29 | 16d | 1 | 0.16mi |
| 6032 Blazing Star Dr Fort Worth, TX | 3.0 | 2.0 | 1667 | $2,171 | $1.30 | 7d | 1 | 0.17mi |
| 1016 Silver Spur Ln Fort Worth, TX | 3.0 | 2.0 | 1789 | $2,100 | $1.17 | 12d | 1 | 0.24mi |
| 1101 Longhorn Rd Unit 1138 Fort Worth, TX | 2.0 | 2.0 | 1162 | $1,730 | $1.49 | 2d | 1 | 0.29mi |
| 1101 Longhorn Rd Fort Worth, TX | 3.0 | 2.0 | 1315 | $2,120 | $1.61 | 11d | 1 | 0.29mi |
| 1101 Longhorn Rd Fort Worth, TX | 3.0 | 2.0 | 1315 | $1,915 | $1.46 | 2d | 1 | 0.29mi |
| 1101 Longhorn Rd Unit 1134 Fort Worth, TX | 3.0 | 2.0 | 1315 | $1,947 | $1.48 | 2d | 1 | 0.29mi |
| 5821 Comanche Peak Dr Fort Worth, TX | 3.0 | 2.0 | 1746 | $2,250 | $1.29 | 24d | 1 | 0.33mi |
| 912 Mosaic Dr Fort Worth, TX | 3.0 | 2.0 | 1868 | $2,170 | $1.16 | 24d | 1 | 0.39mi |
| 833 White Rock St Saginaw, TX | 3.0 | 2.0 | 1179 | $1,495 | $1.27 | 6d | 1 | 0.41mi |
| 733 Tuscany Trl Fort Worth, TX | 3.0 | 2.0 | 1518 | $1,845 | $1.22 | 3d | 1 | 0.52mi |
| 733 Tuscany Trl Fort Worth, TX | 3.0 | 2.0 | 1518 | $1,845 | $1.22 | 7d | 1 | 0.52mi |
| 1149 Landsdale Ln Saginaw, TX | 3.0 | 2.0 | 1179 | $1,495 | $1.27 | 12d | 1 | 0.54mi |
| 1149 Landsdale Ln Saginaw, TX | 3.0 | 2.0 | 1179 | $1,495 | $1.27 | 18d | 1 | 0.54mi |
| 709 Granite Ridge Dr Fort Worth, TX | 3.0 | 2.0 | 1868 | $1,995 | $1.07 | 18d | 1 | 0.55mi |
| 709 Granite Ridge Dr Fort Worth, TX | 3.0 | 2.0 | 1868 | $1,995 | $1.07 | 24d | 1 | 0.55mi |
| 1116 Landsdale Ln Saginaw, TX | 2.0 | 1.0 | 970 | $1,295 | $1.34 | 24d | 1 | 0.57mi |
| 716 Kentucky Derby Ln Fort Worth, TX | 3.0 | 2.0 | 1577 | $1,949 | $1.24 | 4d | 1 | 0.57mi |
| 717 Kentucky Derby Ln Fort Worth, TX | 3.0 | 2.0 | 1576 | $2,500 | $1.59 | 4d | 1 | 0.58mi |
| 1024 Green Ridge Ter Saginaw, TX | 3.0 | 2.0 | 1588 | $2,075 | $1.31 | 6d | 1 | 0.59mi |
| 1080 West Hills Ter Fort Worth, TX | 3.0 | 2.0 | 1617 | $1,850 | $1.14 | 24d | 1 | 0.69mi |
| 1080 West Hills Ter Fort Worth, TX | 3.0 | 2.0 | 1617 | $1,850 | $1.14 | 12d | 1 | 0.69mi |
| 512 Stallion Ln Saginaw, TX | 4.0 | 2.0 | 1538 | $2,050 | $1.33 | 18d | 1 | 0.74mi |
| 4710 Old Decatur Rd Fort Worth, TX | 1.0–2.0 | 1.0–2.0 | 916 | $1,898 | $2.07 | 2d | 78 | 0.77mi |
| 1040 Hillwood Dr Saginaw, TX | 3.0 | 2.0 | 1853 | $1,995 | $1.08 | 6d | 1 | 0.92mi |
| 6304 Downeast Dr Fort Worth, TX | 3.0 | 2.0 | 1587 | $1,900 | $1.20 | 12d | 1 | 0.96mi |
| 6316 Downeast Dr Fort Worth, TX | 3.0 | 2.0 | 1265 | $1,825 | $1.44 | 1d | 1 | 0.98mi |
| 306 Yorkshire Ct Saginaw, TX | 3.0 | 2.5 | 1667 | $2,459 | $1.48 | 6d | 1 | 1.01mi |
| 209 Wingfield Rd Saginaw, TX | 4.0 | 3.0 | 1865 | $2,649 | $1.42 | 6d | 1 | 1.01mi |
| 206 Wingfield Rd Saginaw, TX | 4.0 | 3.0 | 1865 | $2,649 | $1.42 | 6d | 1 | 1.01mi |
| 205 Hockliffe Ct Saginaw, TX | 3.0 | 2.5 | 1667 | $2,449 | $1.47 | 6d | 1 | 1.02mi |
| 202 Hockliffe Ct Saginaw, TX | 4.0 | 3.0 | 1865 | $2,559 | $1.37 | 12d | 1 | 1.02mi |
| 206 Hardwick Dr Saginaw, TX | 3.0–4.0 | 2.5–3.0 | 1747 | $2,299 | $1.32 | 5d | 1 | 1.03mi |
| 110 Cherwell Ct Saginaw, TX | 4.0 | 3.0 | 1865 | $2,599 | $1.39 | 12d | 1 | 1.06mi |
| 109 Cherwell Ct Saginaw, TX | 4.0 | 3.0 | 1865 | $2,599 | $1.39 | 12d | 1 | 1.06mi |
| 110 Kimberly Ct Saginaw, TX | 4.0 | 3.0 | 1865 | $2,549 | $1.37 | 22d | 1 | 1.06mi |
| 106 Cherwell Ct Saginaw, TX | 3.0 | 2.5 | 1667 | $2,489 | $1.49 | 6d | 1 | 1.07mi |
| 109 Kimberly Ct Saginaw, TX | 4.0 | 3.0 | 1865 | $2,579 | $1.38 | 22d | 1 | 1.07mi |
HOA detail
- Monthly dues
- $150 · $1,800/yr
- Likely covers
- pool
Listing history 2 events
-
2026-06-18remarks 699-char remark
-
2026-06-18$229,000 Active 1 DOM
ⓘ Source: listings_history table (triggers on properties + properties_extension) + one-shot
backfill from property_details.listing_events for pre-trigger history.
Tax reassessment forecast TX · Resets to sale price
- Current annual tax
- $4,038 · $336/mo
- Projected year-2 tax
- $4,191 · $349/mo
- Expected delta
- +$153/yr (+$13/mo · 3.8%)
ⓘ Screening estimate from a state-policy table — verify with the county assessor before closing.
Climate risk First Street
- Flood 1/10 Low FEMA zone X (unshaded) · 0% chance over 30 yrs
- Wildfire 3/10 Moderate
- Heat 7/10 Severe 7 d/yr ≥109°F today · 23 d/yr by 30 yrs out
- Wind 4/10 Moderate 20% chance of damaging wind over 30 yrs
- Air quality 3/10 Moderate 3 unhealthy d/yr today · 4 by 30 yrs out
Nearby sold comps map
Loading sold comps map…
Walkable amenities ~0.75 mi
Loading nearby amenities…
Taxation est. · year 1
- Rental income
- $25,021
- − Mortgage interest
- −$12,828
- − Property taxes
- −$4,038
- − Insurance
- −$1,145
- − Repairs & maintenance
- −$2,002
- − Management
- −$2,002
- − HOA
- −$1,800
- − Depreciation
- −$6,662
- Taxable loss
- −$5,454
- Est. tax savings @ 24.0%
- +$1,309
- After-tax cash flow
- $-318/yr
For passive investors: Depreciation is non-cash, so a rental often shows a tax loss while cash-flowing — sheltering income. Rental losses are passive: they offset passive income freely, and up to $25,000/yr can offset ordinary (W-2) income if you actively participate and your MAGI is under $100k (phasing out to $0 by $150k); unused losses carry forward. On sale, claimed depreciation is recaptured at up to 25%, and gains may owe capital-gains tax (a 1031 exchange can defer both). Figures are a year-1 estimate at your 24.0% rate — not tax advice; consult a CPA.
Schools (NCES district)
- District
- Eagle Mt-Saginaw ISD
- NCES district ID
- 4817700
- Math proficiency
- 35% ▼ -16.00%
- Reading proficiency
- 42% ▼ -9.00%
- Median HH income
- $72,781
- Composite
- 35.41/100
- National rank
- #4945
- State rank
- #361 of 826 in TX
Livability — Fort Worth
- Score
- 80/100
- State rank
- #49
- US rank
- #1954
Category grades
Schools grade is shown separately in the Schools card above.
Census & demographics
- Census place
- Fort Worth, TX
- County
- Tarrant County · 2,033,669 people
- City population
- 911,619
- Metro
- Dallas-Fort Worth-Arlington, TX
- Population (ZIP)
- 80,090
- Household income
- $107,428
- Rent vs Own
- Severe rent burden
- 1494.0
Population outlook (Tarrant County) Hauer SSP2
- Today (2025)
- 2,380,417 people
- By 2030
- 2,578,900 · +8.3%
- By 2040
- 2,974,995 · +25.0%
- By 2050
- 3,350,489 · +40.8%
- By 2075
- 4,216,909 · +77.2%
- By 2100
- 4,741,527 · +99.2%
Race, ethnicity, and origin ACS 2023
- Neighborhood character
- Diverse neighborhood (Simpson 0.63)
- Race & ethnicity
- White 53% Hispanic / Latino 28% Two or more races 14% Black 12% Asian 4%
- Hispanic origin (detail)
- Mexican 22% Puerto Rican 2%
- Common ancestry
- Slovak 2% Lithuanian 2% Italian 1%
- Foreign-born
- 8% · Canada, Jamaica
- Languages at home
- 81% English-only · Spanish 15% Other Asian/Pacific 2% Other Indo-European 1%
Political lean MEDSL · Tarrant
- 2024 margin
- Lean R (+5.1) · D 46.7% · R 51.9% · Other 1.4%
- 2008→2024 swing
- +6.6pp toward D · 2008: -11.7pp · 2024: -5.1pp
- All cycles
- 2024: R+5.1 2020: D+0.2 2016: R+8.7 2012: R+15.7 2008: R+11.7
Not yet ingested
- Civics
- —
Market trends
- HPI YoY
- ▼ -137.12%
- Current HPI
- 237.6676
- Rent YoY
- ▲ 1.51%
- Metro
- Dallas-Fort Worth-Arlington, TX
- State GDP YoY
- ▲ 3.95%
- F500 in state
- 110
Industry mix (Fortune 500 HQ in TX)
| Industry | F500 HQs | Revenue |
|---|---|---|
| Energy | 16 | $1,198B |
|
||
| Technology | 5 | $198B |
|
||
| Engineering / Construction | 4 | $72B |
|
||
| Energy Services | 3 | $60B |
|
||
| Utilities | 3 | $41B |
|
||
| Healthcare | 2 | $330B |
|
||
Price history
+205.7% since first listed11 events — show timeline
- 2026-06-18 Listed $229,000 NTREIS
- 2022-08-06 Price Changed $1,650 RENT.
- 2015-11-09 Sold (Public Records) — Public Records
- 2015-10-23 Sold (Public Records) — Public Records
- 2015-10-19 Sold (MLS) — NTREIS
- 2015-09-05 Pending — NTREIS
- 2015-08-29 Contingent — NTREIS
- 2015-08-01 Listed $86,000 NTREIS
- 2013-11-06 Listing Removed — NTREIS
- 2013-07-26 Listed $74,900 NTREIS
- 2005-04-06 Sold (Public Records) — Public Records
Property tax history
+3.1%/yrLatest (2025): $4,038 · -16.6% YoY. Source: county tax records.
Cash-flow waterfall
monthlySold comps — $/sqft
last 12 mo · ≤1 miLoading sold comps…