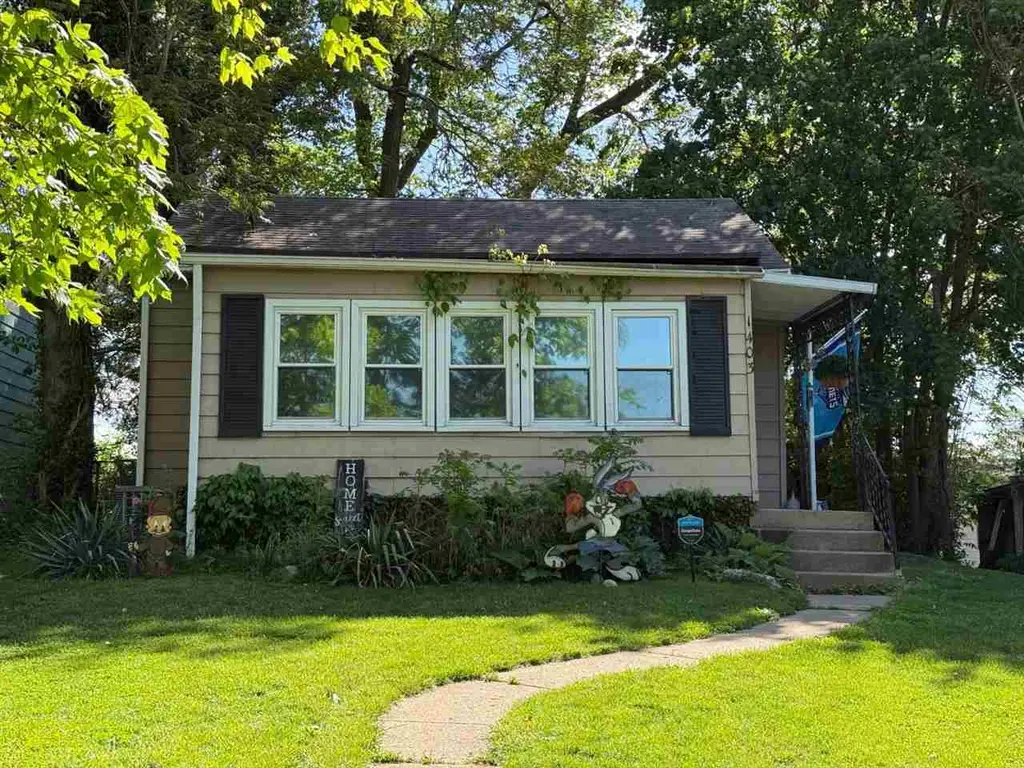
1403 Ratliff St · Richmond, IN
Flood risk 1/10 · Minimal
- FEMA flood zone
- X (unshaded)
- Chance of flooding over 30 yrs
- 0.0%
- Est. flood insurance / yr
- $473 – $860
Fire risk 1/10 · Minimal
- Est. fire insurance / yr
- $717 – $1,331
Heat risk 3/10 · Minor
- Hot days now (above 100°F)
- 7 days/yr
- Hot days in 30 yrs
- 18 days/yr
Wind risk 2/10 · Minimal
- Chance of severe wind over 30 yrs
- 1.0%
Air-quality risk 3/10 · Minor
- Unhealthy air days now
- 2 days/yr
- Unhealthy air days in 30 yrs
- 3 days/yr
Risk factors via First Street. Map © Google.
Why this score? — see what drove the C- grade
The composite is a weighted blend of 9 inputs, each scored 0–100. Each bar is that input's sub-score; the figure is the points it added to the 100-point composite (weight × sub-score).
- Cash flow +25.3/30.0
- DSCR +8.3/10.0
- 1% rule +5.8/10.0
- Livability +4.2/5.0
- Rent growth +2.5/5.0
- Condition / age +2.5/5.0
- Schools +1.9/10.0
- ARV discount +0.0/15.0
- Appreciation +0.0/10.0
$85,000
🖨 Deal sheet 📄 Offer letter ✓ Due diligence
Listing remarks
Cozy and affordable 2 bed, 1 bath home located on the northwest side of town! This charming property features updated electrical, a newer hot water heater, and a comfortable layout perfect for first-time buyers, downsizers, or investors. Conveniently located near shopping, dining, and everyday amenities, this home offers both value and potential.
Key facts
- Updated electrical
- Comfortable layout
- 5,208 sq ft lot
Tags
Property features AI
Exterior
- Utilities: Public water; Public sewer; Cable available
- Home design: Single-family residence; One story
- Construction: Aluminum siding
- Exterior features: Asphalt roof
Interior
- Kitchen: Electric range; Refrigerator
- Bedrooms: 5 total rooms (includes all living spaces)
- Bathrooms: 1 full bathroom
- Heating & cooling: Central air conditioning
- Interior features: Electric range; Refrigerator; Gas water heater; Partial crawl space basement
- Laundry & utility: Gas water heater
Neighborhood map
What this means for you Summary
Snapshot
- This is a 2-bed/1.0-bath single-family listed at $85k.
Deal economics
- At list price, monthly cash flow is $192 ($2k/yr) — positive.
- The deal already cash-flows at list — no discount required.
- Meets the 1% rule at list price ($918 rent vs $85k).
- Recommended offer: $84k (1.5% below list) — sets the bar for market timing.
- Cap rate 9.0% vs local median 5.2% in Richmond — top-decile yield for the area; either an underpriced asset or a hidden risk that comps aren't pricing in. Stress-test before assuming the spread holds.
Location & tenants
- Location reads 83/100 on livability (#10 in IN, #869 nationally) — a professional / high-income tenant draw. Strengths: commute A+, cost of living A+, housing A+; Watch: crime D+, employment D-.
- Richmond Community Schools (town): math 18% / reading 27% proficiency, ranked #270 of 301 in IN (top 90%) — low school quality limits family demand, transient renter base, plan for 1-2y turnover; 65% free/reduced lunch — lower-income household profile, screen leases tightly.
- Zoned schools: Fairview Elementary School (math 22% / reading 17%, grade F, #814 of 994 statewide, top 83%, 296 students, 90% FRL); Richmond High School (math 21% / reading 48%, grade F, #270 of 369 statewide, top 77%, 1,332 students, 66% FRL).
- Market conditions: 273 active listings in the ZIP; 1 comparable units currently listed for rent nearby; 38 units permitted in Wayne County in 2024 (0 in 5+ unit buildings).
Forward outlook
- Local home prices are declining (-3.0%/yr); year-one equity from $588 of loan paydown is wiped out by about $3k of value loss. Plan a longer hold.
- Wayne County population projected at -21% by 2050 — secular population decline; favor cash flow + early exit over multi-decade hold.
Negotiation context
- It's been on market 28 days — a 2% lower offer ($84k) is reasonable based on typical stale-listing flexibility.
Risks & watch-outs
- Watch-outs: built in 1940 — expect roof / HVAC / electrical / plumbing capex.
Questions for the listing agent
- Built in 1940 — when were the roof, HVAC, electrical panel, plumbing, and water heater last replaced?
- Is there a deadline driving the sale (1031 exchange, divorce, estate, relocation)? That informs how much negotiation room exists.
- Schools are D-rated, which usually means shorter tenancies and higher turnover. Who's the typical renter profile here, and what's been the actual vacancy rate?
- Crime grade is D in this area — have there been break-ins, vandalism, or insurance claims at this property in the last 3 years? What carrier currently insures it and at what premium?
- What's the average days-on-market for RENTAL listings here right now (not sales)? A rising rental-DOM trend means longer vacancies and softer asking-rent achievability than the comps imply.
- What's the recent tenant-quality profile in this submarket — average credit score on applications, eviction rate, late-payment / NSF rate, and stable-employment percentage? A property-management company in the area should have these aggregated.
- How much new for-sale + rental construction is in the pipeline within 1–3 miles? Heavy new supply typically softens prices + rents 12–24 months out; constrained supply supports both.
Investment metrics
- 1% rule
- 1.08% ✓
- Cap rate
- 9.00%
- Cash-on-cash
- 9.68%
- DSCR
- 1.43
- GRM
- 7.7
CMA / ARV
- ARV (on-the-fly)
- $70,587
- Comps found
- 7
Show comp detail 7 sales within ~0.75 mi
| Address | Dist | Beds/Ba | Sqft | Sold | Price | $/sf | Match |
|---|---|---|---|---|---|---|---|
| 1100 Harris St | 0.39mi | 2/1.0 | 720 (+1%) | 3mo | $48,000 | $67 | 78 |
| 1366 Harris St | 0.15mi | 2/1.0 | 775 (+9%) | 2mo | $125,000 | $161 | 77 |
| 1405 Ratliff St | 0.01mi | 2/1.0 | 807 (+13%) | 4mo | $30,000 | $37 | 74 |
| 1013 Butler St | 0.49mi | 2/1.0 | 672 (-6%) | 2mo | $82,500 | $123 | 66 |
| 1241 Boyer St | 0.20mi | 1/1.0 (-1) | 700 (-2%) | 20mo | $69,000 | $99 | 66 |
| 1318 Ratliff St | 0.12mi | 2/1.0 | 796 (+12%) | 18mo | $117,000 | $147 | 60 |
| 947 Sheridan St | 0.50mi | 2/1.0 | 798 (+12%) | 20mo | $60,000 | $75 | 40 |
Match score weights: distance 35% · size 25% · config 20% · recency 20%. Top-matched comps best support the ARV.
Projected returns pro-forma
-3.0% appreciation · 3.0% rent growth · sell at horizon
- IRR
- -1.7%
- Equity multiple
- 0.93×
- Total profit
- $-1,571
- Equity at exit
- $12,674
- IRR
- 7.9%
- Equity multiple
- 1.60×
- Total profit
- $14,292
- Equity at exit
- $7,349
Cash invested: $23,800 (down + closing). Projections, not guarantees.
Landlord ↔ Tenant lean methodology
- Overall (STATE)
- 90 Strongly Landlord-Friendly
- State Indiana
- 90 Strongly Landlord-Friendly · R+11
- County
- — inherits STATE
- City
- — inherits STATE
ZIP-level market 47374
- Active inventory
- 273
- Price-to-rent
- 7.7×
Monthly cashflow live
- Estimated rent
- $918 medium interval (Pro) →
- Mortgage (P&I)
- −$446
- Tax from tax record
- −$52 /mo · $629/yr
- Insurance
- −$35
- HOA
- −$0
- Vacancy / Maint / Mgmt
- −$193
- Net cashflow
- $192
Break-even live
UW: 25.0% down · 7.5% · 30yr · 1.5% tax · 5.0% vac · 8.0% maint · 8.0% mgmt
Financing live
Cash to close
- Down payment
- $21,250
- Closing costs
- $2,550
- Reserves months
- —
- Total cash needed
- —
Loan-product check · same deal, 3 products live
Conventional
25% down · 7.5% · 30yr
- Down + closing
- —
- Monthly P&I
- —
- Monthly cashflow
- —
- DSCR
- —
- Eligible?
- —
Personal DTI + credit; lowest rate.
DSCR
20% down · 8.5% · 30yr
- Down + closing
- —
- Monthly P&I
- —
- Monthly cashflow
- —
- DSCR
- —
- Eligible?
- —
No personal income docs; deal must DSCR.
Hard money
10% down · 12.0% · 12mo
- Down + closing
- —
- Monthly P&I
- —
- Monthly cashflow
- —
- DSCR
- —
- Eligible?
- —
Short-term bridge; refi at stabilization.
Rent comps 1 comps
| Address | Beds | Baths | Sqft | Rent | $/sqft | DOM | Units | Dist |
|---|---|---|---|---|---|---|---|---|
| 401 N 10th St Richmond, IN | 1.0–2.0 | 1.0 | 817 | $895 | $1.09 | 43d | 3 | 1.14mi |
Listing history 9 events
-
2026-06-09days on market $85,000 Active 28 DOM
-
2026-06-08days on market $85,000 Active 27 DOM
-
2026-06-07days on market $85,000 Active 26 DOM
-
2026-06-03days on market $85,000 Active 22 DOM
-
2026-06-02days on market $85,000 Active 21 DOM
-
2026-06-01days on market $85,000 Active 20 DOM
-
2026-05-31days on market $85,000 Active 19 DOM
-
2026-05-30days on market $85,000 Active 18 DOM
-
2026-05-11$85,000 Active
ⓘ Source: listings_history table (triggers on properties + properties_extension) + one-shot
backfill from property_details.listing_events for pre-trigger history.
Tax reassessment forecast IN · Partial reset (capped growth)
- Current annual tax
- $629 · $52/mo
- Projected year-2 tax
- $676 · $56/mo
- Expected delta
- +$47/yr (+$4/mo · 7.4%)
ⓘ Screening estimate from a state-policy table — verify with the county assessor before closing.
Climate risk First Street
- Flood 1/10 Low FEMA zone X (unshaded) · 0% chance over 30 yrs
- Wildfire 1/10 Low
- Heat 3/10 Moderate 7 d/yr ≥100°F today · 18 d/yr by 30 yrs out
- Wind 2/10 Low 100% chance of damaging wind over 30 yrs
- Air quality 3/10 Moderate 2 unhealthy d/yr today · 3 by 30 yrs out
Nearby sold comps map
Loading sold comps map…
Walkable amenities ~0.75 mi
Loading nearby amenities…
Taxation est. · year 1
- Rental income
- $11,020
- − Mortgage interest
- −$4,761
- − Property taxes
- −$629
- − Insurance
- −$425
- − Repairs & maintenance
- −$882
- − Management
- −$882
- − Depreciation
- −$2,473
- Taxable income
- $969
- Est. tax owed @ 24.0%
- −$232
- After-tax cash flow
- $2,070/yr
For passive investors: Depreciation is non-cash, so a rental often shows a tax loss while cash-flowing — sheltering income. Rental losses are passive: they offset passive income freely, and up to $25,000/yr can offset ordinary (W-2) income if you actively participate and your MAGI is under $100k (phasing out to $0 by $150k); unused losses carry forward. On sale, claimed depreciation is recaptured at up to 25%, and gains may owe capital-gains tax (a 1031 exchange can defer both). Figures are a year-1 estimate at your 24.0% rate — not tax advice; consult a CPA.
Schools (NCES district)
- District
- Richmond Community Schools
- NCES district ID
- 1809510
- Math proficiency
- 18% ▼ -7.00%
- Reading proficiency
- 27% ▼ -2.00%
- Median HH income
- $35,288
- Composite
- 18.55/100
- National rank
- #8913
- State rank
- #270 of 301 in IN
Livability — Richmond
- Score
- 83/100
- State rank
- #10
- US rank
- #869
Category grades
Schools grade is shown separately in the Schools card above.
Census & demographics
- Census place
- Richmond, IN
- County
- Wayne County · 44,615 people
- City population
- 44,615
- Metro
- Richmond, IN
- Population (ZIP)
- 44,615
- Household income
- $50,766
- Rent vs Own
- Severe rent burden
- 1600.0
Population outlook (Wayne County) Hauer SSP2
- Today (2025)
- 63,316 people
- By 2030
- 60,893 · -3.8%
- By 2040
- 55,386 · -12.5%
- By 2050
- 49,946 · -21.1%
- By 2075
- 37,900 · -40.1%
- By 2100
- 26,562 · -58.0%
Race, ethnicity, and origin ACS 2023
- Neighborhood character
- Predominantly White (82%)
- Race & ethnicity
- White 82% Two or more races 7% Black 6% Hispanic / Latino 4% Asian 1%
- Common ancestry
- Slovak 2% Italian 1% Lithuanian 1%
- Foreign-born
- 4% · Canada, China
- Languages at home
- 95% English-only · Spanish 3%
Political lean MEDSL · Wayne
- 2024 margin
- Solid R (+32.5) · D 32.9% · R 65.4% · Other 1.6%
- 2008→2024 swing
- -28.6pp toward R · 2008: -3.9pp · 2024: -32.5pp
- All cycles
- 2024: R+32.5 2020: R+29.1 2016: R+30.1 2012: R+14.7 2008: R+3.9
Not yet ingested
- Civics
- —
Market trends
- HPI YoY
- ▼ -118.64%
- Current HPI
- 182.5038
- Rent YoY
- —
- Metro
- Richmond, IN
- State GDP YoY
- ▲ 2.90%
- F500 in state
- 18
Industry mix (Fortune 500 HQ in IN)
| Industry | F500 HQs | Revenue |
|---|---|---|
| Industrial Machinery | 2 | $37B |
|
||
| Healthcare | 1 | $177B |
|
||
| Pharmaceuticals | 1 | $45B |
|
||
| Metals / Steel | 1 | $18B |
|
||
| Agriculture | 1 | $17B |
|
||
| Packaging | 1 | $12B |
|
||
Price history
1 event — show timeline
- 2026-05-11 Listed $85,000 RRELMS
Property tax history
-3.5%/yrLatest (2024): $629 · +13.7% YoY. Source: county tax records.
Cash-flow waterfall
monthlySold comps — $/sqft
last 12 mo · ≤1 miLoading sold comps…