 14-Plex
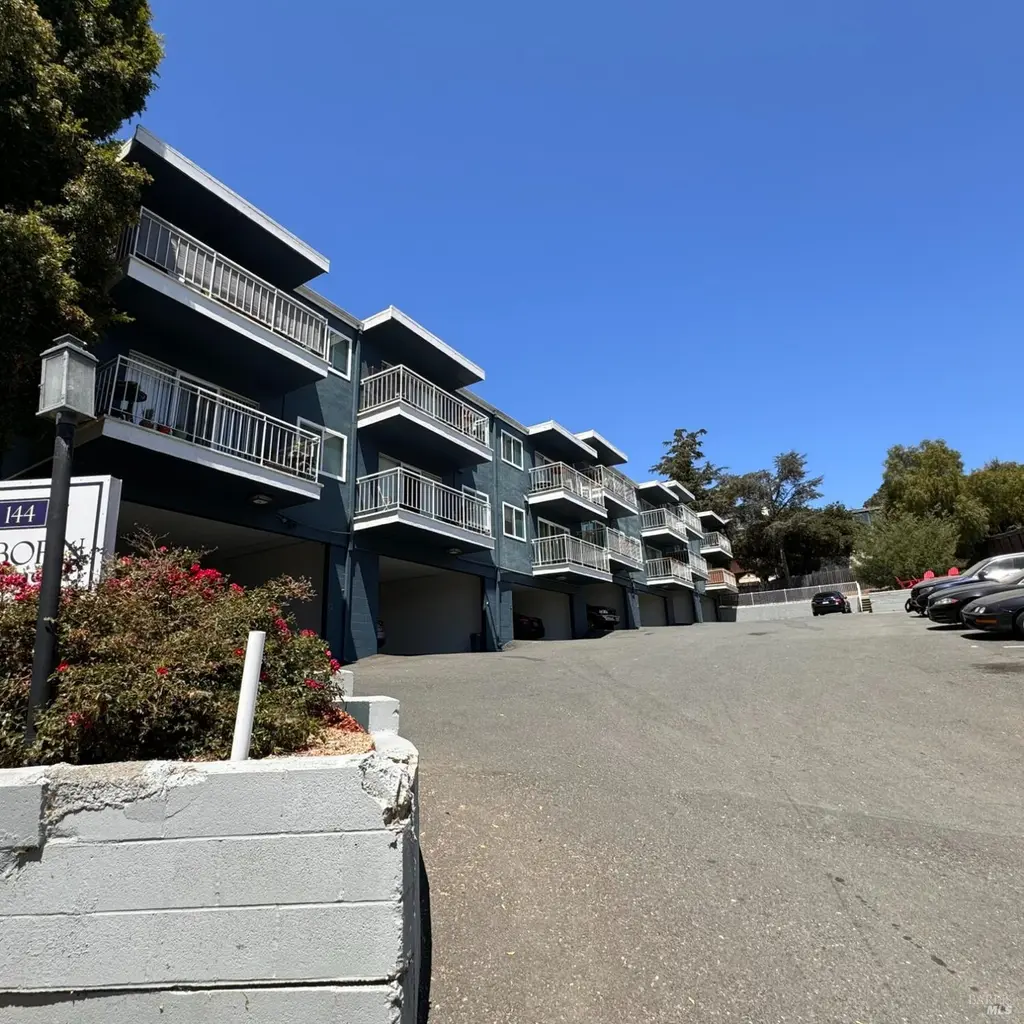
144 Hilborn St · Vallejo, CA
Flood risk 1/10 · Minimal
- FEMA flood zone
- X (unshaded)
- Chance of flooding over 30 yrs
- 0.0%
- Est. flood insurance / yr
- $507 – $1,088
Fire risk 3/10 · Minor
- Est. fire insurance / yr
- $659 – $1,223
Heat risk 4/10 · Minor
- Hot days now (above 93°F)
- 7 days/yr
- Hot days in 30 yrs
- 13 days/yr
Wind risk 1/10 · Minimal
- Chance of severe wind over 30 yrs
- —
Air-quality risk 8/10 · Major
- Unhealthy air days now
- 13 days/yr
- Unhealthy air days in 30 yrs
- 13 days/yr
Risk factors via First Street. Map © Google.
Why this score? — see what drove the C+ grade
The composite is a weighted blend of 9 inputs, each scored 0–100. Each bar is that input's sub-score; the figure is the points it added to the 100-point composite (weight × sub-score).
- Cash flow +24.3/30.0
- ARV discount +15.0/15.0
- DSCR +7.8/10.0
- 1% rule +6.6/10.0
- Livability +3.4/5.0
- Rent growth +2.7/5.0
- Schools +2.6/10.0
- Condition / age +2.5/5.0
- Appreciation +0.0/10.0
$1,995,000
🖨 Deal sheet 📄 Offer letter ✓ Due diligence
Multi-family units
County records classify this as Multi-Family (5+ Unit). Listing-text estimate: 14 units. confirmed
5+ unit building — per-unit beds/baths from public records are typically unavailable; the breakdown below (if shown) is an estimate from the listing text.
Listing remarks
Seller is committed to selling. 14-unit apartment property located at 144 Hilborn Street in Vallejo, California. The subject property consists of fourteen (14) one-bedroom, one-bathroom apartment units situated in the desirable Vallejo Heights neighborhood. The property features a highly efficient unit mix comprised entirely of 1x1 units, a consistently strong rental format that appeals to a wide range of tenants in the Vallejo rental market. The building offers investors a well-located multifamily asset positioned within close proximity to major employment centers, transportation corridors, the Vallejo waterfront, and elevated West facing views of the Napa River. 144 Hilborn Street present
Key facts
- Strong rental format
- Efficient unit mix
- 0.45 acre lot
Tags
Neighborhood map
What this means for you Summary
Snapshot
- This is a 14 × 1-bed/1-bath units multifamily listed at $2.00M.
Deal economics
- At list price, monthly cash flow is $4k ($48k/yr) — positive. Per door: $286/mo.
- The deal already cash-flows at list — no discount required.
- Meets the 1% rule at list price ($23k rent vs $2.00M).
- Recommended offer: $1.82M (9.0% below list) — sets the bar for market timing.
- Cap rate 8.7% vs local median 3.1% in Vallejo — top-decile yield for the area; either an underpriced asset or a hidden risk that comps aren't pricing in. Stress-test before assuming the spread holds.
Location & tenants
- Location reads 67/100 on livability (#304 in CA) — a middle-class / working-renter tenant base. Strengths: commute A+, housing A+, health & safety A+; Watch: schools D-, crime F, cost of living F.
- Vallejo City Unified (urban): math 20% / reading 30% proficiency, ranked #1,124 of 1,400 in CA (top 80%) — low school quality limits family demand, transient renter base, plan for 1-2y turnover; 62% free/reduced lunch — lower-income household profile, screen leases tightly.
- Market conditions: Rents flat; 176 active listings in the ZIP; 1,472 units permitted in Solano County in 2024 (131 in 5+ unit buildings).
- At $23,094/mo this rent would consume 424% of the median local household income ($65k/yr) (locally 2972% of renters already pay >50% of income on rent) — very limited rent-growth headroom before tenants either downsize or default.
Forward outlook
- Local home prices are declining (-3.0%/yr); year-one equity from $14k of loan paydown is wiped out by about $60k of value loss. Plan a longer hold.
- Solano County population projected at +15% by 2050 — modest demand growth; plan on rents tracking national, not racing it.
Negotiation context
- It's been on market 91 days — a 9% lower offer ($1.82M) is reasonable based on typical stale-listing flexibility.
- Current owner paid $1.35M; 48% above their basis — modest negotiation headroom, anchor on the comps not their cost.
Questions for the listing agent
- It's been on market 91 days. Have you received any prior offers? Is the seller open to a 9% concession, seller financing, or rate buy-down credit?
- Can we see the unit-by-unit rent roll, current vacancy, and any below-market leases? What's the average tenancy length?
- What capital expenditures (roof, boiler, parking lot, exteriors) have been made in the last 5 years, and what's planned in the next 2?
- Built in 1967 — when were the roof, HVAC, electrical panel, plumbing, and water heater last replaced?
- Why hasn't it sold? Are there any deal-killer items the seller is aware of (foundation, flood, title, zoning, code violations)?
- Is there a deadline driving the sale (1031 exchange, divorce, estate, relocation)? That informs how much negotiation room exists.
- Schools are D-rated, which usually means shorter tenancies and higher turnover. Who's the typical renter profile here, and what's been the actual vacancy rate?
- Crime grade is F in this area — have there been break-ins, vandalism, or insurance claims at this property in the last 3 years? What carrier currently insures it and at what premium?
- What's the average days-on-market for RENTAL listings here right now (not sales)? A rising rental-DOM trend means longer vacancies and softer asking-rent achievability than the comps imply.
- What's the recent tenant-quality profile in this submarket — average credit score on applications, eviction rate, late-payment / NSF rate, and stable-employment percentage? A property-management company in the area should have these aggregated.
- How much new apartment / multifamily construction is in the pipeline within 1–3 miles? Heavy new supply (>2% of stock underway) typically softens rents 12–24 months out; light construction supports rent growth.
Investment metrics
- 1% rule
- 1.16% ✓
- Cap rate
- 8.70%
- Cash-on-cash
- 8.61%
- DSCR
- 1.38
- GRM
- 7.2
CMA / ARV
- ARV (median comp)
- $2,408,725
- List price
- $1,995,000
- Delta
- -17.18%
- Verdict
- UNDERPRICED
- Comps
- 1 within 2.0 mi
Projected returns pro-forma
-3.0% appreciation · 0.71% rent growth · sell at horizon
- IRR
- -5.9%
- Equity multiple
- 0.79×
- Total profit
- $-119,553
- Equity at exit
- $297,461
- IRR
- 0.7%
- Equity multiple
- 1.04×
- Total profit
- $23,050
- Equity at exit
- $172,491
Cash invested: $558,600 (down + closing). Projections, not guarantees.
Landlord ↔ Tenant lean methodology
- Overall (STATE)
- 18 Strongly Tenant-Friendly
- State California
- 18 Strongly Tenant-Friendly · D+13
- County
- — inherits STATE
- City
- — inherits STATE
ZIP-level market 94590
- Rents YoY
- 0.7%
- Active inventory
- 176
- Price-to-rent
- 100.8×
Monthly cashflow live
- Estimated rent
- $23,094 high interval (Pro) →
- Mortgage (P&I)
- −$10,462
- Tax from tax record
- −$2,945 /mo · $35,345/yr
- Insurance
- −$831
- HOA
- −$0
- Vacancy / Maint / Mgmt
- −$4,850
- Net cashflow
- $4,006
Break-even live
14-unit breakdown (identical units grouped — click to expand)
| Units | Beds | Baths | Est. rent |
|---|---|---|---|
| 14× units | 1 | 1 | $23,100 |
| #1 | 1 | 1 | $1,650 |
| #2 | 1 | 1 | $1,650 |
| #3 | 1 | 1 | $1,650 |
| #4 | 1 | 1 | $1,650 |
| #5 | 1 | 1 | $1,650 |
| #6 | 1 | 1 | $1,650 |
| #7 | 1 | 1 | $1,650 |
| #8 | 1 | 1 | $1,650 |
| #9 | 1 | 1 | $1,650 |
| #10 | 1 | 1 | $1,650 |
| #11 | 1 | 1 | $1,650 |
| #12 | 1 | 1 | $1,650 |
| #13 | 1 | 1 | $1,650 |
| #14 | 1 | 1 | $1,650 |
| Total (14 units) | $23,094 | ||
UW: 25.0% down · 7.5% · 30yr · 1.5% tax · 5.0% vac · 8.0% maint · 8.0% mgmt
Financing live
Cash to close
- Down payment
- $498,750
- Closing costs
- $59,850
- Reserves months
- —
- Total cash needed
- —
Loan-product check · same deal, 3 products live
Conventional
25% down · 7.5% · 30yr
- Down + closing
- —
- Monthly P&I
- —
- Monthly cashflow
- —
- DSCR
- —
- Eligible?
- —
Personal DTI + credit; lowest rate.
DSCR
20% down · 8.5% · 30yr
- Down + closing
- —
- Monthly P&I
- —
- Monthly cashflow
- —
- DSCR
- —
- Eligible?
- —
No personal income docs; deal must DSCR.
Hard money
10% down · 12.0% · 12mo
- Down + closing
- —
- Monthly P&I
- —
- Monthly cashflow
- —
- DSCR
- —
- Eligible?
- —
Short-term bridge; refi at stabilization.
Listing history 18 events
-
2026-06-18days on market $1,995,000 Active 91 DOM
-
2026-06-17price $1,995,000 Active 90 DOM
-
2026-06-17days on market $2,100,000 Active 90 DOM
-
2026-06-16days on market $2,100,000 Active 89 DOM
-
2026-06-15days on market $2,100,000 Active 88 DOM
-
2026-06-14days on market $2,100,000 Active 86 DOM
-
2026-06-10days on market $2,100,000 Active 83 DOM
-
2026-06-09days on market $2,100,000 Active 82 DOM
-
2026-06-08days on market $2,100,000 Active 81 DOM
-
2026-06-07days on market $2,100,000 Active 80 DOM
-
2026-06-05days on market $2,100,000 Active 77 DOM
-
2026-06-03days on market $2,100,000 Active 76 DOM
-
2026-06-02days on market $2,100,000 Active 75 DOM
-
2026-06-01days on market $2,100,000 Active 74 DOM
-
2026-05-31days on market $2,100,000 Active 73 DOM
-
2026-05-30days on market $2,100,000 Active 72 DOM
-
2016-08-02soldstatus $1,350,000
-
1999-06-29soldstatus $560,000
ⓘ Source: listings_history table (triggers on properties + properties_extension) + one-shot
backfill from property_details.listing_events for pre-trigger history.
Tax reassessment forecast CA · Resets to sale price
- Current annual tax
- $35,345 · $2,945/mo
- Projected year-2 tax
- $35,345 · $2,945/mo
- Expected delta
- $0/yr ($0/mo · 0.0%)
ⓘ Screening estimate from a state-policy table — verify with the county assessor before closing.
Climate risk First Street
- Flood 1/10 Low FEMA zone X (unshaded) · 0% chance over 30 yrs
- Wildfire 3/10 Moderate
- Heat 4/10 Moderate 7 d/yr ≥93°F today · 13 d/yr by 30 yrs out
- Wind 1/10 Low
- Air quality 8/10 Severe 13 unhealthy d/yr today · 13 by 30 yrs out
Nearby sold comps map
Loading sold comps map…
Walkable amenities ~0.75 mi
Loading nearby amenities…
Taxation est. · year 1
- Rental income
- $277,128
- − Mortgage interest
- −$111,751
- − Property taxes
- −$35,345
- − Insurance
- −$9,975
- − Repairs & maintenance
- −$22,170
- − Management
- −$22,170
- − Depreciation
- −$58,036
- Taxable income
- $17,681
- Est. tax owed @ 24.0%
- −$4,243
- After-tax cash flow
- $43,824/yr
For passive investors: Depreciation is non-cash, so a rental often shows a tax loss while cash-flowing — sheltering income. Rental losses are passive: they offset passive income freely, and up to $25,000/yr can offset ordinary (W-2) income if you actively participate and your MAGI is under $100k (phasing out to $0 by $150k); unused losses carry forward. On sale, claimed depreciation is recaptured at up to 25%, and gains may owe capital-gains tax (a 1031 exchange can defer both). Figures are a year-1 estimate at your 24.0% rate — not tax advice; consult a CPA.
Schools (NCES district)
- District
- Vallejo City Unified
- NCES district ID
- 0640740
- Math proficiency
- 20% ▬ 0.00%
- Reading proficiency
- 30% ▬ 0.00%
- Median HH income
- $59,919
- Composite
- 26.02/100
- National rank
- #12743
- State rank
- #1124 of 1400 in CA
Livability — Vallejo
- Score
- 67/100
- State rank
- #304
- US rank
- #10215
Category grades
Schools grade is shown separately in the Schools card above.
Census & demographics
- Census place
- Vallejo, CA
- County
- Solano County · 433,239 people
- City population
- 125,311
- Metro
- Vallejo, CA
- Population (ZIP)
- 37,128
- Household income
- $65,290
- Rent vs Own
- Severe rent burden
- 2972.0
Population outlook (Solano County) Hauer SSP2
- Today (2025)
- 478,685 people
- By 2030
- 497,974 · +4.0%
- By 2040
- 528,515 · +10.4%
- By 2050
- 549,115 · +14.7%
- By 2075
- 587,229 · +22.7%
- By 2100
- 571,378 · +19.4%
Race, ethnicity, and origin ACS 2023
- Neighborhood character
- Highly diverse neighborhood (Simpson 0.77)
- Race & ethnicity
- Hispanic / Latino 32% White 26% Black 21% Two or more races 14% Asian 13% Native American 1%
- Hispanic origin (detail)
- Mexican 23%
- Common ancestry
- Lithuanian 2% Italian 1% Romanian 1%
- Foreign-born
- 25% · Canada, South Korea, China
- Languages at home
- 65% English-only · Spanish 21% Tagalog/Filipino 9% Other Indo-European 1%
Political lean MEDSL · Solano
- 2024 margin
- Strong D (+23.0) · D 60.0% · R 37.1% · Other 2.9%
- 2008→2024 swing
- -5.6pp toward R · 2008: 28.6pp · 2024: 23.0pp
- All cycles
- 2024: D+23.0 2020: D+30.3 2016: D+30.5 2012: D+28.1 2008: D+28.6
Not yet ingested
- Civics
- —
Market trends
- HPI YoY
- ▼ -530.45%
- Current HPI
- 321.0365
- Rent YoY
- ▲ 0.71%
- Metro
- Vallejo, CA
- State GDP YoY
- ▲ 3.21%
- F500 in state
- 116
Industry mix (Fortune 500 HQ in CA)
| Industry | F500 HQs | Revenue |
|---|---|---|
| Technology | 27 | $1,492B |
|
||
| Financial Services | 3 | $174B |
|
||
| Retail | 3 | $44B |
|
||
| Insurance | 3 | $26B |
|
||
| Media / Entertainment | 2 | $115B |
|
||
| Pharmaceuticals / Biotech | 2 | $62B |
|
||
Price history
+141.1% since first listed2 events — show timeline
- 2016-08-02 Sold (Public Records) $1,350,000 Public Records
- 1999-06-29 Sold (Public Records) $560,000 Public Records
Property tax history
+9.6%/yrLatest (2025): $35,345 · +8.0% YoY. Source: county tax records.
Cash-flow waterfall
monthlySold comps — $/sqft
last 12 mo · ≤1 miLoading sold comps…