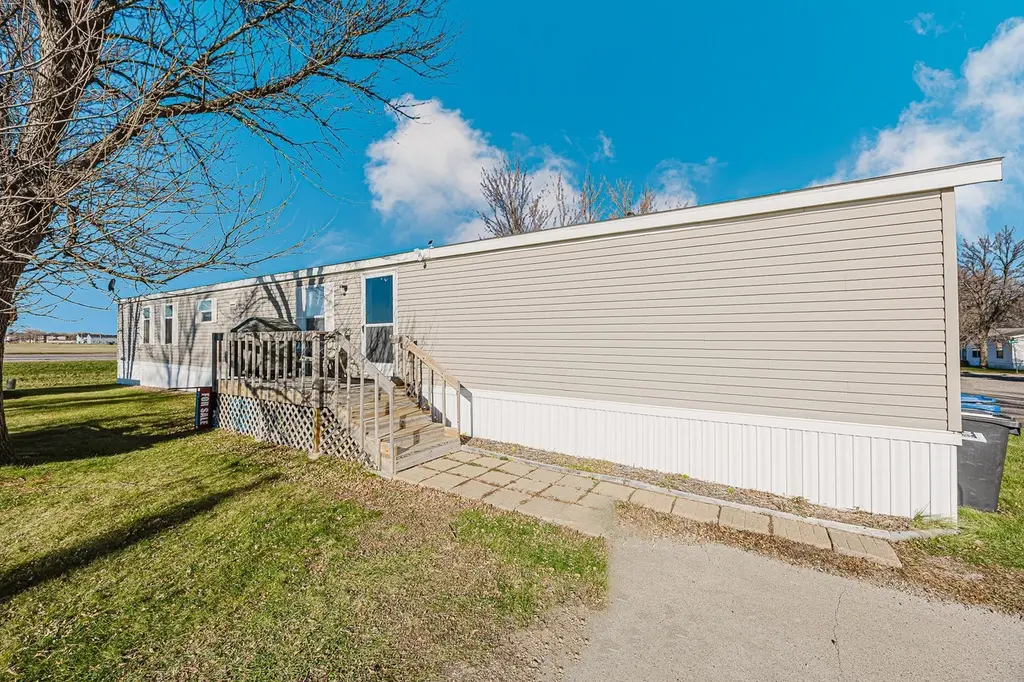
206 8th St NW · Dilworth, MN
Flood risk 1/10 · Minimal
- FEMA flood zone
- X (unshaded)
- Chance of flooding over 30 yrs
- 0.0%
- Est. flood insurance / yr
- $473 – $860
Fire risk 1/10 · Minimal
- Est. fire insurance / yr
- $888 – $1,650
Heat risk 2/10 · Minimal
- Hot days now (above 98°F)
- 7 days/yr
- Hot days in 30 yrs
- 12 days/yr
Wind risk 2/10 · Minimal
- Chance of severe wind over 30 yrs
- —
Air-quality risk 3/10 · Minor
- Unhealthy air days now
- 3 days/yr
- Unhealthy air days in 30 yrs
- 3 days/yr
Risk factors via First Street. Map © Google.
Why this score? — see what drove the B grade
The composite is a weighted blend of 9 inputs, each scored 0–100. Each bar is that input's sub-score; the figure is the points it added to the 100-point composite (weight × sub-score).
- Cash flow +30.0/30.0
- 1% rule +10.0/10.0
- DSCR +10.0/10.0
- ARV discount +7.5/15.0
- Schools +4.1/10.0
- Livability +3.6/5.0
- Condition / age +2.8/5.0
- Rent growth +2.5/5.0
- Appreciation +0.0/10.0
$46,900
🖨 Deal sheet 📄 Offer letter ✓ Due diligence
Listing remarks
Affordable living at its finest! This 3-bedroom, 2-bath home offers comfortable living spaces and a functional layout throughout. The primary bedroom features its own private bath and walk-in closet. The kitchen, dining, and living areas flow seamlessly together, creating an easy and open feel. Outside, enjoy the added convenience of a storage shed for all your extras. A great opportunity to make this home your own! Manufacturers date 2001- but updated by Victor Homes in 2020. Central Air replaced in 2020, kitchen cabinets painted 2026
Key facts
- Private bath
- Walk-in closet
- Storage shed
Tags
Neighborhood map
What this means for you Summary
Snapshot
- This is a 3-bed/2.0-bath single-family listed at $47k. Condition is rated average.
Deal economics
- At list price, monthly cash flow is $598 ($7k/yr) — positive.
- The deal already cash-flows at list — no discount required.
- Meets the 1% rule at list price ($1k rent vs $47k).
- Recommended offer: $46k (1.5% below list) — sets the bar for market timing.
- Cap rate 21.6% vs local median 4.0% in Dilworth — top-decile yield for the area; either an underpriced asset or a hidden risk that comps aren't pricing in. Stress-test before assuming the spread holds.
Location & tenants
- Location reads 72/100 on livability (#275 in MN) — a middle-class / working-renter tenant base. Strengths: housing A+, health & safety A+, employment A; Watch: crime F, amenities F, commute F.
- Dilworth-Glyndon-Felton (suburban): math 43% / reading 52% proficiency, ranked #144 of 301 in MN (top 48%) — families likely to look elsewhere, expect single-tenant / working-renter base with shorter leases.
- Market conditions: 34 active listings in the ZIP; 12 comparable units currently listed for rent nearby; rentals leasing fast (median 13d on market — plan ~1-2 weeks tenant-placement turnaround); 269 units permitted in Clay County in 2024 (153 in 5+ unit buildings).
Forward outlook
- Local home prices are declining (-3.0%/yr); year-one equity from $324 of loan paydown is wiped out by about $1k of value loss. Plan a longer hold.
- Clay County population projected at +23% by 2050 — long-run rental-demand tailwind backs the buy-and-hold thesis.
- At projected returns (-3.0% appreciation + 3.0% rent growth), your $13k cash investment doubles in ~3 years — after that, you're playing with house money.
Negotiation context
- It's been on market 29 days — a 2% lower offer ($46k) is reasonable based on typical stale-listing flexibility.
- 2 sale attempts; this cycle's ask has dropped $3k (6%) from the opening price — seller is motivated, your offer sets the floor, not the list.
Questions for the listing agent
- Is there a deadline driving the sale (1031 exchange, divorce, estate, relocation)? That informs how much negotiation room exists.
- Schools are A-rated — typically a magnet for longer-tenancy family renters. What's the average tenant stay here, and is there a school-zone premium baked into asking?
- Crime grade is F in this area — have there been break-ins, vandalism, or insurance claims at this property in the last 3 years? What carrier currently insures it and at what premium?
- What's the average days-on-market for RENTAL listings here right now (not sales)? A rising rental-DOM trend means longer vacancies and softer asking-rent achievability than the comps imply.
- What's the recent tenant-quality profile in this submarket — average credit score on applications, eviction rate, late-payment / NSF rate, and stable-employment percentage? A property-management company in the area should have these aggregated.
- How much new for-sale + rental construction is in the pipeline within 1–3 miles? Heavy new supply typically softens prices + rents 12–24 months out; constrained supply supports both.
Investment metrics
- 1% rule
- 2.49% ✓
- Cap rate
- 21.59%
- Cash-on-cash
- 54.65%
- DSCR
- 3.43
- GRM
- 3.3
CMA / ARV
No comps found within radius.
Projected returns pro-forma
-3.0% appreciation · 3.0% rent growth · sell at horizon
- IRR
- 52.9%
- Equity multiple
- 3.32×
- Total profit
- $30,505
- Equity at exit
- $6,993
- IRR
- 58.1%
- Equity multiple
- 6.76×
- Total profit
- $75,678
- Equity at exit
- $4,055
Cash invested: $13,132 (down + closing). Projections, not guarantees.
Landlord ↔ Tenant lean methodology
- Overall (STATE)
- 46 Balanced
- State Minnesota
- 46 Balanced · D+2
- County
- — inherits STATE
- City
- — inherits STATE
ZIP-level market 56529
- Home prices YoY
- -33.9%
- Active inventory
- 34
- Price-to-rent
- 3.3×
Monthly cashflow live
- Estimated rent
- $1,167 high interval (Pro) →
- Mortgage (P&I)
- −$246
- Tax est. 1.5%
- −$59 /mo · $704/yr
- Insurance
- −$20
- HOA
- −$0
- Vacancy / Maint / Mgmt
- −$245
- Net cashflow
- $598
Break-even live
UW: 25.0% down · 7.5% · 30yr · 1.5% tax · 5.0% vac · 8.0% maint · 8.0% mgmt
Financing live
Cash to close
- Down payment
- $11,725
- Closing costs
- $1,407
- Reserves months
- —
- Total cash needed
- —
Loan-product check · same deal, 3 products live
Conventional
25% down · 7.5% · 30yr
- Down + closing
- —
- Monthly P&I
- —
- Monthly cashflow
- —
- DSCR
- —
- Eligible?
- —
Personal DTI + credit; lowest rate.
DSCR
20% down · 8.5% · 30yr
- Down + closing
- —
- Monthly P&I
- —
- Monthly cashflow
- —
- DSCR
- —
- Eligible?
- —
No personal income docs; deal must DSCR.
Hard money
10% down · 12.0% · 12mo
- Down + closing
- —
- Monthly P&I
- —
- Monthly cashflow
- —
- DSCR
- —
- Eligible?
- —
Short-term bridge; refi at stabilization.
Rent comps 12 comps
| Address | Beds | Baths | Sqft | Rent | $/sqft | DOM | Units | Dist |
|---|---|---|---|---|---|---|---|---|
| 102 5th St NW Apt 5 Dilworth, MN | 2.0 | 1.0 | 850 | $1,100 | $1.29 | 20d | 1 | 0.17mi |
| 102 5th St NW Unit 18 Dilworth, MN | 3.0 | 1.0 | 975 | $1,295 | $1.33 | 13d | 1 | 0.17mi |
| 1609 3rd Ave NW Dilworth, MN | 1.0–3.0 | 1.0 | 839 | $1,120 | $1.33 | 13d | 1 | 0.45mi |
| 3450 8th Ave S Moorhead, MN | 2.0 | 2.0 | 1100 | $1,225 | $1.11 | 13d | 1 | 1.01mi |
| 3507 10th Ave S Moorhead, MN | 2.0 | 2.0 | 1032 | $1,225 | $1.19 | 13d | 1 | 1.17mi |
| 3501 10th Ave S Moorhead, MN | 1.0–2.0 | 1.0–2.0 | 887 | $1,225 | $1.38 | 20d | 3 | 1.19mi |
| 1009 3rd Ave NE Dilworth, MN | 2.0 | 2.0 | 1041 | $1,180 | $1.13 | 13d | 1 | 1.19mi |
| 2409 4th Ave N Unit 15 Moorhead, MN | 2.0 | 1.0 | 800 | $650 | $0.81 | 43d | 1 | 1.31mi |
| 221 12th St NE Dilworth, MN | 3.0 | 1.0–2.0 | 774 | $1,585 | $2.05 | 13d | 31 | 1.31mi |
| 1204 34th Street Cir S Apt 102 Moorhead, MN | 2.0 | 1.0 | 913 | $850 | $0.93 | 43d | 1 | 1.32mi |
| 1212 34th Street Cir S Unit 205 Moorhead, MN | 2.0 | 1.0 | 913 | $850 | $0.93 | 43d | 1 | 1.36mi |
| 222 14th St NE Dilworth, MN | 1.0–2.0 | 1.0 | 800 | $1,205 | $1.51 | 13d | 13 | 1.41mi |
Listing history 5 events
-
2026-04-22status Pending
-
2026-04-17price $46,900
-
2026-03-24$49,900 Active
-
2025-11-18historical
-
2025-11-13$46,900 Active
ⓘ Source: listings_history table (triggers on properties + properties_extension) + one-shot
backfill from property_details.listing_events for pre-trigger history.
Climate risk First Street
- Flood 1/10 Low FEMA zone X (unshaded) · 0% chance over 30 yrs
- Wildfire 1/10 Low
- Heat 2/10 Low 7 d/yr ≥98°F today · 12 d/yr by 30 yrs out
- Wind 2/10 Low
- Air quality 3/10 Moderate 3 unhealthy d/yr today · 3 by 30 yrs out
Nearby sold comps map
Loading sold comps map…
Walkable amenities ~0.75 mi
Loading nearby amenities…
Taxation est. · year 1
- Rental income
- $14,007
- − Mortgage interest
- −$2,627
- − Property taxes
- −$704
- − Insurance
- −$234
- − Repairs & maintenance
- −$1,121
- − Management
- −$1,121
- − Depreciation
- −$1,364
- Taxable income
- $6,836
- Est. tax owed @ 24.0%
- −$1,641
- After-tax cash flow
- $5,535/yr
For passive investors: Depreciation is non-cash, so a rental often shows a tax loss while cash-flowing — sheltering income. Rental losses are passive: they offset passive income freely, and up to $25,000/yr can offset ordinary (W-2) income if you actively participate and your MAGI is under $100k (phasing out to $0 by $150k); unused losses carry forward. On sale, claimed depreciation is recaptured at up to 25%, and gains may owe capital-gains tax (a 1031 exchange can defer both). Figures are a year-1 estimate at your 24.0% rate — not tax advice; consult a CPA.
Condition & rehab AI · 13 photos
This 3-bedroom, 2-bath home offers a comfortable living space with updated systems and a functional layout. While it has a cosmetic rehab level, some minor repairs and touch-ups are needed to enhance its value.
Repairs flagged
- Minor paint — paint appears worn in some areas
- Minor kitchen cabinets — paint needs touch-up
Value-add opportunities
- Resale painting the kitchen cabinets — Fresh paint can make a significant difference in the home's appearance
- Resale painting interior walls — Fresh paint can make a significant difference in the home's appearance
- Both upgrading countertops — Modern countertops can improve both resale and rental value
Renovation cost estimate screening
| Repair item | Severity | Est. cost |
|---|---|---|
| paint · paint appears worn in some areas | Minor | $500–3,000 |
| kitchen cabinets · paint needs touch-up | Minor | $500–3,000 |
| Total estimated repair cost · 2 items | $1,000–6,000 |
Value-add ROI direction
- Resale painting the kitchen cabinets — Fresh paint can make a significant difference in the home's appearance ↑
- Resale painting interior walls — Fresh paint can make a significant difference in the home's appearance ↑
- Both upgrading countertops — Modern countertops can improve both resale and rental value ↑
ⓘ Cost ranges are severity-bucket heuristics (US national rule-of-thumb). Get contractor quotes + a written scope before underwriting a rehab budget.
Schools (NCES district)
- District
- Dilworth-Glyndon-Felton
- NCES district ID
- 2710260
- Math proficiency
- 43% ▼ -14.00%
- Reading proficiency
- 52% ▼ -10.00%
- Median HH income
- $54,835
- Composite
- 41.14/100
- National rank
- #3557
- State rank
- #144 of 301 in MN
Livability — Dilworth
- Score
- 72/100
- State rank
- #275
- US rank
- #5975
Category grades
Schools grade is shown separately in the Schools card above.
Census & demographics
- Census place
- Dilworth, MN
- City population
- 4,664
- Population (ZIP)
- 4,664
Population outlook (Clay County) Hauer SSP2
- Today (2025)
- 67,880 people
- By 2030
- 70,881 · +4.4%
- By 2040
- 76,865 · +13.2%
- By 2050
- 83,205 · +22.6%
- By 2075
- 98,719 · +45.4%
- By 2100
- 111,657 · +64.5%
Race, ethnicity, and origin ACS 2023
- Neighborhood character
- Predominantly White (87%)
- Race & ethnicity
- White 87% Two or more races 7% Hispanic / Latino 6% Black 5%
- Hispanic origin (detail)
- Mexican 3%
- Common ancestry
- Portuguese 29% Scottish 6% Scotch-Irish 2%
- Foreign-born
- 2%
- Languages at home
- 89% English-only · Arabic 5% Spanish 3% Other Indo-European 2%
Political lean MEDSL · Clay
- 2024 margin
- Toss-up / Even · D 49.2% · R 48.8% · Other 2.0%
- 2008→2024 swing
- -15.5pp toward R · 2008: 16.0pp · 2024: 0.5pp
- All cycles
- 2024: D+0.5 2020: D+4.1 2016: R+2.0 2012: D+8.0 2008: D+16.0
Not yet ingested
- Civics
- —
Market trends
- HPI YoY
- ▼ -95.98%
- Current HPI
- 187.1235
- Rent YoY
- —
- Metro
- —
- State GDP YoY
- ▲ 2.41%
- F500 in state
- 34
Industry mix (Fortune 500 HQ in MN)
| Industry | F500 HQs | Revenue |
|---|---|---|
| Healthcare | 2 | $407B |
|
||
| Retail | 2 | $150B |
|
||
| Consumer Goods | 2 | $32B |
|
||
| Industrial Machinery | 2 | $6B |
|
||
| Agriculture | 1 | $40B |
|
||
| Healthcare / Medical Devices | 1 | $32B |
|
||
Price history
+0.0% since first listed5 events — show timeline
- 2026-04-22 Pending — NORTHSTARMLS as Distributed by MLS Grid
- 2026-04-17 Price Changed $46,900 NORTHSTARMLS as Distributed by MLS Grid
- 2026-03-24 Listed $49,900 NORTHSTARMLS as Distributed by MLS Grid
- 2025-11-18 Listing Removed — NORTHSTARMLS as Distributed by MLS Grid
- 2025-11-13 Listed $46,900 NORTHSTARMLS as Distributed by MLS Grid
Cash-flow waterfall
monthlySold comps — $/sqft
last 12 mo · ≤1 miLoading sold comps…