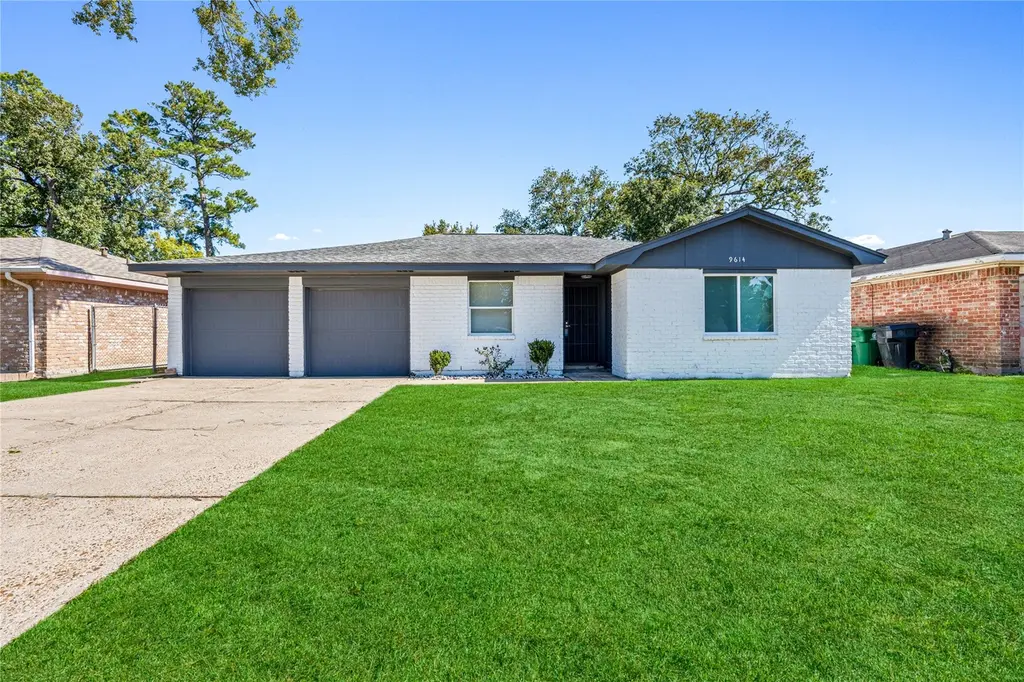
9614 Bean St · Houston, TX
Flood risk 4/10 · Minor
- FEMA flood zone
- X (unshaded)
- Chance of flooding over 30 yrs
- 0.2%
- Est. flood insurance / yr
- $507 – $1,088
Fire risk 4/10 · Minor
- Est. fire insurance / yr
- $1,222 – $2,270
Heat risk 9/10 · Severe
- Hot days now (above 111°F)
- 7 days/yr
- Hot days in 30 yrs
- 25 days/yr
Wind risk 9/10 · Severe
- Chance of severe wind over 30 yrs
- 99.0%
Air-quality risk 3/10 · Minor
- Unhealthy air days now
- 3 days/yr
- Unhealthy air days in 30 yrs
- 3 days/yr
Risk factors via First Street. Map © Google.
Why this score? — see what drove the F grade
The composite is a weighted blend of 9 inputs, each scored 0–100. Each bar is that input's sub-score; the figure is the points it added to the 100-point composite (weight × sub-score).
- Cash flow +6.6/30.0
- Appreciation +6.2/10.0
- Livability +3.7/5.0
- Schools +2.7/10.0
- Rent growth +2.5/5.0
- Condition / age +2.5/5.0
- 1% rule +1.8/10.0
- DSCR +0.9/10.0
- ARV discount +0.0/15.0
$237,489
🖨 Deal sheet 📄 Offer letter ✓ Due diligence
Listing remarks MLS
Move-in ready and fully renovated! This charming home features brand-new windows, fresh paint inside and out, updated flooring, and remodeled bathrooms. Ideal for first-time buyers! Located in a well-kept community with easy access to major freeways. Don’t miss this great opportunity!
Key facts
- Fresh paint
- Updated flooring
- Well-kept community
Tags
Neighborhood map
What this means for you Summary
Snapshot
- This is a 3-bed/2.0-bath single-family listed at $237k.
Deal economics
- At list price, monthly cash flow is $-389 ($-5k/yr) — negative.
- To cash-flow at today's rent, offer at most $169k (28.9% below list).
- To meet the 1% rule (rent ≥ 1% of price), the offer needs to be $162k (31.9% below list).
- Recommended offer: $162k (31.9% below list) — sets the bar for 1% rule.
- Cap rate 4.3% vs local median 3.2% in Houston — top-decile yield for the area; either an underpriced asset or a hidden risk that comps aren't pricing in. Stress-test before assuming the spread holds.
Location & tenants
- Location reads 74/100 on livability (#184 in TX, #4,771 nationally) — a middle-class / working-renter tenant base. Strengths: amenities A+, cost of living A+, housing A+; Watch: schools D, crime F.
- Houston ISD (urban): math 27% / reading 35% proficiency, ranked #593 of 826 in TX (top 72%) — families likely to look elsewhere, expect single-tenant / working-renter base with shorter leases; 71% free/reduced lunch — lower-income household profile, screen leases tightly.
- Market conditions: 129 active listings in the ZIP; 40 comparable units currently listed for rent nearby; rentals lingering (median 44d on market — plan ~5-8 weeks vacancy on turnover, expect pricing pressure); 52% of comp listings sitting > 30 days — soft ceiling on asking rent; lower-income renter base — watch delinquency; 29,883 units permitted in Harris County in 2024 (8,621 in 5+ unit buildings).
- At $1,618/mo this rent would consume 50% of the median local household income ($39k/yr) (locally 780% of renters already pay >50% of income on rent) — very limited rent-growth headroom before tenants either downsize or default.
Forward outlook
- In year one you build about $8k of equity ($2k loan paydown + $6k appreciation (2.5% local appreciation)).
- Harris County population projected at +47% by 2050 — long-run rental-demand tailwind backs the buy-and-hold thesis.
- By year 5, paydown + projected appreciation supports a ~$33k cash-out refi (75% LTV) — recoverable capital for the next deal without selling this one.
Negotiation context
- It's been on market 21 days — a 2% lower offer ($234k) is reasonable based on typical stale-listing flexibility.
- 6 sale attempts since 2y ago; this cycle's ask has dropped $18k (7%) from the opening price — seller is motivated, your offer sets the floor, not the list.
Risks & watch-outs
- Climate carrying-cost: severe wind risk, 99% chance of damaging wind over 30y; extreme-heat days projected 7→25/yr by 2055 (HVAC capex compounding) — expect insurance premiums to compound above CPI over the hold.
Questions for the listing agent
- What do current leases actually rent for vs. the listed asking? Can we see a recent rent roll and the last 12 months of T-12 income?
- Built in 1975 — when were the roof, HVAC, electrical panel, plumbing, and water heater last replaced?
- Is there a deadline driving the sale (1031 exchange, divorce, estate, relocation)? That informs how much negotiation room exists.
- Schools are D-rated, which usually means shorter tenancies and higher turnover. Who's the typical renter profile here, and what's been the actual vacancy rate?
- Crime grade is F in this area — have there been break-ins, vandalism, or insurance claims at this property in the last 3 years? What carrier currently insures it and at what premium?
- The area grade is low — what's the realistic commute time and amenity access for the typical tenant pool here? Any planned neighborhood developments (good or bad) we should know about?
- What's the average days-on-market for RENTAL listings here right now (not sales)? A rising rental-DOM trend means longer vacancies and softer asking-rent achievability than the comps imply.
- What's the recent tenant-quality profile in this submarket — average credit score on applications, eviction rate, late-payment / NSF rate, and stable-employment percentage? A property-management company in the area should have these aggregated.
- How much new for-sale + rental construction is in the pipeline within 1–3 miles? Heavy new supply typically softens prices + rents 12–24 months out; constrained supply supports both.
Investment metrics
- 1% rule
- 0.68% ✗
- Cap rate
- 4.33%
- Cash-on-cash
- -7.02%
- DSCR
- 0.69
- GRM
- 12.2
CMA / ARV
- ARV (median comp)
- $193,095
- List price
- $237,489
- Delta
- 22.99%
- Verdict
- OVERPRICED
- Comps
- 17 within 1.0 mi
Show comp detail 12 sales within ~0.75 mi
| Address | Dist | Beds/Ba | Sqft | Sold | Price | $/sf | Match |
|---|---|---|---|---|---|---|---|
| 8410 Rinn St | 0.11mi | 3/2.0 | 1,354 (-5%) | 4mo | $169,900 | $125 | 82 |
| 9627 Glenwood Forest Dr | 0.03mi | 3/2.0 | 1,552 (+8%) | 3mo | $195,000 | $126 | 82 |
| 9606 Guest St | 0.23mi | 3/2.0 | 1,383 (-3%) | 4mo | $230,000 | $166 | 81 |
| 8702 Rinn St | 0.41mi | 3/2.0 | 1,358 (-5%) | 1mo | $189,900 | $140 | 72 |
| 8414 Rinn St | 0.11mi | 4/1.5 (+1) | 1,253 (-12%) | 2mo | $190,000 | $152 | 66 |
| 8347 Sterlingshire St | 0.25mi | 3/2.0 | 1,638 (+14%) | 4mo | $195,000 | $119 | 61 |
| 8522 Rinn St | 0.23mi | 4/2.0 (+1) | 1,600 (+12%) | 5mo | $139,000 | $87 | 60 |
| 7909 Elisha Park Dr | 0.58mi | 3/2.0 | 1,544 (+8%) | 2mo | $250,000 | $162 | 58 |
| 9606 Jenny Park Pl | 0.53mi | 3/2.5 | 1,609 (+12%) | 1mo | $254,000 | $158 | 51 |
| 7907 Elisha Park Dr | 0.55mi | 3/2.5 | 1,609 (+12%) | 4mo | $254,000 | $158 | 49 |
| 7911 Elisha Park Dr | 0.56mi | 3/2.5 | 1,609 (+12%) | 4mo | $254,000 | $158 | 48 |
| 8009 Bigwood St | 0.55mi | 3/2.0 | 1,628 (+14%) | 4mo | $295,000 | $181 | 47 |
Match score weights: distance 35% · size 25% · config 20% · recency 20%. Top-matched comps best support the ARV.
Projected returns pro-forma
2.5% appreciation · 3.0% rent growth · sell at horizon
- IRR
- -0.6%
- Equity multiple
- 0.96×
- Total profit
- $-2,388
- Equity at exit
- $100,124
- IRR
- 3.5%
- Equity multiple
- 1.52×
- Total profit
- $34,262
- Equity at exit
- $149,312
Cash invested: $66,497 (down + closing). Projections, not guarantees.
Landlord ↔ Tenant lean methodology
- Overall (STATE)
- 87 Strongly Landlord-Friendly
- State Texas
- 87 Strongly Landlord-Friendly · R+5
- County
- — inherits STATE
- City
- — inherits STATE
ZIP-level market 77078
- Home prices YoY
- 0.8%
- Active inventory
- 129
- Price-to-rent
- 12.2×
Monthly cashflow live
- Estimated rent
- $1,618 high interval (Pro) →
- Mortgage (P&I)
- −$1,245
- Tax from tax record
- −$323 /mo · $3,878/yr
- Insurance
- −$99
- HOA
- −$0
- Vacancy / Maint / Mgmt
- −$340
- Net cashflow
- $-389
Break-even live
UW: 25.0% down · 7.5% · 30yr · 1.5% tax · 5.0% vac · 8.0% maint · 8.0% mgmt
Financing live
Cash to close
- Down payment
- $59,372
- Closing costs
- $7,125
- Reserves months
- —
- Total cash needed
- —
Loan-product check · same deal, 3 products live
Conventional
25% down · 7.5% · 30yr
- Down + closing
- —
- Monthly P&I
- —
- Monthly cashflow
- —
- DSCR
- —
- Eligible?
- —
Personal DTI + credit; lowest rate.
DSCR
20% down · 8.5% · 30yr
- Down + closing
- —
- Monthly P&I
- —
- Monthly cashflow
- —
- DSCR
- —
- Eligible?
- —
No personal income docs; deal must DSCR.
Hard money
10% down · 12.0% · 12mo
- Down + closing
- —
- Monthly P&I
- —
- Monthly cashflow
- —
- DSCR
- —
- Eligible?
- —
Short-term bridge; refi at stabilization.
Rent comps 40 comps
| Address | Beds | Baths | Sqft | Rent | $/sqft | DOM | Units | Dist |
|---|---|---|---|---|---|---|---|---|
| 9702 Hillis St Houston, TX | 3.0 | 2.0 | 1612 | $1,550 | $0.96 | 43d | 1 | 0.17mi |
| 8350 Tidwell Rd Unit A Houston, TX | 3.0 | 2.0 | 980 | $975 | $0.99 | 43d | 1 | 0.17mi |
| 8346 Tidwell Rd Unit B Houston, TX | 3.0 | 2.0 | 980 | $1,000 | $1.02 | 43d | 1 | 0.18mi |
| 8235 Locksley Rd Unit A Houston, TX | 3.0 | 2.5 | 1608 | $1,525 | $0.95 | 7d | 1 | 0.23mi |
| 8302 Caddo Rd Houston, TX | 2.0 | 1.0 | 896 | $1,450 | $1.62 | 43d | 1 | 0.38mi |
| 9222 Hillis St Houston, TX | 3.0 | 2.0 | 1498 | $1,850 | $1.23 | 43d | 1 | 0.40mi |
| 8126 Sterlingshire St Unit B Houston, TX | 3.0 | 2.0 | 1150 | $1,350 | $1.17 | 24d | 1 | 0.41mi |
| 8213 Bigwood St Unit A Houston, TX | 3.0 | 2.5 | 1150 | $1,595 | $1.39 | 43d | 1 | 0.41mi |
| 8122 Sterlingshire St Unit B Houston, TX | 3.0 | 2.0 | 1160 | $1,450 | $1.25 | 15d | 1 | 0.42mi |
| 8122 Sterlingshire St Unit A Houston, TX | 3.0 | 2.0 | 1160 | $1,525 | $1.31 | 15d | 1 | 0.42mi |
| 8314 Madera Rd Unit B Houston, TX | 3.0 | 2.5 | 1608 | $1,495 | $0.93 | 24d | 1 | 0.47mi |
| 8711 Southwark St Unit A Houston, TX | 3.0 | 2.0 | 1150 | $1,750 | $1.52 | 43d | 1 | 0.56mi |
| 8102 Rhobell St Unit A Houston, TX | 4.0 | 3.5 | 1567 | $1,750 | $1.12 | 43d | 1 | 0.57mi |
| 9700 Mesa Dr Houston, TX | 1.0–3.0 | 1.0–2.0 | 784 | $989 | $1.26 | 2d | 8 | 0.58mi |
| 8214 Parker Rd Unit B Houston, TX | 3.0 | 2.0 | 1608 | $1,560 | $0.97 | 7d | 1 | 0.63mi |
| 8238 Homewood Ln Houston, TX | 3.0 | 2.0 | 1696 | $1,695 | $1.00 | 24d | 1 | 0.72mi |
| 8623 Homewood Unit A Houston, TX | 3.0 | 2.5 | 1150 | $1,850 | $1.61 | 43d | 1 | 0.72mi |
| 8623 Homewood Ln Unit B Houston, TX | 3.0 | 2.5 | 1150 | $1,850 | $1.61 | 18d | 1 | 0.72mi |
| 8625 Homewood Ln Unit B Houston, TX | 3.0 | 3.0 | 1500 | $1,850 | $1.23 | 43d | 1 | 0.72mi |
| 8627 Homewood Ln Unit B Houston, TX | 3.0 | 2.5 | 1500 | $1,850 | $1.23 | 43d | 1 | 0.73mi |
| 8631 Homewood Ln Unit B Houston, TX | 3.0 | 3.0 | 1500 | $1,850 | $1.23 | 43d | 1 | 0.74mi |
| 8631 Homewood Ln Unit A Houston, TX | 3.0 | 2.5 | 1500 | $1,850 | $1.23 | 43d | 1 | 0.74mi |
| 9550 N Wayside Dr Houston, TX | 1.0–3.0 | 1.0–2.0 | 896 | $1,399 | $1.56 | 1d | 5 | 0.75mi |
| 9110 Tidwell Rd Houston, TX | 2.0 | 2.0 | 987 | $1,200 | $1.22 | 24d | 1 | 0.76mi |
| 9110 Tidwell Rd Houston, TX | 2.0 | 2.0 | 987 | $1,185 | $1.20 | 43d | 1 | 0.76mi |
| 8203 Woodlyn Rd Unit C Houston, TX | 3.0 | 2.5 | 1650 | $1,650 | $1.00 | 7d | 1 | 0.79mi |
| 8006 Lynette St Houston, TX | 3.0 | 1.0 | 1400 | $1,475 | $1.05 | 24d | 1 | 0.83mi |
| 8602 Wilkins Oaks Dr Houston, TX | 3.0 | 2.0 | 1307 | $1,775 | $1.36 | 43d | 1 | 0.88mi |
| 9526 Balsam Ln Houston, TX | 3.0 | 1.5 | 1533 | $1,475 | $0.96 | 5d | 1 | 0.89mi |
| 8213 Linda Vista Rd Houston, TX | 3.0 | 2.0 | 1298 | $1,625 | $1.25 | 24d | 1 | 0.94mi |
| 8638 Doris Oaks Cir Houston, TX | 3.0 | 3.0 | 1777 | $1,975 | $1.11 | 43d | 1 | 0.95mi |
| 8216 Richland Dr Unit B Houston, TX | 3.0 | 2.0 | 1150 | $1,750 | $1.52 | 43d | 1 | 1.03mi |
| 8309 Carolwood Dr Houston, TX | 3.0 | 1.0 | 938 | $1,350 | $1.44 | 43d | 1 | 1.10mi |
| 7914 Laura Koppe Rd Houston, TX | 3.0 | 2.0 | 1400 | $1,850 | $1.32 | 43d | 1 | 1.10mi |
| 9218 Nyssa St Unit B Houston, TX | 3.0 | 2.5 | 1608 | $1,490 | $0.93 | 2d | 1 | 1.13mi |
| 8113 Denton St Houston, TX | 3.0 | 2.0 | 1150 | $1,750 | $1.52 | 43d | 1 | 1.14mi |
| 10474 Red Orchid Dr Houston, TX | 3.0 | 2.5 | 1553 | $1,875 | $1.21 | 24d | 1 | 1.16mi |
| 8102 Crestview Dr Unit A Houston, TX | 3.0 | 2.5 | 1800 | $1,900 | $1.06 | 22d | 1 | 1.18mi |
| 8102 Crestview Dr Unit B Houston, TX | 3.0 | 2.5 | 1600 | $1,900 | $1.19 | 43d | 1 | 1.18mi |
| 9133 Woodlyn Rd Houston, TX | 3.0 | 1.0 | 1073 | $1,495 | $1.39 | 3d | 1 | 1.20mi |
Listing history 29 events
-
2026-06-18days on market $237,489 Active 21 DOM
-
2026-06-17days on market $237,489 Active 20 DOM
-
2026-06-16days on market $237,489 Active 19 DOM
-
2026-06-15days on market $237,489 Active 18 DOM
-
2026-06-13days on market $237,489 Active 16 DOM
-
2026-06-09days on market $237,489 Active 12 DOM
-
2026-06-08days on market $237,489 Active 11 DOM
-
2026-06-07days on market $237,489 Active 10 DOM
-
2026-06-04days on market $237,489 Active 7 DOM
-
2026-06-03days on market $237,489 Active 6 DOM
-
2026-06-02days on market $237,489 Active 5 DOM
-
2026-06-01days on market $237,489 Active 4 DOM
-
2026-05-31days on market $237,489 Active 3 DOM
-
2026-05-06status Pending 291-char remark
Show marketing remark (291 chars)
Move-in ready and fully renovated! This charming home features brand-new windows, fresh paint inside and out, updated flooring, and remodeled bathrooms. Ideal for first-time buyers! Located in a well-kept community with easy access to major freeways. Don’t miss this great opportunity!
-
2026-04-09status Active 291-char remark
Show marketing remark (291 chars)
Move-in ready and fully renovated! This charming home features brand-new windows, fresh paint inside and out, updated flooring, and remodeled bathrooms. Ideal for first-time buyers! Located in a well-kept community with easy access to major freeways. Don’t miss this great opportunity!
-
2026-04-01historical 291-char remark
Show marketing remark (291 chars)
Move-in ready and fully renovated! This charming home features brand-new windows, fresh paint inside and out, updated flooring, and remodeled bathrooms. Ideal for first-time buyers! Located in a well-kept community with easy access to major freeways. Don’t miss this great opportunity!
-
2025-10-06price $237,489 291-char remark
Show marketing remark (291 chars)
Move-in ready and fully renovated! This charming home features brand-new windows, fresh paint inside and out, updated flooring, and remodeled bathrooms. Ideal for first-time buyers! Located in a well-kept community with easy access to major freeways. Don’t miss this great opportunity!
-
2025-09-12price $249,587 291-char remark
Show marketing remark (291 chars)
Move-in ready and fully renovated! This charming home features brand-new windows, fresh paint inside and out, updated flooring, and remodeled bathrooms. Ideal for first-time buyers! Located in a well-kept community with easy access to major freeways. Don’t miss this great opportunity!
-
2025-07-25$254,999 Active 291-char remark
Show marketing remark (291 chars)
Move-in ready and fully renovated! This charming home features brand-new windows, fresh paint inside and out, updated flooring, and remodeled bathrooms. Ideal for first-time buyers! Located in a well-kept community with easy access to major freeways. Don’t miss this great opportunity!
-
2025-06-17historical
-
2025-06-16soldstatus
-
2025-05-22$185,000 Active
-
2025-02-01historical
-
2025-01-20price $203,000
-
2025-01-07$205,000 Active
-
2025-01-01historical $1,700
-
2024-10-31historical
-
2024-10-10$1,700
-
2024-04-08$210,000 Active
ⓘ Source: listings_history table (triggers on properties + properties_extension) + one-shot
backfill from property_details.listing_events for pre-trigger history.
Tax reassessment forecast TX · Resets to sale price
- Current annual tax
- $3,878 · $323/mo
- Projected year-2 tax
- $4,346 · $362/mo
- Expected delta
- +$468/yr (+$39/mo · 12.1%)
ⓘ Screening estimate from a state-policy table — verify with the county assessor before closing.
Climate risk First Street
- Flood 4/10 Moderate FEMA zone X (unshaded) · 20% chance over 30 yrs
- Wildfire 4/10 Moderate
- Heat 9/10 Extreme 7 d/yr ≥111°F today · 25 d/yr by 30 yrs out
- Wind 9/10 Extreme 99% chance of damaging wind over 30 yrs
- Air quality 3/10 Moderate 3 unhealthy d/yr today · 3 by 30 yrs out
Nearby sold comps map
Loading sold comps map…
Walkable amenities ~0.75 mi
Loading nearby amenities…
Taxation est. · year 1
- Rental income
- $19,421
- − Mortgage interest
- −$13,303
- − Property taxes
- −$3,878
- − Insurance
- −$1,187
- − Repairs & maintenance
- −$1,554
- − Management
- −$1,554
- − Depreciation
- −$6,909
- Taxable loss
- −$8,964
- Est. tax savings @ 24.0%
- +$2,151
- After-tax cash flow
- $-2,517/yr
For passive investors: Depreciation is non-cash, so a rental often shows a tax loss while cash-flowing — sheltering income. Rental losses are passive: they offset passive income freely, and up to $25,000/yr can offset ordinary (W-2) income if you actively participate and your MAGI is under $100k (phasing out to $0 by $150k); unused losses carry forward. On sale, claimed depreciation is recaptured at up to 25%, and gains may owe capital-gains tax (a 1031 exchange can defer both). Figures are a year-1 estimate at your 24.0% rate — not tax advice; consult a CPA.
Schools (NCES district)
- District
- Houston ISD
- NCES district ID
- 4823640
- Math proficiency
- 27% ▼ -18.00%
- Reading proficiency
- 35% ▼ -6.00%
- Median HH income
- $46,054
- Composite
- 26.63/100
- National rank
- #7173
- State rank
- #593 of 826 in TX
Livability — Houston
- Score
- 74/100
- State rank
- #184
- US rank
- #4771
Category grades
Schools grade is shown separately in the Schools card above.
Census & demographics
- Census place
- Houston, TX
- County
- Harris County · 4,702,590 people
- City population
- 3,226,434
- Metro
- Houston-The Woodlands-Sugar Land, TX
- Population (ZIP)
- 14,247
- Household income
- $39,093
- Rent vs Own
- Severe rent burden
- 780.0
Population outlook (Harris County) Hauer SSP2
- Today (2025)
- 5,571,493 people
- By 2030
- 6,089,821 · +9.3%
- By 2040
- 7,142,806 · +28.2%
- By 2050
- 8,185,864 · +46.9%
- By 2075
- 10,574,329 · +89.8%
- By 2100
- 12,109,958 · +117.4%
Race, ethnicity, and origin ACS 2023
- Race & ethnicity
- Black 49% Hispanic / Latino 46% Two or more races 15% White 5%
- Hispanic origin (detail)
- Mexican 36% Cuban 1%
- Common ancestry
- Italian 1% Hispanic 1%
- Foreign-born
- 24% · Canada
- Languages at home
- 59% English-only · Spanish 41%
Political lean MEDSL · Harris
- 2024 margin
- Lean D (+5.5) · D 52.0% · R 46.4% · Other 1.6%
- 2008→2024 swing
- +3.9pp toward D · 2008: 1.6pp · 2024: 5.5pp
- All cycles
- 2024: D+5.5 2020: D+13.3 2016: D+12.4 2012: D+0.1 2008: D+1.6
Not yet ingested
- Civics
- —
Market trends
- HPI YoY
- ▲ 2.50%
- Current HPI
- 307.0842
- Rent YoY
- —
- Metro
- Houston-The Woodlands-Sugar Land, TX
- State GDP YoY
- ▲ 3.95%
- F500 in state
- 110
Industry mix (Fortune 500 HQ in TX)
| Industry | F500 HQs | Revenue |
|---|---|---|
| Energy | 16 | $1,198B |
|
||
| Technology | 5 | $198B |
|
||
| Engineering / Construction | 4 | $72B |
|
||
| Energy Services | 3 | $60B |
|
||
| Utilities | 3 | $41B |
|
||
| Healthcare | 2 | $330B |
|
||
Price history
+13.1% since first listed16 events — show timeline
- 2026-05-06 Pending — HARMLS
- 2026-04-09 Relisted — HARMLS
- 2026-04-01 Listing Removed — HARMLS
- 2025-10-06 Price Changed $237,489 HARMLS
- 2025-09-12 Price Changed $249,587 HARMLS
- 2025-07-25 Listed $254,999 HARMLS
- 2025-06-17 Listing Removed — HARMLS
- 2025-06-16 Sold (Public Records) — Public Records
- 2025-05-22 Listed $185,000 HARMLS
- 2025-02-01 Listing Removed — HARMLS
- 2025-01-20 Price Changed $203,000 HARMLS
- 2025-01-07 Listed $205,000 HARMLS
- 2025-01-01 Rental Removed $1,700 HARMLS
- 2024-10-31 Listing Removed — HARMLS
- 2024-10-10 Listed for Rent $1,700 HARMLS
- 2024-04-08 Listed $210,000 HARMLS
Property tax history
+5.2%/yrLatest (2025): $3,878 · +15.9% YoY. Source: county tax records.
Cash-flow waterfall
monthlySold comps — $/sqft
last 12 mo · ≤1 miLoading sold comps…