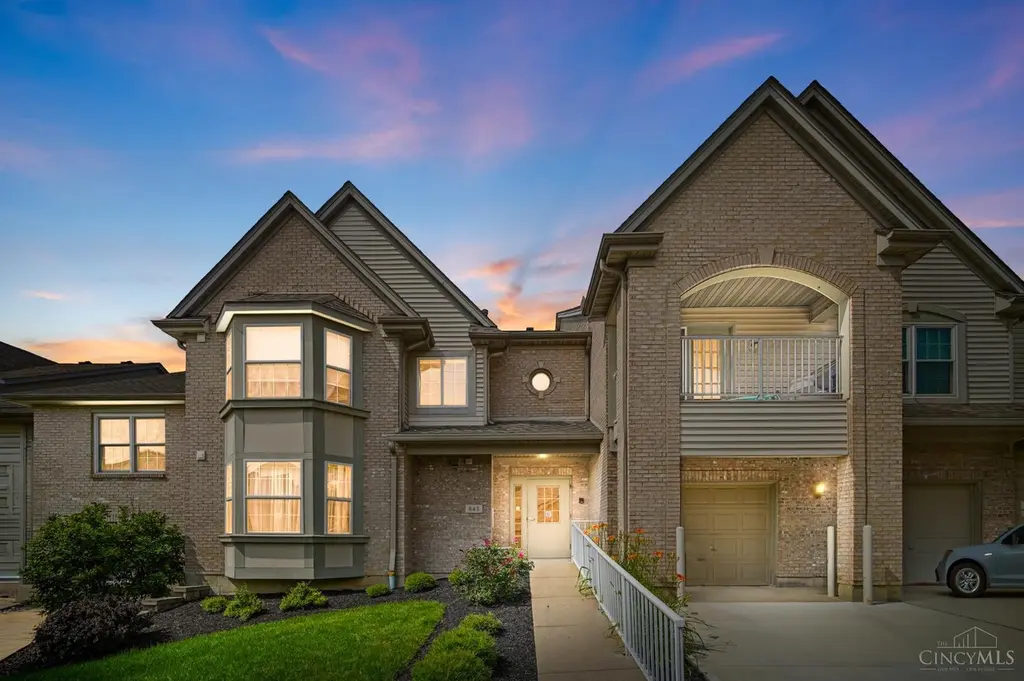
843 Neeb Rd #1 · Covedale, OH
Flood risk 1/10 · Minimal
- FEMA flood zone
- X (unshaded)
- Chance of flooding over 30 yrs
- 0.0%
- Est. flood insurance / yr
- $507 – $1,088
Fire risk 1/10 · Minimal
- Est. fire insurance / yr
- $713 – $1,323
Heat risk 4/10 · Minor
- Hot days now (above 103°F)
- 7 days/yr
- Hot days in 30 yrs
- 19 days/yr
Wind risk 2/10 · Minimal
- Chance of severe wind over 30 yrs
- 1.0%
Air-quality risk 3/10 · Minor
- Unhealthy air days now
- 3 days/yr
- Unhealthy air days in 30 yrs
- 5 days/yr
Risk factors via First Street. Map © Google.
Why this score? — see what drove the D grade
The composite is a weighted blend of 9 inputs, each scored 0–100. Each bar is that input's sub-score; the figure is the points it added to the 100-point composite (weight × sub-score).
- Cash flow +10.9/30.0
- ARV discount +7.5/15.0
- Schools +6.0/10.0
- 1% rule +4.7/10.0
- Livability +3.8/5.0
- DSCR +3.2/10.0
- Rent growth +2.5/5.0
- Condition / age +2.5/5.0
- Appreciation +0.0/10.0
$184,900
🖨 Deal sheet (PDF) 📄 Offer letter ✓ Due diligence
Listing remarks MLS
Oak Tree Condominums. the Savannah. 1st Floor Unit. No Steps. 2 Bdrms, 2 Full Baths, Eat-in Kitchen, Deck Area W/Storage Room. Attached Garage. Tremendous Value.
Key facts
- Covered deck
- Plenty of storage
- Formal dining area
Tags
Property features AI
Finance
- Other: Residential zoning; Lease not considered
- HOA & community: HOA managed by Towne Properties; Monthly association fee of $220 paid by owner; Association covers water, trash, snow removal, landscaping, and association dues
Exterior
- Parking: Attached front garage (1 garage space); Driveway parking; On-street parking
- Utilities: Public water; Public sewer; Natural gas
- Home design: Traditional style; One-level unit with entry on level 1; Common hallway entry; unit entry level 1; Pets allowed; Wheelchair accessible building features
- Construction: Brick and vinyl siding exterior; Shingle roof; Poured foundation; Built as a one-story unit
- Exterior features: Covered deck/patio; Walkout from living area; Vinyl windows (insulated)
Interior
- Kitchen: Eat-in kitchen with vinyl flooring and wood cabinets; Includes microwave, oven/range, refrigerator
- Bedrooms: Two bedrooms on main level — Primary ~15 x 14, Second ~15 x 12
- Flooring: Vinyl flooring in kitchen; Wall-to-wall carpet in living room; Carpet in dining room
- Bathrooms: Two full bathrooms on main level; Primary bathroom with shower and additional features
- Heating & cooling: Forced air heating (gas); Central air conditioning; Gas water heating
- Interior features: Multi-panel doors; Closet in entry/foyer
- Laundry & utility: Washer and dryer included; Laundry in unit
Neighborhood map
What this means for you Summary
Snapshot
- This is a 2-bed/2.0-bath condo listed at $185k.
Deal economics
- At list price, monthly cash flow is $-80 ($-957/yr) — negative.
- To cash-flow at today's rent, offer at most $173k (6.2% below list).
- To meet the 1% rule (rent ≥ 1% of price), the offer needs to be $180k (2.9% below list).
- Recommended offer: $173k (6.2% below list) — sets the bar for cash-flow.
- Cap rate 5.8% vs local median 4.2% in Covedale — top-decile yield for the area; either an underpriced asset or a hidden risk that comps aren't pricing in. Stress-test before assuming the spread holds.
Location & tenants
- Location reads 76/100 on livability (#235 in OH, #3,713 nationally) — a middle-class / working-renter tenant base. Strengths: cost of living A+, housing A+, crime A; Watch: amenities F, health & safety F.
- Oak Hills Local (suburban): math 68% / reading 70% proficiency, ranked #141 of 656 in OH (top 22%) — acceptable for families but not a draw, mixed tenant base, ~2y average lease.
- Zoned schools: C O Harrison Elementary School (math 78% / reading 71%, grade A, #272 of 1,584 statewide, top 19%, 943 students, 38% FRL); Rapid Run Middle School (math 70% / reading 70%, grade A, #136 of 654 statewide, top 22%, 605 students, 0% FRL); Oak Hills High School (math 8% / reading 69%, grade F, #557 of 781 statewide, top 72%, 2,325 students, 0% FRL).
- Market conditions: 83 active listings in the ZIP; 1 comparable units currently listed for rent nearby; high-income renter base; 801 units permitted in Hamilton County in 2024 (190 in 5+ unit buildings).
Forward outlook
- Local home prices are declining (-3.0%/yr); year-one equity from $1k of loan paydown is wiped out by about $6k of value loss. Plan a longer hold.
Negotiation context
- Only 13 days on market — expect competitive offers; lowballing is unlikely to land.
- 2 sale attempts since 28y ago; this cycle's ask has dropped $15k (8%) from the opening price — seller is motivated, your offer sets the floor, not the list.
- Current owner paid $131k; 41% above their basis — modest negotiation headroom, anchor on the comps not their cost.
Questions for the listing agent
- What do current leases actually rent for vs. the listed asking? Can we see a recent rent roll and the last 12 months of T-12 income?
- What does the HOA fee cover, when was the last increase, and are there any pending special assessments or reserve-fund shortfalls?
- Any open or pending special assessments — roof, HVAC, plumbing, elevator, façade? What's the per-unit balance and payoff schedule, and is the seller paying it off at close or rolling it to the buyer?
- Is there a deadline driving the sale (1031 exchange, divorce, estate, relocation)? That informs how much negotiation room exists.
- The area grade is low — what's the realistic commute time and amenity access for the typical tenant pool here? Any planned neighborhood developments (good or bad) we should know about?
- What's the average days-on-market for RENTAL listings here right now (not sales)? A rising rental-DOM trend means longer vacancies and softer asking-rent achievability than the comps imply.
- What's the recent tenant-quality profile in this submarket — average credit score on applications, eviction rate, late-payment / NSF rate, and stable-employment percentage? A property-management company in the area should have these aggregated.
- How much new apartment / multifamily construction is in the pipeline within 1–3 miles? Heavy new supply (>2% of stock underway) typically softens rents 12–24 months out; light construction supports rent growth.
Investment metrics
- 1% rule
- 0.97% ✗
- Cap rate
- 5.78%
- Cash-on-cash
- -1.85%
- DSCR
- 0.92
- GRM
- 8.6
CMA / ARV
No comps found within radius.
Projected returns pro-forma
-3.0% appreciation · 3.0% rent growth · sell at horizon
- IRR
- -19.2%
- Equity multiple
- 0.33×
- Total profit
- $-34,879
- Equity at exit
- $27,569
- IRR
- -11.7%
- Equity multiple
- 0.30×
- Total profit
- $-36,253
- Equity at exit
- $15,987
Cash invested: $51,772 (down + closing). Projections, not guarantees.
Landlord ↔ Tenant lean methodology
- Overall (STATE)
- 73 Landlord-Friendly
- State Ohio
- 73 Landlord-Friendly · R+6
- County
- — inherits STATE
- City
- — inherits STATE
ZIP-level market 45233
- Active inventory
- 83
- Price-to-rent
- 8.6×
Monthly cashflow live
- Estimated rent
- $1,795 medium interval (Pro) →
- Mortgage (P&I)
- −$970
- Tax est. 1.5%
- −$231 /mo · $2,774/yr
- Insurance
- −$77
- HOA
- −$220
- Vacancy / Maint / Mgmt
- −$377
- Net cashflow
- $-80
Break-even live
Sensitivity live
| Price | -10% $48 | -5% $-16 | +0% $-80 | +5% $-144 | +10% $-208 |
|---|---|---|---|---|---|
| Rent | -10% $-222 | -5% $-151 | +0% $-80 | +5% $-9 | +10% $62 |
| Rate | -1.0pp $13 | -0.5pp $-33 | base $-80 | +0.5pp $-128 | +1.0pp $-176 |
UW: 25.0% down · 7.5% · 30yr · 1.5% tax · 5.0% vac · 8.0% maint · 8.0% mgmt
Financing live
Cash to close
- Down payment
- $46,225
- Closing costs
- $5,547
- Reserves months
- —
- Total cash needed
- —
Loan-product check · same deal, 3 products live
Conventional
25% down · 7.5% · 30yr
- Down + closing
- —
- Monthly P&I
- —
- Monthly cashflow
- —
- DSCR
- —
- Eligible?
- —
Personal DTI + credit; lowest rate.
DSCR
20% down · 8.5% · 30yr
- Down + closing
- —
- Monthly P&I
- —
- Monthly cashflow
- —
- DSCR
- —
- Eligible?
- —
No personal income docs; deal must DSCR.
Hard money
10% down · 12.0% · 12mo
- Down + closing
- —
- Monthly P&I
- —
- Monthly cashflow
- —
- DSCR
- —
- Eligible?
- —
Short-term bridge; refi at stabilization.
Rent comps 1 comps
| Address | Beds | Baths | Sqft | Rent | $/sqft | DOM | Units | Dist |
|---|---|---|---|---|---|---|---|---|
| 5695 Victoryview Ln Cincinnati, OH | 3.0 | 2.0 | 1140 | $1,795 | $1.57 | 5d | 1 | 0.03mi |
HOA detail condo
- Monthly dues
- $220 · $2,640/yr
- Assessments
- None detected in remarks — confirm with the listing agent.
Listing history 8 events
-
2026-06-21days on market $184,900 Active 13 DOM
-
2026-06-18days on market $184,900 Active 10 DOM
-
2026-06-17pricedays on market $184,900 Active 9 DOM
-
2026-06-16days on market $199,900 Active 8 DOM
-
2026-06-15days on market $199,900 Active 7 DOM
-
2026-06-13days on market $199,900 Active 5 DOM
-
2026-06-08remarks 679-char remark
-
2026-06-08$199,900 Active 1 DOM
ⓘ Source: listings_history table (triggers on properties + properties_extension) + one-shot
backfill from property_details.listing_events for pre-trigger history.
Climate risk First Street
- Flood 1/10 Low FEMA zone X (unshaded) · 0% chance over 30 yrs
- Wildfire 1/10 Low
- Heat 4/10 Moderate 7 d/yr ≥103°F today · 19 d/yr by 30 yrs out
- Wind 2/10 Low 100% chance of damaging wind over 30 yrs
- Air quality 3/10 Moderate 3 unhealthy d/yr today · 5 by 30 yrs out
Nearby sold comps map
Loading sold comps map…
Walkable amenities ~0.75 mi
Loading nearby amenities…
Taxation est. · year 1
- Rental income
- $21,540
- − Mortgage interest
- −$10,357
- − Property taxes
- −$2,774
- − Insurance
- −$924
- − Repairs & maintenance
- −$1,723
- − Management
- −$1,723
- − HOA
- −$2,640
- − Depreciation
- −$5,379
- Taxable loss
- −$3,981
- Est. tax savings @ 24.0%
- +$955
- After-tax cash flow
- $-2/yr
For passive investors: Depreciation is non-cash, so a rental often shows a tax loss while cash-flowing — sheltering income. Rental losses are passive: they offset passive income freely, and up to $25,000/yr can offset ordinary (W-2) income if you actively participate and your MAGI is under $100k (phasing out to $0 by $150k); unused losses carry forward. On sale, claimed depreciation is recaptured at up to 25%, and gains may owe capital-gains tax (a 1031 exchange can defer both). Figures are a year-1 estimate at your 24.0% rate — not tax advice; consult a CPA.
Schools (NCES district)
- District
- Oak Hills Local
- NCES district ID
- 3904737
- Math proficiency
- 68% ▼ -11.00%
- Reading proficiency
- 70% ▼ -8.00%
- Median HH income
- $67,889
- Composite
- 60.25/100
- National rank
- #858
- State rank
- #141 of 656 in OH
Livability — Covedale
- Score
- 76/100
- State rank
- #235
- US rank
- #3713
Category grades
Schools grade is shown separately in the Schools card above.
Census & demographics
- County
- Hamilton · 838,887 people
- Metro
- Cincinnati, OH-KY-IN
- Population (ZIP)
- 15,362
- Household income
- $110,408
- Rent vs Own
- Severe rent burden
- 7.9
Population outlook (Hamilton County) Hauer SSP2
- Today (2025)
- 826,054 people
- By 2030
- 830,947 · +0.6%
- By 2040
- 832,319 · +0.8%
- By 2050
- 822,428 · -0.4%
- By 2075
- 788,688 · -4.5%
- By 2100
- 710,674 · -14.0%
Race, ethnicity, and origin ACS 2023
- Neighborhood character
- Predominantly White (92%)
- Race & ethnicity
- White 92% Black 4% Two or more races 3%
- Common ancestry
- Slovak 3% Iranian 2% Romanian 1%
- Foreign-born
- 1%
- Languages at home
- 99% English-only · Spanish 1%
Political lean MEDSL · Hamilton
- 2024 margin
- D (+14.9) · D 57.0% · R 42.1%
- 2008→2024 swing
- +7.9pp toward D · 2008: 7.0pp · 2024: 14.9pp
- All cycles
- 2024: D+14.9 2020: D+15.9 2016: D+9.5 2012: D+4.9 2008: D+7.0
Not yet ingested
- Civics
- —
Market trends
- HPI YoY
- ▼ -143.43%
- Current HPI
- 214.0365
- Rent YoY
- —
- Metro
- —
- State GDP YoY
- ▲ 1.98%
- F500 in state
- 48
Industry mix (Fortune 500 HQ in OH)
| Industry | F500 HQs | Revenue |
|---|---|---|
| Insurance | 3 | $145B |
|
||
| Industrial Machinery | 3 | $49B |
|
||
| Financial Services | 3 | $24B |
|
||
| Consumer Goods | 2 | $93B |
|
||
| Aerospace / Defense | 2 | $47B |
|
||
| Utilities | 2 | $33B |
|
||
Price history
+55.1% since first listed3 events — show timeline
- 2026-06-08 Listed $199,900 Cincy MLS
- 1999-01-12 Sold (MLS) $130,714 Cincy MLS
- 1998-07-23 Listed $128,900 Cincy MLS
Cash-flow waterfall
monthlySold comps — $/sqft
last 12 mo · ≤1 miLoading sold comps…