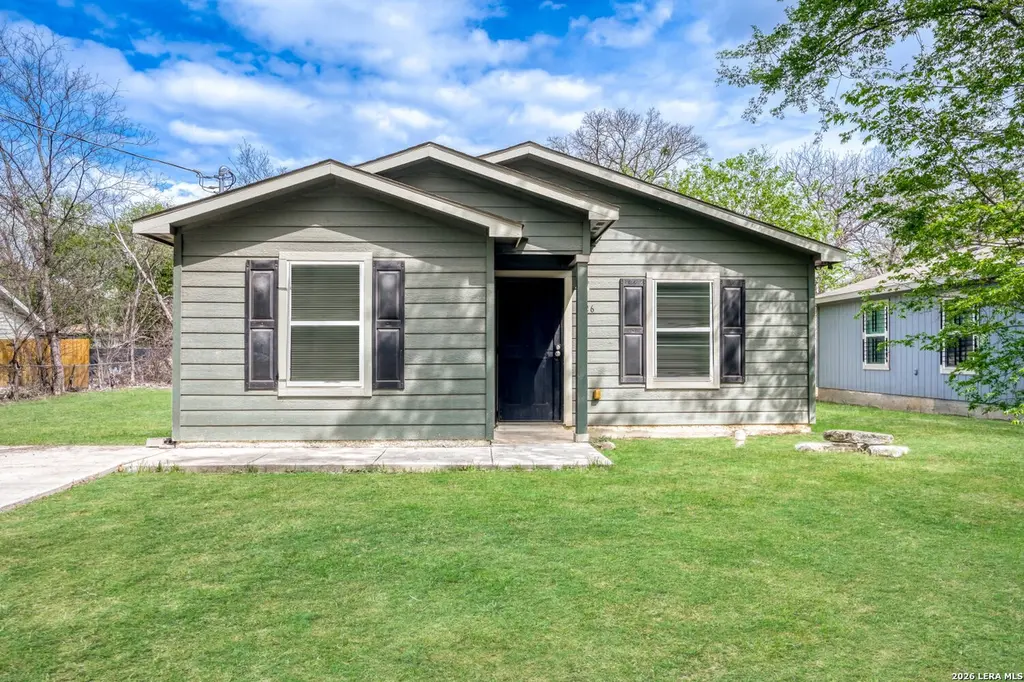
126 N San Ignacio · San Antonio, TX
Flood risk 1/10 · Minimal
- FEMA flood zone
- X (unshaded)
- Chance of flooding over 30 yrs
- 0.0%
- Est. flood insurance / yr
- $507 – $1,088
Fire risk 1/10 · Minimal
- Est. fire insurance / yr
- $1,222 – $2,270
Heat risk 8/10 · Major
- Hot days now (above 108°F)
- 7 days/yr
- Hot days in 30 yrs
- 22 days/yr
Wind risk 6/10 · Moderate
- Chance of severe wind over 30 yrs
- 77.0%
Air-quality risk 2/10 · Minimal
- Unhealthy air days now
- 1 days/yr
- Unhealthy air days in 30 yrs
- 1 days/yr
Risk factors via First Street. Map © Google.
Why this score? — see what drove the D grade
The composite is a weighted blend of 9 inputs, each scored 0–100. Each bar is that input's sub-score; the figure is the points it added to the 100-point composite (weight × sub-score).
- Appreciation +10.0/10.0
- Cash flow +7.5/30.0
- ARV discount +7.5/15.0
- Rent growth +4.0/5.0
- Livability +4.0/5.0
- Condition / age +2.5/5.0
- 1% rule +2.2/10.0
- DSCR +1.7/10.0
- Schools +1.3/10.0
$174,900
🖨 Deal sheet (PDF) 📄 Offer letter ✓ Due diligence
Listing remarks MLS
MLS# 1524467 - Built by Ameritex Homes - Ready Now! ~ Beautiful home in San Antonio, TX. This smart home features 3 bedrooms, 2 bathrooms and modern amenities throughout. Open concept family room is perfect for gathering with friends and family providing a seamless dining and entertaining experience. Energy-efficient features and appliances are proven to drive utility costs down. Lovely kitchen designed for convenience. Fully equipped with SMART HOME TECHNOLOGY that includes programmable thermostat, keyless smart locks all connected and secured through a smart home hub. This home is a must-see! **Photos and 3D tour may be representative of the house plan, but not actual photos of the home**
Key facts
- 8,624 sq ft lot
- Built 2020
- Listed 41 days
Property features AI
Finance
- Financial info: Down payment assistance resources available
- HOA & community: Located in LOMA AREA 2 ED subdivision
Exterior
- Utilities: City water/sewer
- Home design: Pre-owned single-family home; Approximate age: 6 years
- Construction: Slab foundation; Composition roof; Built by Ameritex Homes
- Exterior features: Siding exterior
Interior
- Kitchen: Kitchen (8 x 5); Microwave Oven; Stove/Range; Refrigerator; Dishwasher
- Bedrooms: Master bedroom (12 x 11) with full bath; Bedroom 2 (11 x 8); Bedroom 3 (11 x 9)
- Flooring: Laminate floors
- Bathrooms: 2 full bathrooms; Master bath with single vanity (6 x 8)
- Heating & cooling: Central heating (electric); Central air conditioning
- Interior features: Open floor plan; Microwave Oven; Stove/Range; Refrigerator; Dishwasher
- Laundry & utility: Washer connection; Dryer connection
Neighborhood map
What this means for you Summary
Snapshot
- This is a 3-bed/2.0-bath single-family listed at $175k.
Deal economics
- At list price, monthly cash flow is $-215 ($-3k/yr) — negative.
- To cash-flow at today's rent, offer at most $144k (17.8% below list).
- To meet the 1% rule (rent ≥ 1% of price), the offer needs to be $126k (28.1% below list).
- Recommended offer: $126k (28.1% below list) — sets the bar for 1% rule.
- Cap rate 4.8% vs local median 3.8% in San Antonio — meaningfully above typical; check what's discounted (condition, days-on-market, listing class) to confirm the premium yield is real.
Location & tenants
- Location reads 80/100 on livability (#31 in TX, #1,616 nationally) — a professional / high-income tenant draw. Strengths: amenities A+, commute A+, cost of living A+; Watch: crime F.
- Edgewood ISD (urban): math 12% / reading 21% proficiency, ranked #812 of 826 in TX (top 98%) — low school quality limits family demand, transient renter base, plan for 1-2y turnover.
- Zoned schools: Roosevelt El (math 8% / reading 17%, grade F, #4,180 of 4,322 statewide, top 97%, 305 students, 95% FRL); Gus Garcia Middle (math 13% / reading 20%, grade F, #1,536 of 1,662 statewide, top 93%, 505 students, 96% FRL, charter); Memorial H S (math 22% / reading 29%, grade F, #1,246 of 1,632 statewide, top 77%, 872 students, 92% FRL) — zoned schools average 94% FRL vs 24% district-wide (70 pts higher); higher-poverty schools than district average — tighter screening recommended.
- Market conditions: Rents rising fast (+6.1%/yr); 140 active listings in the ZIP; 6 comparable units currently listed for rent nearby; rentals at typical pace (median 24d on market — plan ~3-4 weeks tenant-placement turnaround); lower-income renter base — watch delinquency; 8,308 units permitted in Bexar County in 2024 (2,506 in 5+ unit buildings).
- This rent runs 35% of the median local income ($43k/yr) — at the standard rent-burdened threshold; future hikes will face affordability resistance.
Forward outlook
- In year one you build about $19k of equity ($1k loan paydown + $17k appreciation (10.0% local appreciation)).
- Bexar County population projected at +50% by 2050 — long-run rental-demand tailwind backs the buy-and-hold thesis.
- By year 2, paydown + projected appreciation supports a ~$30k cash-out refi (75% LTV) — recoverable capital for the next deal without selling this one.
Negotiation context
- It's been on market 42 days — a 3% lower offer ($170k) is reasonable based on typical stale-listing flexibility.
- 4 sale attempts since 5y ago; this cycle's ask has dropped $15k (8%) from the opening price — seller is motivated, your offer sets the floor, not the list.
Risks & watch-outs
- Climate carrying-cost: major wind risk, 77% chance of damaging wind over 30y; extreme-heat days projected 7→22/yr by 2055 (HVAC capex compounding) — expect insurance premiums to compound above CPI over the hold.
Questions for the listing agent
- What do current leases actually rent for vs. the listed asking? Can we see a recent rent roll and the last 12 months of T-12 income?
- It's been on market 42 days. Have you received any prior offers? Is the seller open to a 28% concession, seller financing, or rate buy-down credit?
- Is there a deadline driving the sale (1031 exchange, divorce, estate, relocation)? That informs how much negotiation room exists.
- Crime grade is F in this area — have there been break-ins, vandalism, or insurance claims at this property in the last 3 years? What carrier currently insures it and at what premium?
- The area grade is low — what's the realistic commute time and amenity access for the typical tenant pool here? Any planned neighborhood developments (good or bad) we should know about?
- What's the average days-on-market for RENTAL listings here right now (not sales)? A rising rental-DOM trend means longer vacancies and softer asking-rent achievability than the comps imply.
- What's the recent tenant-quality profile in this submarket — average credit score on applications, eviction rate, late-payment / NSF rate, and stable-employment percentage? A property-management company in the area should have these aggregated.
- How much new for-sale + rental construction is in the pipeline within 1–3 miles? Heavy new supply typically softens prices + rents 12–24 months out; constrained supply supports both.
Investment metrics
- 1% rule
- 0.72% ✗
- Cap rate
- 4.82%
- Cash-on-cash
- -5.26%
- DSCR
- 0.77
- GRM
- 11.6
CMA / ARV
No comps found within radius.
Projected returns pro-forma
10.0% appreciation · 6.13% rent growth · sell at horizon
- IRR
- 21.5%
- Equity multiple
- 2.75×
- Total profit
- $85,694
- Equity at exit
- $157,564
- IRR
- 20.1%
- Equity multiple
- 6.57×
- Total profit
- $272,550
- Equity at exit
- $339,792
Cash invested: $48,972 (down + closing). Projections, not guarantees.
Landlord ↔ Tenant lean methodology
- Overall (STATE)
- 87 Strongly Landlord-Friendly
- State Texas
- 87 Strongly Landlord-Friendly · R+5
- County
- — inherits STATE
- City
- — inherits STATE
ZIP-level market 78237
- Home prices YoY
- 14.1%
- Rents YoY
- 6.1%
- Active inventory
- 140
- Price-to-rent
- 11.6×
Monthly cashflow live
- Estimated rent
- $1,258 high interval (Pro) →
- Mortgage (P&I)
- −$917
- Tax est. 1.5%
- −$219 /mo · $2,624/yr
- Insurance
- −$73
- HOA
- −$0
- Vacancy / Maint / Mgmt
- −$264
- Net cashflow
- $-215
Break-even live
Sensitivity live
| Price | -10% $-94 | -5% $-154 | +0% $-215 | +5% $-275 | +10% $-335 |
|---|---|---|---|---|---|
| Rent | -10% $-314 | -5% $-264 | +0% $-215 | +5% $-165 | +10% $-115 |
| Rate | -1.0pp $-127 | -0.5pp $-170 | base $-215 | +0.5pp $-260 | +1.0pp $-306 |
UW: 25.0% down · 7.5% · 30yr · 1.5% tax · 5.0% vac · 8.0% maint · 8.0% mgmt
Financing live
Cash to close
- Down payment
- $43,725
- Closing costs
- $5,247
- Reserves months
- —
- Total cash needed
- —
Loan-product check · same deal, 3 products live
Conventional
25% down · 7.5% · 30yr
- Down + closing
- —
- Monthly P&I
- —
- Monthly cashflow
- —
- DSCR
- —
- Eligible?
- —
Personal DTI + credit; lowest rate.
DSCR
20% down · 8.5% · 30yr
- Down + closing
- —
- Monthly P&I
- —
- Monthly cashflow
- —
- DSCR
- —
- Eligible?
- —
No personal income docs; deal must DSCR.
Hard money
10% down · 12.0% · 12mo
- Down + closing
- —
- Monthly P&I
- —
- Monthly cashflow
- —
- DSCR
- —
- Eligible?
- —
Short-term bridge; refi at stabilization.
Rent comps 6 comps
| Address | Beds | Baths | Sqft | Rent | $/sqft | DOM | Units | Dist |
|---|---|---|---|---|---|---|---|---|
| 2503 Arbor Pl San Antonio, TX | 2.0 | 1.0 | 750 | $800 | $1.07 | 45d | 1 | 1.17mi |
| 122 Collins Ct San Antonio, TX | 2.0 | 1.0 | 927 | $1,150 | $1.24 | 23d | 1 | 1.24mi |
| 2426 Cincinnati Ave San Antonio, TX | 2.0 | 1.0 | 700 | $975 | $1.39 | 25d | 1 | 1.39mi |
| 2426 Cincinnati Ave San Antonio, TX | 2.0 | 1.0 | 700 | $975 | $1.39 | 0d | 1 | 1.39mi |
| 2331 Cincinnati Ave Unit 2345 03 San Antonio, TX | 3.0 | 1.0 | 950 | $1,300 | $1.37 | 5d | 1 | 1.49mi |
| 2331 Cincinnati Ave San Antonio, TX | 1.0–3.0 | 1.0 | 850 | $1,300 | $1.53 | 14d | 3 | 1.50mi |
Listing history 17 events
-
2026-06-21days on market $174,900 Active 42 DOM
-
2026-06-21statusdays on market $174,900 Active 41 DOM
-
2026-06-18days on market $174,900 Price Change 39 DOM
-
2026-06-17days on market $174,900 Price Change 38 DOM
-
2026-06-16days on market $174,900 Price Change 37 DOM
-
2026-06-15days on market $174,900 Price Change 36 DOM
-
2026-06-13days on market $174,900 Price Change 34 DOM
-
2026-06-12days on market $174,900 Price Change 33 DOM
-
2026-06-09pricestatusdays on market $174,900 Price Change 30 DOM
-
2026-06-08days on market $182,900 Active 29 DOM
-
2026-06-08days on market $182,900 Active 28 DOM
-
2026-06-07days on market $182,900 Active 27 DOM
-
2026-06-03days on market $182,900 Active 24 DOM
-
2026-06-02statusdays on market $182,900 Active 23 DOM
-
2026-06-01days on market $182,900 Price Change 22 DOM
-
2026-05-31remarks 236-char remark
-
2026-05-31$182,900 Price Change 21 DOM
ⓘ Source: listings_history table (triggers on properties + properties_extension) + one-shot
backfill from property_details.listing_events for pre-trigger history.
Climate risk First Street
- Flood 1/10 Low FEMA zone X (unshaded) · 0% chance over 30 yrs
- Wildfire 1/10 Low
- Heat 8/10 Severe 7 d/yr ≥108°F today · 22 d/yr by 30 yrs out
- Wind 6/10 Major 77% chance of damaging wind over 30 yrs
- Air quality 2/10 Low 1 unhealthy d/yr today · 1 by 30 yrs out
Nearby sold comps map
Loading sold comps map…
Walkable amenities ~0.75 mi
Loading nearby amenities…
Taxation est. · year 1
- Rental income
- $15,100
- − Mortgage interest
- −$9,797
- − Property taxes
- −$2,624
- − Insurance
- −$874
- − Repairs & maintenance
- −$1,208
- − Management
- −$1,208
- − Depreciation
- −$5,088
- Taxable loss
- −$5,699
- Est. tax savings @ 24.0%
- +$1,368
- After-tax cash flow
- $-1,207/yr
For passive investors: Depreciation is non-cash, so a rental often shows a tax loss while cash-flowing — sheltering income. Rental losses are passive: they offset passive income freely, and up to $25,000/yr can offset ordinary (W-2) income if you actively participate and your MAGI is under $100k (phasing out to $0 by $150k); unused losses carry forward. On sale, claimed depreciation is recaptured at up to 25%, and gains may owe capital-gains tax (a 1031 exchange can defer both). Figures are a year-1 estimate at your 24.0% rate — not tax advice; consult a CPA.
Schools (NCES district)
- District
- Edgewood ISD
- NCES district ID
- 4818150
- Math proficiency
- 12% ▼ -18.00%
- Reading proficiency
- 21% ▼ -5.00%
- Median HH income
- $27,419
- Composite
- 12.82/100
- National rank
- #9597
- State rank
- #812 of 826 in TX
Livability — San Antonio
- Score
- 80/100
- State rank
- #31
- US rank
- #1616
Category grades
Schools grade is shown separately in the Schools card above.
Census & demographics
- Census place
- San Antonio, TX
- County
- Bexar County · 1,990,555 people
- City population
- 1,806,925
- Metro
- San Antonio-New Braunfels, TX
- Population (ZIP)
- 37,379
- Household income
- $42,772
- Rent vs Own
- Severe rent burden
- 1185.0
Population outlook (Bexar County) Hauer SSP2
- Today (2025)
- 2,336,851 people
- By 2030
- 2,560,728 · +9.6%
- By 2040
- 3,020,569 · +29.3%
- By 2050
- 3,493,522 · +49.5%
- By 2075
- 4,668,459 · +99.8%
- By 2100
- 5,533,242 · +136.8%
Race, ethnicity, and origin ACS 2023
- Neighborhood character
- Predominantly Hispanic (95%)
- Race & ethnicity
- Hispanic / Latino 95% Two or more races 50% White 3% Native American 2% Black 2%
- Hispanic origin (detail)
- Mexican 84%
- Foreign-born
- 18% · Canada
- Languages at home
- 34% English-only · Spanish 66%
Political lean MEDSL · Bexar
- 2024 margin
- Lean D (+9.8) · D 54.3% · R 44.6% · Other 1.1%
- 2008→2024 swing
- +4.2pp toward D · 2008: 5.6pp · 2024: 9.8pp
- All cycles
- 2024: D+9.8 2020: D+18.2 2016: D+13.5 2012: D+4.6 2008: D+5.6
Not yet ingested
- Civics
- —
Market trends
- HPI YoY
- ▲ 30.52%
- Current HPI
- 247.7257
- Rent YoY
- ▲ 6.13%
- Metro
- San Antonio-New Braunfels, TX
- State GDP YoY
- ▲ 3.95%
- F500 in state
- 110
Industry mix (Fortune 500 HQ in TX)
| Industry | F500 HQs | Revenue |
|---|---|---|
| Energy | 16 | $1,198B |
|
||
| Technology | 5 | $198B |
|
||
| Engineering / Construction | 4 | $72B |
|
||
| Energy Services | 3 | $60B |
|
||
| Utilities | 3 | $41B |
|
||
| Healthcare | 2 | $330B |
|
||
Price history
+14.3% since first listed9 events — show timeline
- 2026-05-23 Price Changed $182,900 LERA
- 2026-05-10 Listed $189,900 LERA
- 2026-04-25 Rental Removed $1,199 RENTLY
- 2026-04-16 Listed for Rent $1,199 RENTLY
- 2026-03-09 Listing Removed — LERA
- 2026-02-04 Price Changed $176,000 LERA
- 2025-11-13 Listed $179,000 LERA
- 2021-05-03 Sold (MLS) — LERA
- 2021-04-26 Listed $159,990 LERA
Cash-flow waterfall
monthlySold comps — $/sqft
last 12 mo · ≤1 miLoading sold comps…