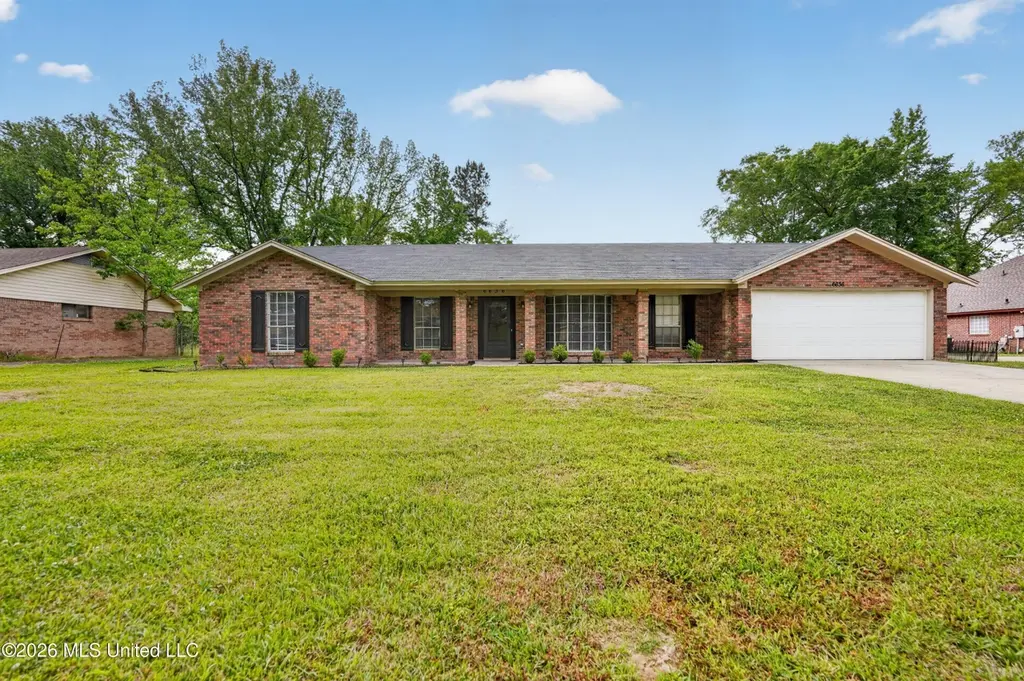
6636 Trace Dr · Jackson, MS
Flood risk 3/10 · Minor
- FEMA flood zone
- X (unshaded)
- Chance of flooding over 30 yrs
- 0.2%
- Est. flood insurance / yr
- $507 – $1,088
Fire risk 3/10 · Minor
- Est. fire insurance / yr
- $1,241 – $2,305
Heat risk 7/10 · Major
- Hot days now (above 107°F)
- 7 days/yr
- Hot days in 30 yrs
- 21 days/yr
Wind risk 8/10 · Major
- Chance of severe wind over 30 yrs
- 80.0%
Air-quality risk 1/10 · Minimal
- Unhealthy air days now
- 0 days/yr
- Unhealthy air days in 30 yrs
- 0 days/yr
Risk factors via First Street. Map © Google.
Why this score? — see what drove the C grade
The composite is a weighted blend of 9 inputs, each scored 0–100. Each bar is that input's sub-score; the figure is the points it added to the 100-point composite (weight × sub-score).
- Cash flow +18.7/30.0
- Appreciation +10.0/10.0
- ARV discount +6.6/15.0
- DSCR +5.9/10.0
- 1% rule +5.6/10.0
- Livability +3.4/5.0
- Rent growth +2.5/5.0
- Condition / age +2.5/5.0
- Schools +1.1/10.0
$114,900
🖨 Deal sheet 📄 Offer letter ✓ Due diligence
Listing remarks
Welcome to this charming 3-bedroom, 2-bath ranch-style home filled with natural light and inviting spaces throughout. The single-level layout offers easy, comfortable living, with bright and airy rooms that create a warm, welcoming atmosphere. The spacious living areas flow effortlessly, making it perfect for both everyday living and entertaining. Step outside to a huge yard with endless possibilities—ideal for gatherings, gardening, or simply enjoying the outdoors. This home combines convenience, charm, and space, making it a must-see!
Key facts
- Huge yard
- Natural light
- Single-level layout
Tags
Property features AI
Finance
- Other: Property located at 6636 Trace Dr, Jackson, MS 39213
- HOA & community: Community features: Other
Exterior
- Parking: Attached 2-car garage
- Utilities: Public water; Public sewer; Electricity available; Natural gas connected
- Home design: Single-family house; One level
- Construction: Slab foundation; Built in public-records year
- Exterior features: Asphalt roof; Shed(s); Other exterior features; Lot approximately 0.34 acres
Interior
- Kitchen: Range hood; Refrigerator
- Bathrooms: 2 full bathrooms
- Heating & cooling: Forced air heating; Central air conditioning
- Interior features: Range hood; Refrigerator; Fireplace (other type)
Neighborhood map
What this means for you Summary
Snapshot
- This is a 4-bed/2.0-bath single-family listed at $115k.
Deal economics
- At list price, monthly cash flow is $113 ($1k/yr) — positive.
- The deal already cash-flows at list — no discount required.
- Meets the 1% rule at list price ($1k rent vs $115k).
- Cap rate 7.5% vs local median 9.9% in Jackson — below-typical yield; the buyer is paying a premium for something (appreciation thesis, condition, location) that the cap rate doesn't capture.
Location & tenants
- Location reads 68/100 on livability (#66 in MS) — a middle-class / working-renter tenant base. Strengths: commute A+, cost of living A+, housing A+; Watch: amenities F, employment F, health & safety F.
- Jackson Public School District (urban): math 9% / reading 18% proficiency, ranked #112 of 130 in MS (top 86%) — low school quality limits family demand, transient renter base, plan for 1-2y turnover; 88% free/reduced lunch — lower-income household profile, screen leases tightly.
- Zoned schools: John Hopkins Elementary School (math 2% / reading 12%, grade F, #337 of 375 statewide, top 94%, 280 students, 100% FRL); Northwest Middle School (math 31% / reading 52%, grade F, #53 of 179 statewide, top 30%, 206 students, 100% FRL); Provine High School (math 4% / reading 15%, grade F, #179 of 197 statewide, top 92%, 774 students, 100% FRL).
- Market conditions: 81 active listings in the ZIP; 6 comparable units currently listed for rent nearby; rentals at typical pace (median 14d on market — plan ~3-4 weeks tenant-placement turnaround); lower-income renter base — watch delinquency; 167 units permitted in Hinds County in 2024 (0 in 5+ unit buildings).
- At $1,222/mo this rent would consume 50% of the median local household income ($30k/yr) (locally 1138% of renters already pay >50% of income on rent) — very limited rent-growth headroom before tenants either downsize or default.
Forward outlook
- In year one you build about $12k of equity ($794 loan paydown + $11k appreciation (10.0% local appreciation)).
- Hinds County population projected to shrink 6% by 2050 — rents likely to lag national; underwrite the cash flow, not the appreciation.
- At projected returns (10.0% appreciation + 3.0% rent growth), your $32k cash investment doubles in ~3 years — after that, you're playing with house money.
- By year 3, paydown + projected appreciation supports a ~$31k cash-out refi (75% LTV) — recoverable capital for the next deal without selling this one.
Negotiation context
- Only 11 days on market — expect competitive offers; lowballing is unlikely to land.
Risks & watch-outs
- Climate carrying-cost: severe wind risk, 80% chance of damaging wind over 30y; extreme-heat days projected 7→21/yr by 2055 (HVAC capex compounding) — expect insurance premiums to compound above CPI over the hold.
Questions for the listing agent
- Built in 1973 — when were the roof, HVAC, electrical panel, plumbing, and water heater last replaced?
- Is there a deadline driving the sale (1031 exchange, divorce, estate, relocation)? That informs how much negotiation room exists.
- Schools are F-rated, which usually means shorter tenancies and higher turnover. Who's the typical renter profile here, and what's been the actual vacancy rate?
- What's the average days-on-market for RENTAL listings here right now (not sales)? A rising rental-DOM trend means longer vacancies and softer asking-rent achievability than the comps imply.
- What's the recent tenant-quality profile in this submarket — average credit score on applications, eviction rate, late-payment / NSF rate, and stable-employment percentage? A property-management company in the area should have these aggregated.
- How much new for-sale + rental construction is in the pipeline within 1–3 miles? Heavy new supply typically softens prices + rents 12–24 months out; constrained supply supports both.
Investment metrics
- 1% rule
- 1.06% ✓
- Cap rate
- 7.47%
- Cash-on-cash
- 4.22%
- DSCR
- 1.19
- GRM
- 7.8
CMA / ARV
- ARV (median comp)
- $112,605
- List price
- $114,900
- Delta
- 2.04%
- Verdict
- FAIR
- Comps
- 20 within 1.0 mi
Show comp detail 10 sales within ~0.75 mi
| Address | Dist | Beds/Ba | Sqft | Sold | Price | $/sf | Match |
|---|---|---|---|---|---|---|---|
| 3530 N Flag Chapel Rd | 0.29mi | 4/1.5 | 1,321 (-2%) | 8mo | $115,000 | $87 | 75 |
| 3725 Thomas Jefferson Rd | 0.31mi | 3/1.0 (-1) | 1,296 (-4%) | 1mo | $103,000 | $79 | 69 |
| 6857 Harry S Truman Dr | 0.29mi | 3/2.0 (-1) | 1,294 (-4%) | 17mo | $103,000 | $80 | 61 |
| 138 James Monroe Pl | 0.27mi | 3/1.5 (-1) | 1,240 (-8%) | 10mo | $66,136 | $53 | 59 |
| 6734 Harry S Truman Dr | 0.33mi | 3/1.5 (-1) | 1,424 (+6%) | 12mo | $110,000 | $77 | 58 |
| 138 William Mckinley Cir | 0.34mi | 3/1.5 (-1) | 1,232 (-8%) | 8mo | $145,000 | $118 | 57 |
| 316 William Mckinley Cir | 0.37mi | 3/1.0 (-1) | 1,213 (-10%) | 2mo | $59,900 | $49 | 56 |
| 6827 Franklin D Roosevelt Dr | 0.19mi | 3/2.0 (-1) | 1,480 (+10%) | 20mo | $135,000 | $91 | 53 |
| 345 William Mckinley Cir | 0.42mi | 3/1.5 (-1) | 1,166 (-13%) | 1mo | $72,000 | $62 | 50 |
| 127 Lincoln Place Pl | 0.58mi | 3/2.0 (-1) | 1,264 (-6%) | 21mo | $83,000 | $66 | 40 |
Match score weights: distance 35% · size 25% · config 20% · recency 20%. Top-matched comps best support the ARV.
Projected returns pro-forma
10.0% appreciation · 3.0% rent growth · sell at horizon
- IRR
- 27.3%
- Equity multiple
- 3.17×
- Total profit
- $69,840
- Equity at exit
- $103,511
- IRR
- 23.9%
- Equity multiple
- 7.22×
- Total profit
- $200,106
- Equity at exit
- $223,225
Cash invested: $32,172 (down + closing). Projections, not guarantees.
Landlord ↔ Tenant lean methodology
- Overall (STATE)
- 90 Strongly Landlord-Friendly
- State Mississippi
- 90 Strongly Landlord-Friendly · R+11
- County
- — inherits STATE
- City
- — inherits STATE
ZIP-level market 39213
- Home prices YoY
- 7.0%
- Active inventory
- 81
- Price-to-rent
- 7.8×
Monthly cashflow live
- Estimated rent
- $1,222 high interval (Pro) →
- Mortgage (P&I)
- −$603
- Tax from tax record
- −$202 /mo · $2,421/yr
- Insurance
- −$48
- HOA
- −$0
- Vacancy / Maint / Mgmt
- −$257
- Net cashflow
- $113
Break-even live
UW: 25.0% down · 7.5% · 30yr · 1.5% tax · 5.0% vac · 8.0% maint · 8.0% mgmt
Financing live
Cash to close
- Down payment
- $28,725
- Closing costs
- $3,447
- Reserves months
- —
- Total cash needed
- —
Loan-product check · same deal, 3 products live
Conventional
25% down · 7.5% · 30yr
- Down + closing
- —
- Monthly P&I
- —
- Monthly cashflow
- —
- DSCR
- —
- Eligible?
- —
Personal DTI + credit; lowest rate.
DSCR
20% down · 8.5% · 30yr
- Down + closing
- —
- Monthly P&I
- —
- Monthly cashflow
- —
- DSCR
- —
- Eligible?
- —
No personal income docs; deal must DSCR.
Hard money
10% down · 12.0% · 12mo
- Down + closing
- —
- Monthly P&I
- —
- Monthly cashflow
- —
- DSCR
- —
- Eligible?
- —
Short-term bridge; refi at stabilization.
Rent comps 6 comps
| Address | Beds | Baths | Sqft | Rent | $/sqft | DOM | Units | Dist |
|---|---|---|---|---|---|---|---|---|
| 6521 Lyndon B Johnson Dr Jackson, MS | 3.0 | 1.0 | 1180 | $1,150 | $0.97 | 23d | 1 | 0.11mi |
| 6521 Lyndon B Johnson Dr Jackson, MS | 3.0 | 1.0 | 1180 | $1,100 | $0.93 | 14d | 1 | 0.11mi |
| 6605 George Washington Dr Jackson, MS | 3.0 | 2.0 | 1247 | $950 | $0.76 | 14d | 1 | 0.24mi |
| 6731 George Washington Dr Jackson, MS | 3.0 | 2.0 | 1134 | $1,300 | $1.15 | 23d | 1 | 0.44mi |
| 6731 George Washington Dr Jackson, MS | 3.0 | 2.0 | 1134 | $1,200 | $1.06 | 14d | 1 | 0.44mi |
| 6513 Abraham Lincoln Dr Jackson, MS | 3.0 | 1.5 | 1330 | $950 | $0.71 | 14d | 1 | 0.45mi |
Listing history 5 events
-
2026-05-14$114,900 Active 548-char remark
-
2022-04-25soldstatus
-
2017-02-16soldstatus
-
1987-08-27soldstatus
-
1975-11-14soldstatus
ⓘ Source: listings_history table (triggers on properties + properties_extension) + one-shot
backfill from property_details.listing_events for pre-trigger history.
Tax reassessment forecast MS · Resets to sale price
- Current annual tax
- $2,421 · $202/mo
- Projected year-2 tax
- $2,421 · $202/mo
- Expected delta
- $0/yr ($0/mo · 0.0%)
ⓘ Screening estimate from a state-policy table — verify with the county assessor before closing.
Climate risk First Street
- Flood 3/10 Moderate FEMA zone X (unshaded) · 20% chance over 30 yrs
- Wildfire 3/10 Moderate
- Heat 7/10 Severe 7 d/yr ≥107°F today · 21 d/yr by 30 yrs out
- Wind 8/10 Severe 80% chance of damaging wind over 30 yrs
- Air quality 1/10 Low 0 unhealthy d/yr today · 0 by 30 yrs out
Nearby sold comps map
Loading sold comps map…
Walkable amenities ~0.75 mi
Loading nearby amenities…
Taxation est. · year 1
- Rental income
- $14,664
- − Mortgage interest
- −$6,436
- − Property taxes
- −$2,421
- − Insurance
- −$574
- − Repairs & maintenance
- −$1,173
- − Management
- −$1,173
- − Depreciation
- −$3,343
- Taxable loss
- −$457
- Est. tax savings @ 24.0%
- +$110
- After-tax cash flow
- $1,468/yr
For passive investors: Depreciation is non-cash, so a rental often shows a tax loss while cash-flowing — sheltering income. Rental losses are passive: they offset passive income freely, and up to $25,000/yr can offset ordinary (W-2) income if you actively participate and your MAGI is under $100k (phasing out to $0 by $150k); unused losses carry forward. On sale, claimed depreciation is recaptured at up to 25%, and gains may owe capital-gains tax (a 1031 exchange can defer both). Figures are a year-1 estimate at your 24.0% rate — not tax advice; consult a CPA.
Schools (NCES district)
- District
- Jackson Public School District
- NCES district ID
- 2802190
- Math proficiency
- 9% ▼ -14.00%
- Reading proficiency
- 18% ▼ -7.00%
- Median HH income
- $33,234
- Composite
- 10.89/100
- National rank
- #9755
- State rank
- #112 of 130 in MS
Livability — Jackson
- Score
- 68/100
- State rank
- #66
- US rank
- #9695
Category grades
Schools grade is shown separately in the Schools card above.
Census & demographics
- Census place
- Jackson, MS
- County
- Hinds County · 167,040 people
- City population
- 140,204
- Metro
- Jackson, MS
- Population (ZIP)
- 18,691
- Household income
- $29,541
- Rent vs Own
- Severe rent burden
- 1138.0
Population outlook (Hinds County) Hauer SSP2
- Today (2025)
- 242,528 people
- By 2030
- 241,113 · -0.6%
- By 2040
- 235,557 · -2.9%
- By 2050
- 226,946 · -6.4%
- By 2075
- 199,995 · -17.5%
- By 2100
- 164,165 · -32.3%
Race, ethnicity, and origin ACS 2023
- Neighborhood character
- Predominantly Black (95%)
- Race & ethnicity
- Black 95% White 2% Two or more races 1% Hispanic / Latino 1%
- Foreign-born
- 0% · Canada
- Languages at home
- 98% English-only · Spanish 2%
Political lean MEDSL · Hinds
- 2024 margin
- Solid D (+46.1) · D 72.4% · R 26.3% · Other 1.4%
- 2008→2024 swing
- +7.1pp toward D · 2008: 39.0pp · 2024: 46.1pp
- All cycles
- 2024: D+46.1 2020: D+48.3 2016: D+43.7 2012: D+45.1 2008: D+39.0
Not yet ingested
- Civics
- —
Market trends
- HPI YoY
- ▲ 21.42%
- Current HPI
- 329.1844
- Rent YoY
- —
- Metro
- Jackson, MS
- State GDP YoY
- —
- F500 in state
- 0
Price history
6 events — show timeline
- 2026-05-25 Pending — MLSU
- 2026-05-14 Listed $114,900 MLSU
- 2022-04-25 Sold (Public Records) — Public Records
- 2017-02-16 Sold (Public Records) — Public Records
- 1987-08-27 Sold (Public Records) — Public Records
- 1975-11-14 Sold (Public Records) — Public Records
Property tax history
+38.2%/yrLatest (2025): $2,421 · +3.4% YoY. Source: county tax records.
Cash-flow waterfall
monthlySold comps — $/sqft
last 12 mo · ≤1 miLoading sold comps…