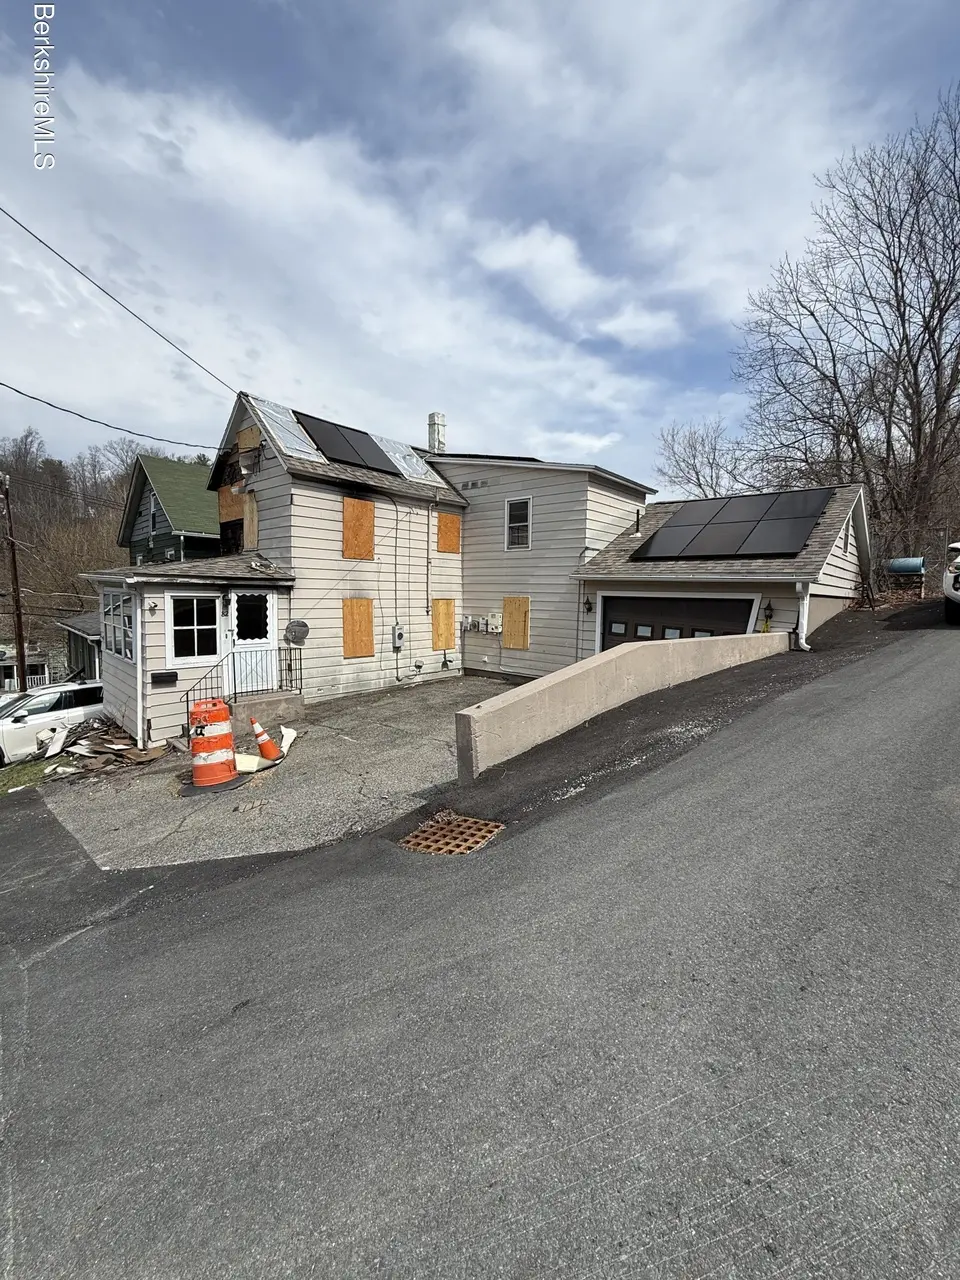
82 Dublin St · Lee, MA
Flood risk 1/10 · Minimal
- FEMA flood zone
- X
- Chance of flooding over 30 yrs
- 0.0%
- Est. flood insurance / yr
- $473 – $860
Fire risk 1/10 · Minimal
- Est. fire insurance / yr
- $915 – $1,699
Heat risk 2/10 · Minimal
- Hot days now (above 91°F)
- 7 days/yr
- Hot days in 30 yrs
- 16 days/yr
Wind risk 4/10 · Minor
- Chance of severe wind over 30 yrs
- 13.0%
Air-quality risk 2/10 · Minimal
- Unhealthy air days now
- 1 days/yr
- Unhealthy air days in 30 yrs
- 1 days/yr
Risk factors via First Street. Map © Google.
Why this score? — see what drove the B grade
The composite is a weighted blend of 9 inputs, each scored 0–100. Each bar is that input's sub-score; the figure is the points it added to the 100-point composite (weight × sub-score).
- Cash flow +30.0/30.0
- 1% rule +10.0/10.0
- DSCR +10.0/10.0
- ARV discount +7.5/15.0
- Appreciation +5.1/10.0
- Livability +3.7/5.0
- Schools +3.4/10.0
- Rent growth +2.5/5.0
- Condition / age +2.5/5.0
$59,000
🖨 Deal sheet 📄 Offer letter ✓ Due diligence
Listing remarks MLS
Property has sustained fire and/or smoke damage. The extent of damage may not be fully known. Seller has not undertaken repairs and will not make any repairs and makes no representations or warranties as to the condition of the property. Buyer and buyer's agents to perform all due diligence. Property may have structural, electrical, environmental, and/or water damage related to the fire and firefighting efforts. Entry may be limited due to safety concerns. Buyer responsible for verifying all information and obtaining any necessary permits. The property is being sold ''AS IS, WHERE IS, WITH ALL FAULTS'' Due to the age of the property and fire-related damage, hazardous materials such as asbestos and/or lead based materials may be present. Buyer is responsible for conducting all inspections.
Key facts
- 2,178 sq ft lot
- Garage
- Built 1915
Neighborhood map
What this means for you Summary
Snapshot
- This is a 3-bed/1.0-bath single-family listed at $59k.
Deal economics
- At list price, monthly cash flow is $917 ($11k/yr) — positive.
- The deal already cash-flows at list — no discount required.
- Meets the 1% rule at list price ($2k rent vs $59k).
- Recommended offer: $55k (6.0% below list) — sets the bar for market timing.
- Cap rate 25.0% vs local median 2.1% in Lee — top-decile yield for the area; either an underpriced asset or a hidden risk that comps aren't pricing in. Stress-test before assuming the spread holds.
Location & tenants
- Location reads 74/100 on livability (#88 in MA, #4,582 nationally) — a middle-class / working-renter tenant base. Strengths: housing A+, health & safety A+, crime B+; Watch: cost of living C-, amenities F.
- Lee (town): math 31% / reading 47% proficiency, ranked #211 of 302 in MA (top 70%) — families likely to look elsewhere, expect single-tenant / working-renter base with shorter leases.
- Market conditions: 39 active listings in the ZIP; 130 units permitted in Berkshire County in 2024 (10 in 5+ unit buildings).
Forward outlook
- In year one you build about $494 of equity ($408 loan paydown + $86 appreciation (0.1% local appreciation)).
- Berkshire County population projected at -24% by 2050 — secular population decline; favor cash flow + early exit over multi-decade hold.
- At projected returns (0.1% appreciation + 3.0% rent growth), your $17k cash investment doubles in ~2 years — after that, you're playing with house money.
Negotiation context
- It's been on market 62 days — a 6% lower offer ($55k) is reasonable based on typical stale-listing flexibility.
- 3 sale attempts since 13y ago with the ask held roughly flat each time — persistent listings suggest the price (not the market) is what's stuck; bring a comps-based counter.
Risks & watch-outs
- Watch-outs: built in 1915 — expect roof / HVAC / electrical / plumbing capex.
Questions for the listing agent
- It's been on market 62 days. Have you received any prior offers? Is the seller open to a 6% concession, seller financing, or rate buy-down credit?
- Built in 1915 — when were the roof, HVAC, electrical panel, plumbing, and water heater last replaced?
- Why hasn't it sold? Are there any deal-killer items the seller is aware of (foundation, flood, title, zoning, code violations)?
- Is there a deadline driving the sale (1031 exchange, divorce, estate, relocation)? That informs how much negotiation room exists.
- What's the average days-on-market for RENTAL listings here right now (not sales)? A rising rental-DOM trend means longer vacancies and softer asking-rent achievability than the comps imply.
- What's the recent tenant-quality profile in this submarket — average credit score on applications, eviction rate, late-payment / NSF rate, and stable-employment percentage? A property-management company in the area should have these aggregated.
- How much new for-sale + rental construction is in the pipeline within 1–3 miles? Heavy new supply typically softens prices + rents 12–24 months out; constrained supply supports both.
Investment metrics
- 1% rule
- 2.94% ✓
- Cap rate
- 24.95%
- Cash-on-cash
- 66.64%
- DSCR
- 3.97
- GRM
- 2.8
CMA / ARV
- ARV (median comp)
- $306,706
- List price
- $59,000
- Delta
- -80.76%
- Verdict
- UNDERPRICED
- Comps
- 20 within 1.0 mi
Show comp detail 2 sales within ~0.75 mi
| Address | Dist | Beds/Ba | Sqft | Sold | Price | $/sf | Match |
|---|---|---|---|---|---|---|---|
| 90 Maple St | 0.66mi | 3/1.5 | 1,140 (+10%) | 8mo | $315,000 | $276 | 43 |
| 325 Laurel St | 0.72mi | 2/1.5 (-1) | 1,076 (+4%) | 23mo | $250,000 | $232 | 33 |
Match score weights: distance 35% · size 25% · config 20% · recency 20%. Top-matched comps best support the ARV.
Projected returns pro-forma
0.15% appreciation · 3.0% rent growth · sell at horizon
- IRR
- 68.8%
- Equity multiple
- 4.46×
- Total profit
- $57,163
- Equity at exit
- $17,564
- IRR
- 70.5%
- Equity multiple
- 9.08×
- Total profit
- $133,435
- Equity at exit
- $21,460
Cash invested: $16,520 (down + closing). Projections, not guarantees.
Landlord ↔ Tenant lean methodology
- Overall (STATE)
- 20 Strongly Tenant-Friendly
- State Massachusetts
- 20 Strongly Tenant-Friendly · D+15
- County
- — inherits STATE
- City
- — inherits STATE
ZIP-level market 01238
- Home prices YoY
- 0.1%
- Active inventory
- 39
- Price-to-rent
- 2.8×
Monthly cashflow live
- Estimated rent
- $1,735 medium interval (Pro) →
- Mortgage (P&I)
- −$309
- Tax from tax record
- −$120 /mo · $1,435/yr
- Insurance
- −$25
- HOA
- −$0
- Vacancy / Maint / Mgmt
- −$364
- Net cashflow
- $917
Break-even live
UW: 25.0% down · 7.5% · 30yr · 1.5% tax · 5.0% vac · 8.0% maint · 8.0% mgmt
Financing live
Cash to close
- Down payment
- $14,750
- Closing costs
- $1,770
- Reserves months
- —
- Total cash needed
- —
Loan-product check · same deal, 3 products live
Conventional
25% down · 7.5% · 30yr
- Down + closing
- —
- Monthly P&I
- —
- Monthly cashflow
- —
- DSCR
- —
- Eligible?
- —
Personal DTI + credit; lowest rate.
DSCR
20% down · 8.5% · 30yr
- Down + closing
- —
- Monthly P&I
- —
- Monthly cashflow
- —
- DSCR
- —
- Eligible?
- —
No personal income docs; deal must DSCR.
Hard money
10% down · 12.0% · 12mo
- Down + closing
- —
- Monthly P&I
- —
- Monthly cashflow
- —
- DSCR
- —
- Eligible?
- —
Short-term bridge; refi at stabilization.
Listing history 21 events
-
2026-06-18statusdays on market $59,000 Pending 62 DOM
-
2026-06-17days on market $59,000 Active 61 DOM
-
2026-06-16days on market $59,000 Active 60 DOM
-
2026-06-15days on market $59,000 Active 59 DOM
-
2026-06-13days on market $59,000 Active 57 DOM
-
2026-06-12days on market $59,000 Active 56 DOM
-
2026-06-09days on market $59,000 Active 53 DOM
-
2026-06-08days on market $59,000 Active 52 DOM
-
2026-06-07days on market $59,000 Active 51 DOM
-
2026-06-07days on market $59,000 Active 50 DOM
-
2026-06-04days on market $59,000 Active 47 DOM
-
2026-06-02days on market $59,000 Active 46 DOM
-
2026-06-01days on market $59,000 Active 45 DOM
-
2026-05-31days on market $59,000 Active 44 DOM
-
2026-05-31days on market $59,000 Active 43 DOM
-
2026-04-15$59,000 Active 800-char remark
Show marketing remark (800 chars)
Property has sustained fire and/or smoke damage. The extent of damage may not be fully known. Seller has not undertaken repairs and will not make any repairs and makes no representations or warranties as to the condition of the property. Buyer and buyer's agents to perform all due diligence. Property may have structural, electrical, environmental, and/or water damage related to the fire and firefighting efforts. Entry may be limited due to safety concerns. Buyer responsible for verifying all information and obtaining any necessary permits. The property is being sold ''AS IS, WHERE IS, WITH ALL FAULTS'' Due to the age of the property and fire-related damage, hazardous materials such as asbestos and/or lead based materials may be present. Buyer is responsible for conducting all inspections.
-
2020-01-06soldstatus $85,500 123-char remark
Show marketing remark (123 chars)
Lee Home under $100,000 This 3 Bedroom New England farmhouse with 1and 1/2 Bath , fenced yard ,garage . close to downtown .
-
2019-09-24$99,900 123-char remark
Show marketing remark (123 chars)
Lee Home under $100,000 This 3 Bedroom New England farmhouse with 1and 1/2 Bath , fenced yard ,garage . close to downtown .
-
2014-11-14soldstatus $70,000
-
2013-11-19$75,000
-
1901-01-01soldstatus $11,111
ⓘ Source: listings_history table (triggers on properties + properties_extension) + one-shot
backfill from property_details.listing_events for pre-trigger history.
Tax reassessment forecast MA · Partial reset (capped growth)
- Current annual tax
- $1,435 · $120/mo
- Projected year-2 tax
- $1,435 · $120/mo
- Expected delta
- $0/yr ($0/mo · 0.0%)
ⓘ Screening estimate from a state-policy table — verify with the county assessor before closing.
Climate risk First Street
- Flood 1/10 Low FEMA zone X · 0% chance over 30 yrs
- Wildfire 1/10 Low
- Heat 2/10 Low 7 d/yr ≥91°F today · 16 d/yr by 30 yrs out
- Wind 4/10 Moderate 13% chance of damaging wind over 30 yrs
- Air quality 2/10 Low 1 unhealthy d/yr today · 1 by 30 yrs out
Nearby sold comps map
Loading sold comps map…
Walkable amenities ~0.75 mi
Loading nearby amenities…
Taxation est. · year 1
- Rental income
- $20,825
- − Mortgage interest
- −$3,305
- − Property taxes
- −$1,435
- − Insurance
- −$295
- − Repairs & maintenance
- −$1,666
- − Management
- −$1,666
- − Depreciation
- −$1,716
- Taxable income
- $10,741
- Est. tax owed @ 24.0%
- −$2,578
- After-tax cash flow
- $8,431/yr
For passive investors: Depreciation is non-cash, so a rental often shows a tax loss while cash-flowing — sheltering income. Rental losses are passive: they offset passive income freely, and up to $25,000/yr can offset ordinary (W-2) income if you actively participate and your MAGI is under $100k (phasing out to $0 by $150k); unused losses carry forward. On sale, claimed depreciation is recaptured at up to 25%, and gains may owe capital-gains tax (a 1031 exchange can defer both). Figures are a year-1 estimate at your 24.0% rate — not tax advice; consult a CPA.
Schools (NCES district)
- District
- Lee
- NCES district ID
- 2506690
- Math proficiency
- 31% ▼ -16.00%
- Reading proficiency
- 47% ▼ -5.00%
- Median HH income
- $58,112
- Composite
- 34.38/100
- National rank
- #5212
- State rank
- #211 of 302 in MA
Livability — Lee
- Score
- 74/100
- State rank
- #88
- US rank
- #4582
Category grades
Schools grade is shown separately in the Schools card above.
Census & demographics
- Census place
- Lee, MA
- Population (ZIP)
- 5,893
Population outlook (Berkshire County) Hauer SSP2
- Today (2025)
- 119,723 people
- By 2030
- 114,608 · -4.3%
- By 2040
- 102,806 · -14.1%
- By 2050
- 91,305 · -23.7%
- By 2075
- 71,517 · -40.3%
- By 2100
- 57,988 · -51.6%
Race, ethnicity, and origin ACS 2023
- Neighborhood character
- Predominantly White (91%)
- Race & ethnicity
- White 91% Two or more races 4% Hispanic / Latino 3% Asian 2%
- Common ancestry
- Lithuanian 16% Romanian 6% Slovak 4%
- Foreign-born
- 7% · Canada
- Languages at home
- 94% English-only · Other Asian/Pacific 2% Spanish 2% Other Indo-European 2%
Political lean MEDSL · Berkshire
- 2024 margin
- Solid D (+39.9) · D 68.9% · R 29.0% · Other 2.1%
- 2008→2024 swing
- -12.5pp toward R · 2008: 52.4pp · 2024: 39.9pp
- All cycles
- 2024: D+39.9 2020: D+47.1 2016: D+41.5 2012: D+53.7 2008: D+52.4
Not yet ingested
- Civics
- —
Market trends
- HPI YoY
- ▲ 0.15%
- Current HPI
- 294.592
- Rent YoY
- —
- Metro
- —
- State GDP YoY
- ▲ 2.28%
- F500 in state
- 38
Industry mix (Fortune 500 HQ in MA)
| Industry | F500 HQs | Revenue |
|---|---|---|
| Technology | 3 | $17B |
|
||
| Insurance | 2 | $84B |
|
||
| Retail | 2 | $76B |
|
||
| Life Sciences | 1 | $43B |
|
||
| Energy Technology | 1 | $31B |
|
||
| Aerospace / Defense | 1 | $18B |
|
||
Price history
+431.0% since first listed6 events — show timeline
- 2026-04-15 Listed $59,000 BCMLS
- 2020-01-06 Sold (MLS) $85,500 BCMLS
- 2019-09-24 Listed $99,900 BCMLS
- 2014-11-14 Sold (MLS) $70,000 BCMLS
- 2013-11-19 Listed $75,000 BCMLS
- 1901-01-01 Sold (Public Records) $11,111 Public Records
Property tax history
-2.8%/yrLatest (2023): $1,435 · +13.1% YoY. Source: county tax records.
Cash-flow waterfall
monthlySold comps — $/sqft
last 12 mo · ≤1 miLoading sold comps…