 🏗️ New Construction
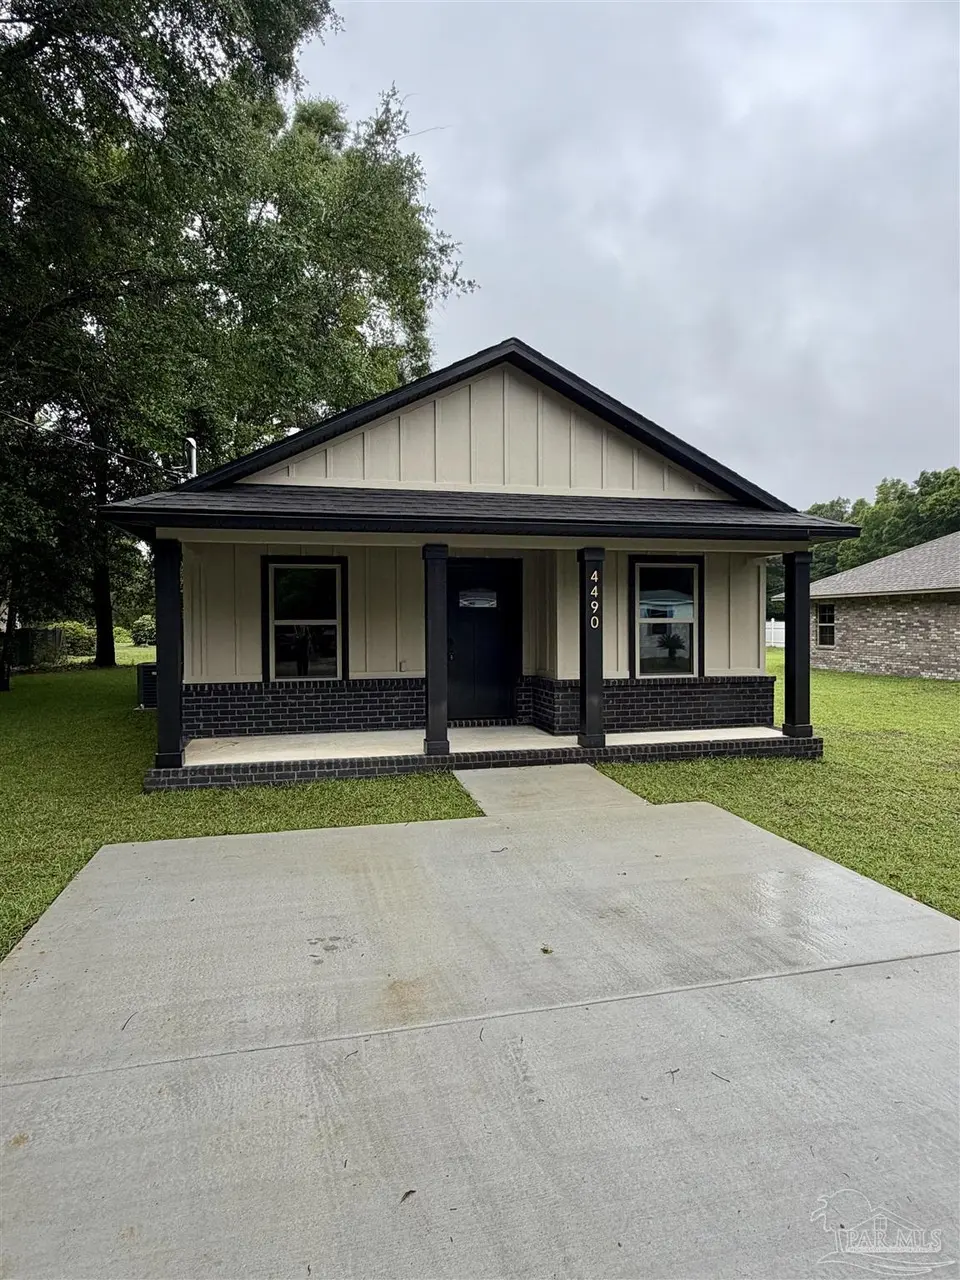
4490 Oak Ln · Pace, FL
Flood risk 1/10 · Minimal
- FEMA flood zone
- X (unshaded)
- Chance of flooding over 30 yrs
- 0.0%
- Est. flood insurance / yr
- $507 – $1,088
Fire risk 3/10 · Minor
- Est. fire insurance / yr
- $947 – $1,759
Heat risk 9/10 · Severe
- Hot days now (above 105°F)
- 7 days/yr
- Hot days in 30 yrs
- 22 days/yr
Wind risk 9/10 · Severe
- Chance of severe wind over 30 yrs
- 99.0%
Air-quality risk 1/10 · Minimal
- Unhealthy air days now
- 0 days/yr
- Unhealthy air days in 30 yrs
- 0 days/yr
Risk factors via First Street. Map © Google.
Why this score? — see what drove the C- grade
The composite is a weighted blend of 9 inputs, each scored 0–100. Each bar is that input's sub-score; the figure is the points it added to the 100-point composite (weight × sub-score).
- Cash flow +17.7/30.0
- ARV discount +7.5/15.0
- DSCR +5.5/10.0
- Schools +5.3/10.0
- 1% rule +4.8/10.0
- Condition / age +4.0/5.0
- Livability +3.5/5.0
- Rent growth +3.2/5.0
- Appreciation +0.0/10.0
$229,400
🖨 Deal sheet 📄 Offer letter ✓ Due diligence
Listing remarks
Welcome to this charming new home, thoughtfully designed with quality materials, stylish finishes, and everyday convenience in mind. Whether you’re a first-time buyer, looking to downsize, or simply ready for something new, this property delivers lasting value in a prime location. This beautifully built home offers 3 bedrooms and 2 full bathrooms across 1,178 square feet of smart, functional living space—not including the porch. The timeless brick exterior offers classic curb appeal and low-maintenance durability. While exterior painting and shutters are still being completed, the home is nearly move-in ready and full of high-end features. Inside, you'll find elegant granite cou
Key facts
- Custom cabinetry
- Brick exterior
- Granite countertops
Tags
Property features AI
Finance
- HOA & community: No homeowners association
Exterior
- Parking: Driveway with open parking
- Security: Smoke detectors
- Utilities: Public water; Public sewer; Circuit breaker electrical service
- Home design: New construction; Detached single-story home; Frame construction
- Construction: Composition roof; Slab foundation; Built with frame materials
- Exterior features: Central access neighborhood; Interior lot; Paved, county-maintained road
Interior
- Kitchen: Updated kitchen (about 1 year; described as brand new)
- Bedrooms: Primary bedroom on the first floor, approximately 12' x 11.2'
- Bathrooms: Two full bathrooms; Recently updated bathrooms (about 1 year; described as brand new)
- Heating & cooling: Heat pump for heating and cooling; Ceiling fans
- Interior features: Insulated doors; Double-pane windows; Low-flow plumbing fixtures
- Laundry & utility: Electric water heater
Neighborhood map
What this means for you Summary
Snapshot
- This is a 3-bed/2.0-bath single-family listed at $229k. Condition is rated good.
Deal economics
- At list price, monthly cash flow is $182 ($2k/yr) — positive.
- The deal already cash-flows at list — no discount required.
- To meet the 1% rule (rent ≥ 1% of price), the offer needs to be $219k (4.6% below list).
- Recommended offer: $219k (4.6% below list) — sets the bar for 1% rule.
- Cap rate 7.3% vs local median 4.5% in Pace — top-decile yield for the area; either an underpriced asset or a hidden risk that comps aren't pricing in. Stress-test before assuming the spread holds.
Location & tenants
- Location reads 69/100 on livability (#475 in FL) — a middle-class / working-renter tenant base. Strengths: cost of living A+, housing A+, schools B+; Watch: amenities F, commute F, health & safety F.
- Santa Rosa (suburban): math 63% / reading 60% proficiency, ranked #8 of 73 in FL (top 11%) — acceptable for families but not a draw, mixed tenant base, ~2y average lease.
- Market conditions: Rents rising (+2.7%/yr); 360 active listings in the ZIP; 7 comparable units currently listed for rent nearby; rentals leasing fast (median 14d on market — plan ~1-2 weeks tenant-placement turnaround); solid renter incomes; 1,983 units permitted in Santa Rosa County in 2024 (128 in 5+ unit buildings).
- This rent runs 34% of the median local income ($77k/yr) — at the standard rent-burdened threshold; future hikes will face affordability resistance.
Forward outlook
- Local home prices are declining (-3.0%/yr); year-one equity from $2k of loan paydown is wiped out by about $7k of value loss. Plan a longer hold.
- Santa Rosa County population projected at +31% by 2050 — long-run rental-demand tailwind backs the buy-and-hold thesis.
Negotiation context
- It's been on market 50 days — a 3% lower offer ($223k) is reasonable based on typical stale-listing flexibility.
- 2 sale attempts with the ask held roughly flat each time — persistent listings suggest the price (not the market) is what's stuck; bring a comps-based counter.
Risks & watch-outs
- Climate carrying-cost: severe wind risk, 99% chance of damaging wind over 30y; extreme-heat days projected 7→22/yr by 2055 (HVAC capex compounding) — expect insurance premiums to compound above CPI over the hold.
Questions for the listing agent
- It's been on market 50 days. Have you received any prior offers? Is the seller open to a 5% concession, seller financing, or rate buy-down credit?
- Is there a deadline driving the sale (1031 exchange, divorce, estate, relocation)? That informs how much negotiation room exists.
- Schools are B-rated — typically a magnet for longer-tenancy family renters. What's the average tenant stay here, and is there a school-zone premium baked into asking?
- What's the average days-on-market for RENTAL listings here right now (not sales)? A rising rental-DOM trend means longer vacancies and softer asking-rent achievability than the comps imply.
- What's the recent tenant-quality profile in this submarket — average credit score on applications, eviction rate, late-payment / NSF rate, and stable-employment percentage? A property-management company in the area should have these aggregated.
- How much new for-sale + rental construction is in the pipeline within 1–3 miles? Heavy new supply typically softens prices + rents 12–24 months out; constrained supply supports both.
Investment metrics
- 1% rule
- 0.98% ✗
- Cap rate
- 7.27%
- Cash-on-cash
- 3.48%
- DSCR
- 1.15
- GRM
- 8.5
CMA / ARV
- ARV (on-the-fly)
- $223,820
- Comps found
- 5
Show comp detail 5 sales within ~0.75 mi
| Address | Dist | Beds/Ba | Sqft | Sold | Price | $/sf | Match |
|---|---|---|---|---|---|---|---|
| 4175 Bell Ln | 0.68mi | 3/2.0 | 1,200 (+2%) | 4mo | $209,200 | $174 | 62 |
| 5612 Peach Dr | 0.38mi | 3/2.0 | 1,318 (+12%) | 2mo | $250,000 | $190 | 61 |
| 4852 Covenant Cir | 0.27mi | 3/2.0 | 1,348 (+14%) | 17mo | $269,000 | $200 | 50 |
| 4775 Landmark Ln | 0.70mi | 3/2.0 | 1,206 (+2%) | 18mo | $263,000 | $218 | 48 |
| 5535 Peach Dr | 0.58mi | 3/2.0 | 1,318 (+12%) | 11mo | $249,000 | $189 | 44 |
Match score weights: distance 35% · size 25% · config 20% · recency 20%. Top-matched comps best support the ARV.
Projected returns pro-forma
-3.0% appreciation · 2.7% rent growth · sell at horizon
- IRR
- -11.2%
- Equity multiple
- 0.60×
- Total profit
- $-25,333
- Equity at exit
- $33,372
- IRR
- -2.3%
- Equity multiple
- 0.84×
- Total profit
- $-9,724
- Equity at exit
- $19,352
Cash invested: $62,670 (down + closing). Projections, not guarantees.
Landlord ↔ Tenant lean methodology
- Overall (STATE)
- 87 Strongly Landlord-Friendly
- State Florida
- 87 Strongly Landlord-Friendly · R+3
- County
- — inherits STATE
- City
- — inherits STATE
ZIP-level market 32570
- Home prices YoY
- -15.1%
- Rents YoY
- 2.7%
- Active inventory
- 360
- Price-to-rent
- 8.7×
Monthly cashflow live
- Estimated rent
- $2,188 high interval (Pro) →
- Mortgage (P&I)
- −$1,174
- Tax est. 1.5%
- −$280 /mo · $3,357/yr
- Insurance
- −$93
- HOA
- −$0
- Vacancy / Maint / Mgmt
- −$459
- Net cashflow
- $182
Break-even live
UW: 25.0% down · 7.5% · 30yr · 1.5% tax · 5.0% vac · 8.0% maint · 8.0% mgmt
Financing live
Cash to close
- Down payment
- $55,955
- Closing costs
- $6,715
- Reserves months
- —
- Total cash needed
- —
Loan-product check · same deal, 3 products live
Conventional
25% down · 7.5% · 30yr
- Down + closing
- —
- Monthly P&I
- —
- Monthly cashflow
- —
- DSCR
- —
- Eligible?
- —
Personal DTI + credit; lowest rate.
DSCR
20% down · 8.5% · 30yr
- Down + closing
- —
- Monthly P&I
- —
- Monthly cashflow
- —
- DSCR
- —
- Eligible?
- —
No personal income docs; deal must DSCR.
Hard money
10% down · 12.0% · 12mo
- Down + closing
- —
- Monthly P&I
- —
- Monthly cashflow
- —
- DSCR
- —
- Eligible?
- —
Short-term bridge; refi at stabilization.
Rent comps 7 comps
| Address | Beds | Baths | Sqft | Rent | $/sqft | DOM | Units | Dist |
|---|---|---|---|---|---|---|---|---|
| 4413 Oak Vista Ln Milton, FL | 1.0–3.0 | 1.0–2.0 | 992 | $2,354 | $2.37 | 13d | 18 | 0.03mi |
| 5574 Peach Dr Milton, FL | 3.0 | 2.0 | 1475 | $1,900 | $1.29 | 23d | 1 | 0.46mi |
| 4328 Tiger Oak Ct Milton, FL | 4.0 | 2.0 | 1347 | $1,850 | $1.37 | 23d | 1 | 0.51mi |
| 4025 Brittany Ln Milton, FL | 3.0 | 2.0 | 1405 | $1,725 | $1.23 | 21d | 1 | 0.77mi |
| 4933 Bell Ridge Ln Milton, FL | 1.0–3.0 | 1.0–2.0 | 865 | $1,437 | $1.66 | 13d | 8 | 1.36mi |
| 5385 E Avenida de Golf Milton, FL | 2.0 | 1.0 | 792 | $1,200 | $1.52 | 13d | 1 | 1.42mi |
| 5604 Shooting Star Ct Milton, FL | 3.0 | 2.0 | 1324 | $2,300 | $1.74 | 13d | 1 | 1.48mi |
Listing history 18 events
-
2026-06-18days on market $229,400 Active 50 DOM
-
2026-06-17days on market $229,400 Active 49 DOM
-
2026-06-16days on market $229,400 Active 48 DOM
-
2026-06-15days on market $229,400 Active 47 DOM
-
2026-06-14days on market $229,400 Active 45 DOM
-
2026-06-10days on market $229,400 Active 42 DOM
-
2026-06-09days on market $229,400 Active 41 DOM
-
2026-06-08days on market $229,400 Active 40 DOM
-
2026-06-07days on market $229,400 Active 39 DOM
-
2026-06-05days on market $229,400 Active 36 DOM
-
2026-06-03days on market $229,400 Active 35 DOM
-
2026-06-02days on market $229,400 Active 34 DOM
-
2026-06-01days on market $229,400 Active 33 DOM
-
2026-05-31days on market $229,400 Active 32 DOM
-
2026-05-31days on market $229,400 Active 31 DOM
-
2026-05-19status Active
-
2026-05-15historical Contingent
-
2026-04-29$229,400 Active
ⓘ Source: listings_history table (triggers on properties + properties_extension) + one-shot
backfill from property_details.listing_events for pre-trigger history.
Climate risk First Street
- Flood 1/10 Low FEMA zone X (unshaded) · 0% chance over 30 yrs
- Wildfire 3/10 Moderate
- Heat 9/10 Extreme 7 d/yr ≥105°F today · 22 d/yr by 30 yrs out
- Wind 9/10 Extreme 99% chance of damaging wind over 30 yrs
- Air quality 1/10 Low 0 unhealthy d/yr today · 0 by 30 yrs out
Nearby sold comps map
Loading sold comps map…
Walkable amenities ~0.75 mi
Loading nearby amenities…
Taxation est. · year 1
- Rental income
- $26,253
- − Mortgage interest
- −$12,537
- − Property taxes
- −$3,357
- − Insurance
- −$1,119
- − Repairs & maintenance
- −$2,100
- − Management
- −$2,100
- − Depreciation
- −$6,511
- Taxable loss
- −$1,473
- Est. tax savings @ 24.0%
- +$353
- After-tax cash flow
- $2,532/yr
For passive investors: Depreciation is non-cash, so a rental often shows a tax loss while cash-flowing — sheltering income. Rental losses are passive: they offset passive income freely, and up to $25,000/yr can offset ordinary (W-2) income if you actively participate and your MAGI is under $100k (phasing out to $0 by $150k); unused losses carry forward. On sale, claimed depreciation is recaptured at up to 25%, and gains may owe capital-gains tax (a 1031 exchange can defer both). Figures are a year-1 estimate at your 24.0% rate — not tax advice; consult a CPA.
Condition & rehab AI · 12 photos
This nearly move-in-ready home offers a good condition with modern finishes and a prime location. It's a great opportunity for an investor looking to add value through minor improvements.
Value-add opportunities
- Both Painting exterior and shutters — Enhances curb appeal and adds value.
- Both Landscaping improvements — Enhances curb appeal and adds value.
- Both Add smart home features — Improves convenience and adds value.
- Both Install smart thermostat — Saves on energy costs and adds value.
- Both Add smart lighting system — Saves on energy costs and adds value.
Renovation cost estimate screening
Value-add ROI direction
- Both Painting exterior and shutters — Enhances curb appeal and adds value. ↑
- Both Landscaping improvements — Enhances curb appeal and adds value. ↑
- Both Add smart home features — Improves convenience and adds value. ↑
- Both Install smart thermostat — Saves on energy costs and adds value. ↑
- Both Add smart lighting system — Saves on energy costs and adds value. ↑
ⓘ Cost ranges are severity-bucket heuristics (US national rule-of-thumb). Get contractor quotes + a written scope before underwriting a rehab budget.
Schools (NCES district)
- District
- Santa Rosa
- NCES district ID
- 1201650
- Math proficiency
- 63% ▼ -6.00%
- Reading proficiency
- 60% ▼ -5.00%
- Median HH income
- $58,161
- Composite
- 53.12/100
- National rank
- #1511
- State rank
- #8 of 73 in FL
Livability — Pace
- Score
- 69/100
- State rank
- #475
- US rank
- #8593
Category grades
Schools grade is shown separately in the Schools card above.
Census & demographics
- County
- Santa Rosa County · 194,764 people
- Metro
- Pensacola-Ferry Pass-Brent, FL
- Population (ZIP)
- 37,197
- Household income
- $77,222
- Rent vs Own
- Severe rent burden
- 590.0
Population outlook (Santa Rosa County) Hauer SSP2
- Today (2025)
- 195,978 people
- By 2030
- 209,782 · +7.0%
- By 2040
- 235,293 · +20.1%
- By 2050
- 256,408 · +30.8%
- By 2075
- 298,074 · +52.1%
- By 2100
- 303,216 · +54.7%
Race, ethnicity, and origin ACS 2023
- Neighborhood character
- Predominantly White (80%)
- Race & ethnicity
- White 80% Two or more races 7% Black 6% Hispanic / Latino 6% Asian 1%
- Hispanic origin (detail)
- Mexican 2% Puerto Rican 2%
- Common ancestry
- Italian 4% Lithuanian 3% Portuguese 2%
- Foreign-born
- 4% · Canada
- Languages at home
- 94% English-only · Spanish 4% Other Asian/Pacific 1%
Political lean MEDSL · Santa Rosa
- 2024 margin
- Solid R (+51.0) · D 24.1% · R 75.0%
- 2008→2024 swing
- -3.0pp toward R · 2008: -47.9pp · 2024: -51.0pp
- All cycles
- 2024: R+51.0 2020: R+46.5 2016: R+53.5 2012: R+52.6 2008: R+47.9
Not yet ingested
- Civics
- —
Market trends
- HPI YoY
- ▼ -51.06%
- Current HPI
- 287.7469
- Rent YoY
- ▲ 2.70%
- Metro
- Pensacola-Ferry Pass-Brent, FL
- State GDP YoY
- ▲ 3.28%
- F500 in state
- 36
Industry mix (Fortune 500 HQ in FL)
| Industry | F500 HQs | Revenue |
|---|---|---|
| Industrial Technology | 2 | $29B |
|
||
| Insurance | 2 | $17B |
|
||
| Retail | 1 | $60B |
|
||
| Technology Distribution | 1 | $58B |
|
||
| Homebuilding | 1 | $35B |
|
||
| Technology Manufacturing | 1 | $35B |
|
||
Price history
3 events — show timeline
- 2026-05-19 Relisted — PARMLS
- 2026-05-15 Contingent — PARMLS
- 2026-04-29 Listed $229,400 PARMLS
Cash-flow waterfall
monthlySold comps — $/sqft
last 12 mo · ≤1 miLoading sold comps…