 Triplex
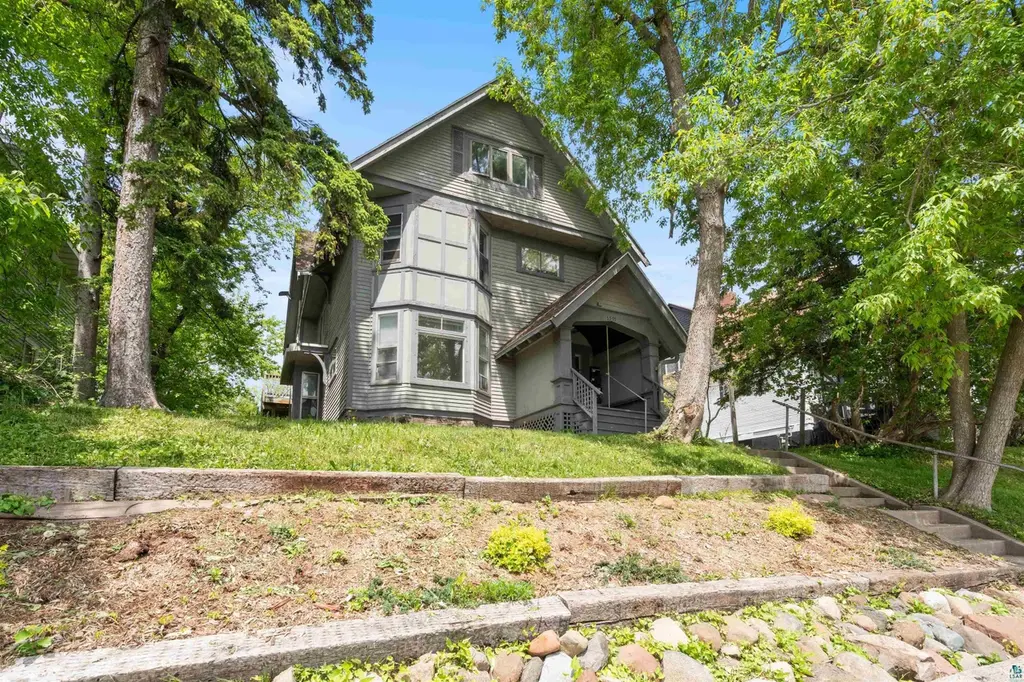
1511 E 4th St · Duluth, MN
Flood risk 1/10 · Minimal
- FEMA flood zone
- X
- Chance of flooding over 30 yrs
- 0.0%
- Est. flood insurance / yr
- $473 – $860
Fire risk 1/10 · Minimal
- Est. fire insurance / yr
- $888 – $1,650
Heat risk 1/10 · Minimal
- Hot days now (above 90°F)
- 7 days/yr
- Hot days in 30 yrs
- 12 days/yr
Wind risk 1/10 · Minimal
- Chance of severe wind over 30 yrs
- —
Air-quality risk 2/10 · Minimal
- Unhealthy air days now
- 0 days/yr
- Unhealthy air days in 30 yrs
- 1 days/yr
Risk factors via First Street. Map © Google.
Why this score? — see what drove the C+ grade
The composite is a weighted blend of 9 inputs, each scored 0–100. Each bar is that input's sub-score; the figure is the points it added to the 100-point composite (weight × sub-score).
- Cash flow +28.1/30.0
- DSCR +10.0/10.0
- 1% rule +7.4/10.0
- Rent growth +4.5/5.0
- Schools +4.2/10.0
- Livability +4.1/5.0
- Condition / age +2.5/5.0
- ARV discount +0.2/15.0
- Appreciation +0.0/10.0
$359,900
🖨 Deal sheet (PDF) 📄 Offer letter ✓ Due diligence
Multi-family units
County records classify this as Multi-Family (2-4 Unit). Listing-text estimate: 3 units. confirmed
Listing remarks
This well-maintained triplex offers an outstanding investment opportunity in a highly desirable location near local colleges, medical centers, downtown amenities, and major employment hubs. Featuring three licensed rental units, the property provides strong income potential, flexibility, and long-term rental appeal. Unit 1 is currently vacant and being marketed for rent at $1,600 per month with the owner paying utilities, offering an excellent opportunity to secure a new tenant at market rent or occupy the unit yourself. Unit 2 is leased at $1,300 per month through July 30, 2027, providing stable long-term income. Unit 3 is currently vacant and being marketed for rent at $1,200 per month wi
Key facts
- 6,970 sq ft lot
- Built 1905
- Listed 10 days
Tags
Property features AI
Finance
- Other:
- Financial info: One unit currently rents for $1,300/month; Two units are marketed vacant at $1,200/month and $1,600/month
- HOA & community:
Exterior
- Parking: No parking listed
- Security:
- Utilities: Public water; Public sewer
- Home design: Triplex residential income property; 3 stories total
- Construction: Stone foundation
- Exterior features: Asphalt shingle roof
Interior
- Kitchen:
- Bedrooms: One 1-bedroom unit (marketing rent $1,200/month); One 2-bedroom unit (current rent $1,300/month); One 3-bedroom unit (marketing rent $1,600/month)
- Flooring:
- Bathrooms: Each unit has 1 bathroom
- Heating & cooling: Natural gas heating
- Interior features: Full basement
- Laundry & utility: Laundry located in the basement
Neighborhood map
What this means for you Summary
Snapshot
- This is a 3 × 2-bed/1.0-bath units multifamily listed at $360k.
Deal economics
- At list price, monthly cash flow is $1k ($14k/yr) — positive. Per door: $376/mo.
- The deal already cash-flows at list — no discount required.
- Meets the 1% rule at list price ($4k rent vs $360k).
- Cap rate 10.1% vs local median 4.9% in Duluth — top-decile yield for the area; either an underpriced asset or a hidden risk that comps aren't pricing in. Stress-test before assuming the spread holds.
Location & tenants
- Location reads 82/100 on livability (#36 in MN, #1,060 nationally) — a professional / high-income tenant draw. Strengths: commute A+, cost of living A+, housing A+; Watch: amenities F.
- Duluth Public School District (urban): math 44% / reading 55% proficiency, ranked #132 of 301 in MN (top 44%) — families likely to look elsewhere, expect single-tenant / working-renter base with shorter leases.
- Market conditions: Rents rising fast (+8.1%/yr); 50 active listings in the ZIP; 4 comparable units currently listed for rent nearby; rentals at typical pace (median 22d on market — plan ~3-4 weeks tenant-placement turnaround); 639 units permitted in St. Louis County in 2024 (338 in 5+ unit buildings).
- At $4,473/mo this rent would consume 82% of the median local household income ($66k/yr) (locally 655% of renters already pay >50% of income on rent) — very limited rent-growth headroom before tenants either downsize or default.
Forward outlook
- Local home prices are declining (-3.0%/yr); year-one equity from $2k of loan paydown is wiped out by about $11k of value loss. Plan a longer hold.
- At projected returns (-3.0% appreciation + 8.0% rent growth), your $101k cash investment doubles in ~7 years — after that, you're playing with house money.
Negotiation context
- Only 11 days on market — expect competitive offers; lowballing is unlikely to land.
- 9 sale attempts since 13y ago with the ask held roughly flat each time — persistent listings suggest the price (not the market) is what's stuck; bring a comps-based counter.
Risks & watch-outs
- Watch-outs: built in 1905 — expect roof / HVAC / electrical / plumbing capex.
Questions for the listing agent
- Can we see the unit-by-unit rent roll, current vacancy, and any below-market leases? What's the average tenancy length?
- What capital expenditures (roof, boiler, parking lot, exteriors) have been made in the last 5 years, and what's planned in the next 2?
- Built in 1905 — when were the roof, HVAC, electrical panel, plumbing, and water heater last replaced?
- Is there a deadline driving the sale (1031 exchange, divorce, estate, relocation)? That informs how much negotiation room exists.
- Schools are B-rated — typically a magnet for longer-tenancy family renters. What's the average tenant stay here, and is there a school-zone premium baked into asking?
- What's the average days-on-market for RENTAL listings here right now (not sales)? A rising rental-DOM trend means longer vacancies and softer asking-rent achievability than the comps imply.
- What's the recent tenant-quality profile in this submarket — average credit score on applications, eviction rate, late-payment / NSF rate, and stable-employment percentage? A property-management company in the area should have these aggregated.
- How much new apartment / multifamily construction is in the pipeline within 1–3 miles? Heavy new supply (>2% of stock underway) typically softens rents 12–24 months out; light construction supports rent growth.
Investment metrics
- 1% rule
- 1.24% ✓
- Cap rate
- 10.06%
- Cash-on-cash
- 13.44%
- DSCR
- 1.60
- GRM
- 6.7
CMA / ARV
- ARV (on-the-fly)
- $309,757
- Comps found
- 6
Show comp detail 6 sales within ~0.75 mi
| Address | Dist | Beds/Ba | Sqft | Sold | Price | $/sf | Match |
|---|---|---|---|---|---|---|---|
| 1319 E 6th St | 0.21mi | 4/3.0 (-1) | 2,782 (+7%) | 1mo | $360,000 | $129 | 73 |
| 1612 E 6th St | 0.14mi | 4/4.0 (-1) | 2,412 (-7%) | 1mo | $240,000 | $100 | 71 |
| 1319 E 3rd St | 0.17mi | 4/4.0 (-1) | 2,551 (-2%) | 18mo | $388,000 | $152 | 65 |
| 705 E 6th St | 0.73mi | 4/3.0 (-1) | 2,464 (-5%) | 9mo | $195,250 | $79 | 44 |
| 1513 Jefferson St | 0.33mi | 6/2.0 (+1) | 2,821 (+8%) | 22mo | $326,000 | $116 | 43 |
| 822-824 E 4th St | 0.59mi | 6/4.0 (+1) | 2,771 (+6%) | 22mo | $330,000 | $119 | 34 |
Match score weights: distance 35% · size 25% · config 20% · recency 20%. Top-matched comps best support the ARV.
Projected returns pro-forma
-3.0% appreciation · 8.0% rent growth · sell at horizon
- IRR
- 8.9%
- Equity multiple
- 1.37×
- Total profit
- $37,223
- Equity at exit
- $53,662
- IRR
- 21.9%
- Equity multiple
- 3.31×
- Total profit
- $232,638
- Equity at exit
- $31,118
Cash invested: $100,772 (down + closing). Projections, not guarantees.
Landlord ↔ Tenant lean methodology
- Overall (STATE)
- 46 Balanced
- State Minnesota
- 46 Balanced · D+2
- County
- — inherits STATE
- City
- — inherits STATE
ZIP-level market 55812
- Rents YoY
- 8.1%
- Active inventory
- 50
- Price-to-rent
- 20.1×
Monthly cashflow live
- Estimated rent
- $4,473 high interval (Pro) →
- Mortgage (P&I)
- −$1,887
- Tax from tax record
- −$368 /mo · $4,412/yr
- Insurance
- −$150
- HOA
- −$0
- Vacancy / Maint / Mgmt
- −$939
- Net cashflow
- $1,129
Break-even live
Sensitivity live
| Price | -10% $1,332 | -5% $1,231 | +0% $1,129 | +5% $1,027 | +10% $925 |
|---|---|---|---|---|---|
| Rent | -10% $775 | -5% $952 | +0% $1,129 | +5% $1,305 | +10% $1,482 |
| Rate | -1.0pp $1,310 | -0.5pp $1,220 | base $1,129 | +0.5pp $1,035 | +1.0pp $941 |
3-unit breakdown (identical units grouped — click to expand)
| Units | Beds | Baths | Est. rent |
|---|---|---|---|
| 3× units | 2 | 1 | $4,473 |
| #1 | 2 | 1 | $1,491 |
| #2 | 2 | 1 | $1,491 |
| #3 | 2 | 1 | $1,491 |
| Total (3 units) | $4,473 | ||
UW: 25.0% down · 7.5% · 30yr · 1.5% tax · 5.0% vac · 8.0% maint · 8.0% mgmt
Financing live
Cash to close
- Down payment
- $89,975
- Closing costs
- $10,797
- Reserves months
- —
- Total cash needed
- —
Loan-product check · same deal, 3 products live
Conventional
25% down · 7.5% · 30yr
- Down + closing
- —
- Monthly P&I
- —
- Monthly cashflow
- —
- DSCR
- —
- Eligible?
- —
Personal DTI + credit; lowest rate.
DSCR
20% down · 8.5% · 30yr
- Down + closing
- —
- Monthly P&I
- —
- Monthly cashflow
- —
- DSCR
- —
- Eligible?
- —
No personal income docs; deal must DSCR.
Hard money
10% down · 12.0% · 12mo
- Down + closing
- —
- Monthly P&I
- —
- Monthly cashflow
- —
- DSCR
- —
- Eligible?
- —
Short-term bridge; refi at stabilization.
Rent comps 4 comps
| Address | Beds | Baths | Sqft | Rent | $/sqft | DOM | Units | Dist |
|---|---|---|---|---|---|---|---|---|
| 414 N 19th Ave E Duluth, MN | 4.0 | 1.0 | 1900 | $2,295 | $1.21 | 13d | 1 | 0.36mi |
| 202 S 18th Ave E Duluth, MN | 5.0 | 2.5 | 2372 | $2,495 | $1.05 | 13d | 1 | 0.48mi |
| 2114 E 4th St Duluth, MN | 6.0 | 2.0 | 2326 | $3,050 | $1.31 | 21d | 1 | 0.56mi |
| 609 E 6th St Duluth, MN | 5.0 | 2.0 | 1850 | $1,795 | $0.97 | 21d | 1 | 0.78mi |
Listing history 10 events
-
2026-06-19days on market $359,900 Active 11 DOM
-
2026-06-18days on market $359,900 Active 10 DOM
-
2026-06-17days on market $359,900 Active 9 DOM
-
2026-06-16days on market $359,900 Active 8 DOM
-
2026-06-15days on market $359,900 Active 7 DOM
-
2026-06-14days on market $359,900 Active 5 DOM
-
2026-06-13days on market $359,900 Active 4 DOM
-
2026-06-10days on market $359,900 Active 2 DOM
-
2026-06-09remarks 699-char remark
-
2026-06-09$359,900 Active 1 DOM
ⓘ Source: listings_history table (triggers on properties + properties_extension) + one-shot
backfill from property_details.listing_events for pre-trigger history.
Tax reassessment forecast MN · Partial reset (capped growth)
- Current annual tax
- $4,412 · $368/mo
- Projected year-2 tax
- $4,412 · $368/mo
- Expected delta
- $0/yr ($0/mo · 0.0%)
ⓘ Screening estimate from a state-policy table — verify with the county assessor before closing.
Climate risk First Street
- Flood 1/10 Low FEMA zone X · 0% chance over 30 yrs
- Wildfire 1/10 Low
- Heat 1/10 Low 7 d/yr ≥90°F today · 12 d/yr by 30 yrs out
- Wind 1/10 Low
- Air quality 2/10 Low 0 unhealthy d/yr today · 1 by 30 yrs out
Nearby sold comps map
Loading sold comps map…
Walkable amenities ~0.75 mi
Loading nearby amenities…
Taxation est. · year 1
- Rental income
- $53,676
- − Mortgage interest
- −$20,160
- − Property taxes
- −$4,412
- − Insurance
- −$1,800
- − Repairs & maintenance
- −$4,294
- − Management
- −$4,294
- − Depreciation
- −$10,470
- Taxable income
- $8,247
- Est. tax owed @ 24.0%
- −$1,979
- After-tax cash flow
- $11,565/yr
For passive investors: Depreciation is non-cash, so a rental often shows a tax loss while cash-flowing — sheltering income. Rental losses are passive: they offset passive income freely, and up to $25,000/yr can offset ordinary (W-2) income if you actively participate and your MAGI is under $100k (phasing out to $0 by $150k); unused losses carry forward. On sale, claimed depreciation is recaptured at up to 25%, and gains may owe capital-gains tax (a 1031 exchange can defer both). Figures are a year-1 estimate at your 24.0% rate — not tax advice; consult a CPA.
Schools (NCES district)
- District
- Duluth Public School District
- NCES district ID
- 2711040
- Math proficiency
- 44% ▼ -10.00%
- Reading proficiency
- 55% ▼ -6.00%
- Median HH income
- $45,692
- Composite
- 41.92/100
- National rank
- #3360
- State rank
- #132 of 301 in MN
Livability — Duluth
- Score
- 82/100
- State rank
- #36
- US rank
- #1060
Category grades
Schools grade is shown separately in the Schools card above.
Census & demographics
- Census place
- Duluth, MN
- County
- Saint Louis County · 115,152 people
- City population
- 71,097
- Metro
- Duluth, MN-WI
- Population (ZIP)
- 10,859
- Household income
- $65,505
- Rent vs Own
- Severe rent burden
- 655.0
Population outlook (St. Louis County) Hauer SSP2
- Today (2025)
- 202,411 people
- By 2030
- 203,234 · +0.4%
- By 2040
- 202,520 · +0.1%
- By 2050
- 200,853 · -0.8%
- By 2075
- 200,943 · -0.7%
- By 2100
- 192,058 · -5.1%
Race, ethnicity, and origin ACS 2023
- Neighborhood character
- Predominantly White (83%)
- Race & ethnicity
- White 83% Two or more races 5% Hispanic / Latino 4% Black 4% Asian 3% Native American 1%
- Common ancestry
- Portuguese 12% Romanian 6% Scottish 2%
- Foreign-born
- 4% · Canada, South Korea, China
- Languages at home
- 93% English-only · Spanish 3% Other Indo-European 1%
Political lean MEDSL · St. Louis
- 2024 margin
- D (+13.7) · D 55.9% · R 42.2% · Other 1.8%
- 2008→2024 swing
- -18.8pp toward R · 2008: 32.5pp · 2024: 13.7pp
- All cycles
- 2024: D+13.7 2020: D+15.6 2016: D+11.8 2012: D+29.6 2008: D+32.5
Not yet ingested
- Civics
- —
Market trends
- HPI YoY
- ▼ -277.88%
- Current HPI
- 196.8354
- Rent YoY
- ▲ 8.07%
- Metro
- Duluth, MN-WI
- State GDP YoY
- ▲ 2.41%
- F500 in state
- 34
Industry mix (Fortune 500 HQ in MN)
| Industry | F500 HQs | Revenue |
|---|---|---|
| Healthcare | 2 | $407B |
|
||
| Retail | 2 | $150B |
|
||
| Consumer Goods | 2 | $32B |
|
||
| Industrial Machinery | 2 | $6B |
|
||
| Agriculture | 1 | $40B |
|
||
| Healthcare / Medical Devices | 1 | $32B |
|
||
Price history
+306.7% since first listed23 events — show timeline
- 2026-06-08 Listed $359,900 LSAR
- 2025-08-07 Listing Removed — NORTHSTARMLS as Distributed by MLS Grid
- 2025-06-09 Listed $369,900 NORTHSTARMLS as Distributed by MLS Grid
- 2025-06-09 Listed — LSAR
- 2023-09-30 Listing Removed — NORTHSTARMLS as Distributed by MLS Grid
- 2023-06-27 Listed $379,900 NORTHSTARMLS as Distributed by MLS Grid
- 2023-01-25 Sold (Public Records) $321,500 Public Records
- 2022-11-04 Sold (MLS) $321,500 LSAR
- 2022-08-29 Listed $299,900 LSAR
- 2014-09-29 Sold (Public Records) $178,000 Public Records
- 2014-09-22 Sold (MLS) $178,000 LSAR
- 2014-09-22 Sold (MLS) $178,000 RASM
- 2014-09-22 Sold (MLS) $178,000 NORTHSTARMLS as Distributed by MLS Grid
- 2014-03-31 Contingent — NORTHSTARMLS as Distributed by MLS Grid
- 2014-03-31 Price Changed $185,000 NORTHSTARMLS as Distributed by MLS Grid
- 2014-02-26 Listed $194,900 NORTHSTARMLS as Distributed by MLS Grid
- 2014-02-25 Listed $185,000 LSAR
- 2014-02-25 Listed $185,000 RASM
- 2013-10-10 Listed $199,900 NORTHSTARMLS as Distributed by MLS Grid
- 2003-09-04 Sold (Public Records) $157,500 Public Records
- 2002-05-23 Sold (Public Records) $140,000 Public Records
- 2000-10-13 Sold (Public Records) $120,000 Public Records
- 1999-07-26 Sold (Public Records) $88,500 Public Records
Property tax history
+2.6%/yrLatest (2025): $4,412 · +40.1% YoY. Source: county tax records.
Cash-flow waterfall
monthlySold comps — $/sqft
last 12 mo · ≤1 miLoading sold comps…