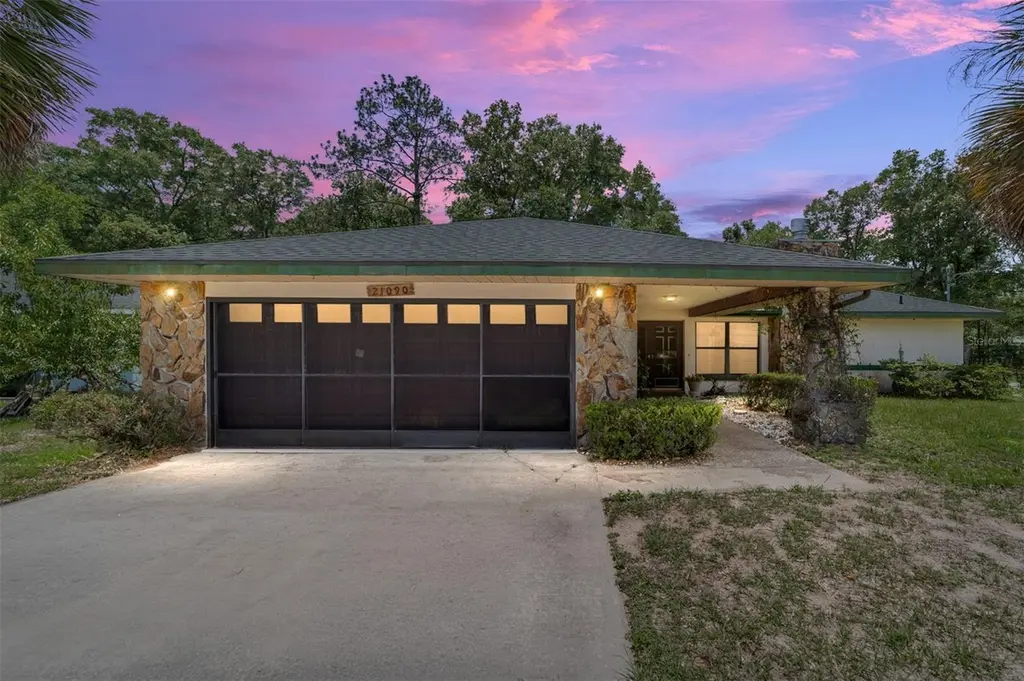
21090 SW Peach Blossom St · Rainbow Lakes Estates, FL
Flood risk 1/10 · Minimal
- FEMA flood zone
- X (unshaded)
- Chance of flooding over 30 yrs
- 0.0%
- Est. flood insurance / yr
- $507 – $1,088
Fire risk 5/10 · Moderate
- Est. fire insurance / yr
- $947 – $1,759
Heat risk 8/10 · Major
- Hot days now (above 106°F)
- 4 days/yr
- Hot days in 30 yrs
- 12 days/yr
Wind risk 9/10 · Severe
- Chance of severe wind over 30 yrs
- 99.0%
Air-quality risk 2/10 · Minimal
- Unhealthy air days now
- 0 days/yr
- Unhealthy air days in 30 yrs
- 1 days/yr
Risk factors via First Street. Map © Google.
Why this score? — see what drove the D+ grade
The composite is a weighted blend of 9 inputs, each scored 0–100. Each bar is that input's sub-score; the figure is the points it added to the 100-point composite (weight × sub-score).
- Cash flow +15.5/30.0
- ARV discount +15.0/15.0
- DSCR +4.8/10.0
- Schools +3.6/10.0
- 1% rule +3.4/10.0
- Rent growth +2.5/5.0
- Livability +2.5/5.0
- Condition / age +2.5/5.0
- Appreciation +0.0/10.0
$210,000
🖨 Deal sheet (PDF) 📄 Offer letter ✓ Due diligence
Listing remarks MLS
GREAT RETIREMENT HOME LOCATED JUST NORTH OF DUNNELLON, FLORIDA. 3 BEDROOMS, 2 BATHS FEATURING NEW LAMINATE FLOORING, WOOD BURNING FIREPLACE, 2 CAR GARAGE, 2 SHEDS, NICE LANDSCAPING AND MUCH MORE! COMMUNITY HAS NUMEROUS CLUBS, PARKS AND IS CLOSE TO SHOPPING IN DUNNELLON. ENJOY EVERYTHING FLORIDA'S NATURE COAST HAS TO OFFER INCLUDING GREAT FISHING, CHAMPIONSHIP GOLF COURSES, HUNTING, HORSEBACK RIDING AND OUR BEAUTIFUL SPRINGS JUST MINUTES AWAY.
Key facts
- Peaceful community
- 0.28 acre lot
- 2 garage spots
Tags
Property features AI
Finance
- Other: Homestead exempt; Public-record living area approx. 1,472; Additional building area listed (2,521); Water access: River
- HOA & community: No association; Pets allowed
Exterior
- Parking: Attached garage (2 spaces)
- Utilities: Public water; Septic tank; Utilities connected
- Home design: Single-family residence; One story; Faces south; Residential zoning (R1)
- Construction: Block construction; Shingle roof; Slab foundation; Built on a 0.28-acre lot (approx. 75 x 161)
- Exterior features: Private mailbox; Storage
Interior
- Kitchen: Dishwasher; Range; Microwave; Refrigerator
- Bedrooms: 3 bedrooms
- Flooring: Carpet; Tile
- Bathrooms: 2 full bathrooms
- Heating & cooling: Central heating; Central air conditioning
- Interior features: Ceiling fans; High ceilings; Split bedroom floor plan; Walk-in closet(s); Wood-burning fireplace
- Laundry & utility: Laundry room; Washer; Dryer
Neighborhood map
What this means for you Summary
Snapshot
- This is a 3-bed/2.0-bath single-family listed at $210k.
Deal economics
- At list price, monthly cash flow is $85 ($1k/yr) — positive.
- The deal already cash-flows at list — no discount required.
- To meet the 1% rule (rent ≥ 1% of price), the offer needs to be $176k (16.2% below list).
- Recommended offer: $176k (16.2% below list) — sets the bar for 1% rule.
- Cap rate 6.8% vs local median 4.5% in Rainbow Lakes Estates — top-decile yield for the area; either an underpriced asset or a hidden risk that comps aren't pricing in. Stress-test before assuming the spread holds.
Location & tenants
- Location reads: area grade D — affects rentability + tenant quality, not the cash-flow math above.
- Marion (rural): math 42% / reading 43% proficiency, ranked #61 of 73 in FL (top 84%) — families likely to look elsewhere, expect single-tenant / working-renter base with shorter leases; 61% free/reduced lunch — lower-income household profile, screen leases tightly.
- Zoned schools: Dunnellon Elementary School (math 46% / reading 48%, grade D-, #1,191 of 2,144 statewide, top 57%, 580 students, 61% FRL); Dunnellon Middle School (math 48% / reading 42%, grade D, #310 of 571 statewide, top 56%, 678 students, 68% FRL); Dunnellon High School (math 30% / reading 32%, grade F, #429 of 667 statewide, top 65%, 1,350 students, 63% FRL) — zoned schools at 64% FRL track the district average.
- Market conditions: 557 active listings in the ZIP; 4 comparable units currently listed for rent nearby; rentals at typical pace (median 15d on market — plan ~3-4 weeks tenant-placement turnaround); 7,071 units permitted in Marion County in 2024 (534 in 5+ unit buildings).
- This rent runs 37% of the median local income ($57k/yr) — at the standard rent-burdened threshold; future hikes will face affordability resistance.
Forward outlook
- Local home prices are declining (-3.0%/yr); year-one equity from $1k of loan paydown is wiped out by about $6k of value loss. Plan a longer hold.
- Marion County population projected at +13% by 2050 — modest demand growth; plan on rents tracking national, not racing it.
Negotiation context
- It's been on market 25 days — a 2% lower offer ($207k) is reasonable based on typical stale-listing flexibility.
- 2 sale attempts since 14y ago with the ask held roughly flat each time — persistent listings suggest the price (not the market) is what's stuck; bring a comps-based counter.
- Current owner paid $76k; list at $210k implies a 176% gain — meaningful room to come down on a strong offer.
Risks & watch-outs
- Climate carrying-cost: severe wind risk, 99% chance of damaging wind over 30y; moderate wildfire risk; extreme-heat days projected 4→12/yr by 2055 (HVAC capex compounding) — expect insurance premiums to compound above CPI over the hold.
Questions for the listing agent
- Is there a deadline driving the sale (1031 exchange, divorce, estate, relocation)? That informs how much negotiation room exists.
- The area grade is low — what's the realistic commute time and amenity access for the typical tenant pool here? Any planned neighborhood developments (good or bad) we should know about?
- What's the average days-on-market for RENTAL listings here right now (not sales)? A rising rental-DOM trend means longer vacancies and softer asking-rent achievability than the comps imply.
- What's the recent tenant-quality profile in this submarket — average credit score on applications, eviction rate, late-payment / NSF rate, and stable-employment percentage? A property-management company in the area should have these aggregated.
- How much new for-sale + rental construction is in the pipeline within 1–3 miles? Heavy new supply typically softens prices + rents 12–24 months out; constrained supply supports both.
Investment metrics
- 1% rule
- 0.84% ✗
- Cap rate
- 6.78%
- Cash-on-cash
- 1.74%
- DSCR
- 1.08
- GRM
- 9.9
CMA / ARV
- ARV (on-the-fly)
- $270,848
- Comps found
- 9
Show comp detail 9 sales within ~0.75 mi
| Address | Dist | Beds/Ba | Sqft | Sold | Price | $/sf | Match |
|---|---|---|---|---|---|---|---|
| 21110 SW Plantation St | 0.19mi | 3/2.0 | 1,470 (-0%) | 4mo | $199,000 | $135 | 88 |
| 21428 SW Raintree St | 0.34mi | 3/2.0 | 1,461 (-1%) | 9mo | $199,000 | $136 | 76 |
| 21474 SW Peach Blossom St | 0.39mi | 3/2.0 | 1,411 (-4%) | 2mo | $275,000 | $195 | 73 |
| 4152 SW Begonia Ct | 0.31mi | 3/2.0 | 1,600 (+9%) | 4mo | $315,000 | $197 | 67 |
| 21641 SW Marine Blvd | 0.55mi | 3/2.0 | 1,576 (+7%) | 7mo | $259,900 | $165 | 57 |
| 20751 SW Cardinal Ave | 0.63mi | 3/2.0 | 1,508 (+2%) | 13mo | $295,000 | $196 | 56 |
| 20723 SW Audubon Ave | 0.66mi | 3/2.0 | 1,407 (-4%) | 10mo | $279,900 | $199 | 54 |
| 20652 SW Cardinal Ave | 0.60mi | 4/2.0 (+1) | 1,683 (+14%) | 13mo | $289,900 | $172 | 32 |
| 20653 SW Audubon Ave | 0.71mi | 4/2.0 (+1) | 1,683 (+14%) | 15mo | $310,000 | $184 | 25 |
Match score weights: distance 35% · size 25% · config 20% · recency 20%. Top-matched comps best support the ARV.
Projected returns pro-forma
-3.0% appreciation · 3.0% rent growth · sell at horizon
- IRR
- -13.6%
- Equity multiple
- 0.51×
- Total profit
- $-28,657
- Equity at exit
- $31,312
- IRR
- -4.7%
- Equity multiple
- 0.69×
- Total profit
- $-18,213
- Equity at exit
- $18,157
Cash invested: $58,800 (down + closing). Projections, not guarantees.
Landlord ↔ Tenant lean methodology
- Overall (STATE)
- 87 Strongly Landlord-Friendly
- State Florida
- 87 Strongly Landlord-Friendly · R+3
- County
- — inherits STATE
- City
- — inherits STATE
ZIP-level market 34431
- Home prices YoY
- -3.2%
- Active inventory
- 557
- Price-to-rent
- 9.9×
Monthly cashflow live
- Estimated rent
- $1,759 medium interval (Pro) →
- Mortgage (P&I)
- −$1,101
- Tax from tax record
- −$116 /mo · $1,388/yr
- Insurance
- −$88
- HOA
- −$0
- Vacancy / Maint / Mgmt
- −$369
- Net cashflow
- $85
Break-even live
Sensitivity live
| Price | -10% $204 | -5% $145 | +0% $85 | +5% $26 | +10% $-34 |
|---|---|---|---|---|---|
| Rent | -10% $-54 | -5% $16 | +0% $85 | +5% $155 | +10% $224 |
| Rate | -1.0pp $191 | -0.5pp $139 | base $85 | +0.5pp $31 | +1.0pp $-24 |
UW: 25.0% down · 7.5% · 30yr · 1.5% tax · 5.0% vac · 8.0% maint · 8.0% mgmt
Financing live
Cash to close
- Down payment
- $52,500
- Closing costs
- $6,300
- Reserves months
- —
- Total cash needed
- —
Loan-product check · same deal, 3 products live
Conventional
25% down · 7.5% · 30yr
- Down + closing
- —
- Monthly P&I
- —
- Monthly cashflow
- —
- DSCR
- —
- Eligible?
- —
Personal DTI + credit; lowest rate.
DSCR
20% down · 8.5% · 30yr
- Down + closing
- —
- Monthly P&I
- —
- Monthly cashflow
- —
- DSCR
- —
- Eligible?
- —
No personal income docs; deal must DSCR.
Hard money
10% down · 12.0% · 12mo
- Down + closing
- —
- Monthly P&I
- —
- Monthly cashflow
- —
- DSCR
- —
- Eligible?
- —
Short-term bridge; refi at stabilization.
Rent comps 4 comps
| Address | Beds | Baths | Sqft | Rent | $/sqft | DOM | Units | Dist |
|---|---|---|---|---|---|---|---|---|
| 21425 SW Plantation St Dunnellon, FL | 3.0 | 2.0 | 1456 | $1,800 | $1.24 | 15d | 1 | 0.40mi |
| 21423 SW Beach Blvd Dunnellon, FL | 3.0 | 2.0 | 1066 | $1,400 | $1.31 | 15d | 1 | 0.40mi |
| 20024 SW Beach Blvd Dunnellon, FL | 3.0 | 2.0 | 1232 | $1,899 | $1.54 | 23d | 1 | 1.11mi |
| 22222 SW Marine Blvd Dunnellon, FL | 3.0 | 2.0 | 1473 | $1,799 | $1.22 | 15d | 1 | 1.14mi |
Listing history 20 events
-
2026-06-21days on market $210,000 Active 25 DOM
-
2026-06-18days on market $210,000 Active 22 DOM
-
2026-06-17days on market $210,000 Active 21 DOM
-
2026-06-16days on market $210,000 Active 20 DOM
-
2026-06-15days on market $210,000 Active 19 DOM
-
2026-06-14days on market $210,000 Active 17 DOM
-
2026-06-13days on market $210,000 Active 16 DOM
-
2026-06-10days on market $210,000 Active 14 DOM
-
2026-06-09days on market $210,000 Active 13 DOM
-
2026-06-08days on market $210,000 Active 12 DOM
-
2026-06-07days on market $210,000 Active 11 DOM
-
2026-06-03days on market $210,000 Active 7 DOM
-
2026-06-02days on market $210,000 Active 6 DOM
-
2026-06-01days on market $210,000 Active 5 DOM
-
2026-05-31days on market $210,000 Active 4 DOM
-
2026-05-30days on market $210,000 Active 3 DOM
-
2026-05-27$210,000 Active
-
2013-06-26soldstatus $76,000 446-char remark
Show marketing remark (446 chars)
GREAT RETIREMENT HOME LOCATED JUST NORTH OF DUNNELLON, FLORIDA. 3 BEDROOMS, 2 BATHS FEATURING NEW LAMINATE FLOORING, WOOD BURNING FIREPLACE, 2 CAR GARAGE, 2 SHEDS, NICE LANDSCAPING AND MUCH MORE! COMMUNITY HAS NUMEROUS CLUBS, PARKS AND IS CLOSE TO SHOPPING IN DUNNELLON. ENJOY EVERYTHING FLORIDA'S NATURE COAST HAS TO OFFER INCLUDING GREAT FISHING, CHAMPIONSHIP GOLF COURSES, HUNTING, HORSEBACK RIDING AND OUR BEAUTIFUL SPRINGS JUST MINUTES AWAY.
-
2012-11-20$79,900 446-char remark
Show marketing remark (446 chars)
GREAT RETIREMENT HOME LOCATED JUST NORTH OF DUNNELLON, FLORIDA. 3 BEDROOMS, 2 BATHS FEATURING NEW LAMINATE FLOORING, WOOD BURNING FIREPLACE, 2 CAR GARAGE, 2 SHEDS, NICE LANDSCAPING AND MUCH MORE! COMMUNITY HAS NUMEROUS CLUBS, PARKS AND IS CLOSE TO SHOPPING IN DUNNELLON. ENJOY EVERYTHING FLORIDA'S NATURE COAST HAS TO OFFER INCLUDING GREAT FISHING, CHAMPIONSHIP GOLF COURSES, HUNTING, HORSEBACK RIDING AND OUR BEAUTIFUL SPRINGS JUST MINUTES AWAY.
-
1994-06-15soldstatus $70,000
ⓘ Source: listings_history table (triggers on properties + properties_extension) + one-shot
backfill from property_details.listing_events for pre-trigger history.
Tax reassessment forecast FL · Resets to sale price
- Current annual tax
- $1,388 · $116/mo
- Projected year-2 tax
- $1,743 · $145/mo
- Expected delta
- +$355/yr (+$30/mo · 25.6%)
ⓘ Screening estimate from a state-policy table — verify with the county assessor before closing.
Climate risk First Street
- Flood 1/10 Low FEMA zone X (unshaded) · 0% chance over 30 yrs
- Wildfire 5/10 Major
- Heat 8/10 Severe 4 d/yr ≥106°F today · 12 d/yr by 30 yrs out
- Wind 9/10 Extreme 99% chance of damaging wind over 30 yrs
- Air quality 2/10 Low 0 unhealthy d/yr today · 1 by 30 yrs out
Nearby sold comps map
Loading sold comps map…
Walkable amenities ~0.75 mi
Loading nearby amenities…
Taxation est. · year 1
- Rental income
- $21,111
- − Mortgage interest
- −$11,763
- − Property taxes
- −$1,388
- − Insurance
- −$1,050
- − Repairs & maintenance
- −$1,689
- − Management
- −$1,689
- − Depreciation
- −$6,109
- Taxable loss
- −$2,577
- Est. tax savings @ 24.0%
- +$619
- After-tax cash flow
- $1,643/yr
For passive investors: Depreciation is non-cash, so a rental often shows a tax loss while cash-flowing — sheltering income. Rental losses are passive: they offset passive income freely, and up to $25,000/yr can offset ordinary (W-2) income if you actively participate and your MAGI is under $100k (phasing out to $0 by $150k); unused losses carry forward. On sale, claimed depreciation is recaptured at up to 25%, and gains may owe capital-gains tax (a 1031 exchange can defer both). Figures are a year-1 estimate at your 24.0% rate — not tax advice; consult a CPA.
Schools (NCES district)
- District
- Marion
- NCES district ID
- 1201260
- Math proficiency
- 42% ▼ -7.00%
- Reading proficiency
- 43% ▼ -4.00%
- Median HH income
- $40,015
- Composite
- 35.61/100
- National rank
- #4890
- State rank
- #61 of 73 in FL
Livability — Rainbow Lakes Estates
No livability data for this city. (Only ~50 U.S. cities are tracked.)
Census & demographics
- Census place
- Rainbow Lakes Estates, FL
- County
- Marion County · 315,796 people
- Metro
- Ocala, FL
- Population (ZIP)
- 9,785
- Household income
- $56,534
- Rent vs Own
- Severe rent burden
- 72.0
Population outlook (Marion County) Hauer SSP2
- Today (2025)
- 365,905 people
- By 2030
- 376,768 · +3.0%
- By 2040
- 396,555 · +8.4%
- By 2050
- 412,723 · +12.8%
- By 2075
- 446,090 · +21.9%
- By 2100
- 436,193 · +19.2%
Race, ethnicity, and origin ACS 2023
- Neighborhood character
- Predominantly White (87%)
- Race & ethnicity
- White 87% Hispanic / Latino 7% Two or more races 5% Black 3% Asian 1%
- Hispanic origin (detail)
- Mexican 2% Puerto Rican 4% Cuban 1%
- Common ancestry
- Lithuanian 4% Slovak 3% Portuguese 2%
- Foreign-born
- 4% · Canada, Vietnam
- Languages at home
- 96% English-only · Spanish 2% German/W. Germanic 1% Vietnamese 1%
Political lean MEDSL · Marion
- 2024 margin
- Solid R (+31.6) · D 33.8% · R 65.5%
- 2008→2024 swing
- -20.0pp toward R · 2008: -11.6pp · 2024: -31.6pp
- All cycles
- 2024: R+31.6 2020: R+25.9 2016: R+26.2 2012: R+16.2 2008: R+11.6
Not yet ingested
- Civics
- —
Market trends
- HPI YoY
- ▼ -11.42%
- Current HPI
- 343.1464
- Rent YoY
- —
- Metro
- Ocala, FL
- State GDP YoY
- ▲ 3.28%
- F500 in state
- 36
Industry mix (Fortune 500 HQ in FL)
| Industry | F500 HQs | Revenue |
|---|---|---|
| Industrial Technology | 2 | $29B |
|
||
| Insurance | 2 | $17B |
|
||
| Retail | 1 | $60B |
|
||
| Technology Distribution | 1 | $58B |
|
||
| Homebuilding | 1 | $35B |
|
||
| Technology Manufacturing | 1 | $35B |
|
||
Price history
+200.0% since first listed4 events — show timeline
- 2026-05-27 Listed $210,000 Stellar MLS as Distributed by MLS Grid
- 2013-06-26 Sold (MLS) $76,000 Stellar MLS as Distributed by MLS Grid
- 2012-11-20 Listed $79,900 Stellar MLS as Distributed by MLS Grid
- 1994-06-15 Sold (Public Records) $70,000 Public Records
Property tax history
+5.5%/yrLatest (2025): $1,388 · -38.1% YoY. Source: county tax records.
Cash-flow waterfall
monthlySold comps — $/sqft
last 12 mo · ≤1 miLoading sold comps…