 5-Plex
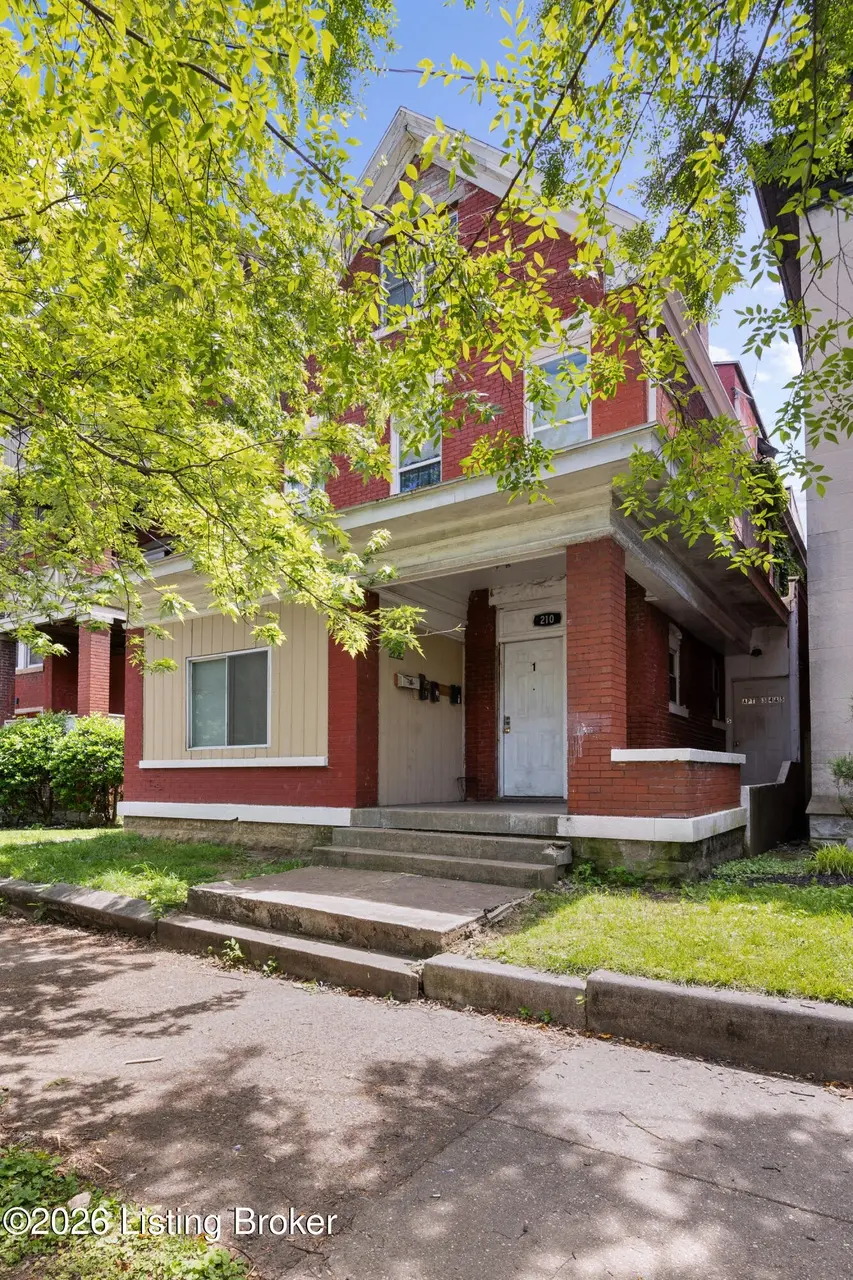
210 E Ormsby Ave · Louisville, KY
Flood risk 1/10 · Minimal
- FEMA flood zone
- X (unshaded)
- Chance of flooding over 30 yrs
- 0.0%
- Est. flood insurance / yr
- $473 – $860
Fire risk 1/10 · Minimal
- Est. fire insurance / yr
- $839 – $1,559
Heat risk 5/10 · Moderate
- Hot days now (above 105°F)
- 7 days/yr
- Hot days in 30 yrs
- 19 days/yr
Wind risk 2/10 · Minimal
- Chance of severe wind over 30 yrs
- 1.0%
Air-quality risk 2/10 · Minimal
- Unhealthy air days now
- 1 days/yr
- Unhealthy air days in 30 yrs
- 3 days/yr
Risk factors via First Street. Map © Google.
Why this score? — see what drove the B- grade
The composite is a weighted blend of 9 inputs, each scored 0–100. Each bar is that input's sub-score; the figure is the points it added to the 100-point composite (weight × sub-score).
- Cash flow +30.0/30.0
- 1% rule +10.0/10.0
- DSCR +10.0/10.0
- ARV discount +8.5/15.0
- Rent growth +3.4/5.0
- Livability +3.2/5.0
- Condition / age +2.5/5.0
- Schools +2.3/10.0
- Appreciation +0.0/10.0
$379,000
🖨 Deal sheet 📄 Offer letter ✓ Due diligence
Multi-family units
County records classify this as Multi-Family (5+ Unit). Listing-text estimate: 5 units. confirmed
5+ unit building — per-unit beds/baths from public records are typically unavailable; the breakdown below (if shown) is an estimate from the listing text.
Listing remarks
Investor opportunity in Old Louisville! This 5-unit multi-family property offers strong income potential with plenty of room to increase rental revenue. Situated in a prime historic neighborhood, this five-plex features spacious units and classic architectural details, making it appealing to both tenants and future buyers. Whether you're looking to expand your portfolio or start investing, don't miss your chance to own a versatile property with upside in one of Louisville's most sought-after rental markets. Schedule your showing today—opportunities like this don't last long!
Key facts
- Versatile property
- Spacious units
- 7,344 sq ft lot
Tags
Property features AI
Finance
- HOA & community: No association fee
Exterior
- Parking: No covered parking
- Utilities: Electricity connected; Natural gas available
- Home design: Located in the Old Louisville subdivision; Facing direction not specified; Entry level not specified; Approximate building area 3,731 total square feet
- Construction: Built in 1900; Brick construction; Shingle roof; Living area approximately 3,731
- Exterior features: No exterior features listed
Interior
- Bedrooms: No bedrooms listed
- Heating & cooling: Natural gas heating; Wall or window cooling units
- Interior features: Traditional architectural style; Basement present; Apartment property type
Neighborhood map
What this means for you Summary
Snapshot
- This is a 5 × 3-bed/1-bath units multifamily listed at $379k.
Deal economics
- At list price, monthly cash flow is $2k ($29k/yr) — positive. Per door: $489/mo.
- The deal already cash-flows at list — no discount required.
- Meets the 1% rule at list price ($6k rent vs $379k).
- Recommended offer: $373k (1.5% below list) — sets the bar for market timing.
- Cap rate 14.0% vs local median 5.0% in Louisville — top-decile yield for the area; either an underpriced asset or a hidden risk that comps aren't pricing in. Stress-test before assuming the spread holds.
Location & tenants
- Location reads 63/100 on livability (#333 in KY) — a middle-class / working-renter tenant base. Strengths: cost of living A+, housing A+; Watch: employment C-, health & safety D+, schools D-.
- Jefferson County (urban): math 19% / reading 35% proficiency, ranked #121 of 165 in KY (top 73%) — low school quality limits family demand, transient renter base, plan for 1-2y turnover.
- Market conditions: Rents rising (+3.7%/yr); 114 active listings in the ZIP; 4 comparable units currently listed for rent nearby; rentals at typical pace (median 24d on market — plan ~3-4 weeks tenant-placement turnaround); lower-income renter base — watch delinquency; 2,836 units permitted in Jefferson County in 2024 (1,558 in 5+ unit buildings).
- At $6,141/mo this rent would consume 239% of the median local household income ($31k/yr) (locally 1603% of renters already pay >50% of income on rent) — very limited rent-growth headroom before tenants either downsize or default.
Forward outlook
- Local home prices are declining (-3.0%/yr); year-one equity from $3k of loan paydown is wiped out by about $11k of value loss. Plan a longer hold.
- Jefferson County population projected at +13% by 2050 — modest demand growth; plan on rents tracking national, not racing it.
- At projected returns (-3.0% appreciation + 3.7% rent growth), your $106k cash investment doubles in ~5 years — after that, you're playing with house money.
Negotiation context
- It's been on market 27 days — a 2% lower offer ($373k) is reasonable based on typical stale-listing flexibility.
- 2 sale attempts with the ask held roughly flat each time — persistent listings suggest the price (not the market) is what's stuck; bring a comps-based counter.
- Current owner paid $100k; list at $379k implies a 279% gain — meaningful room to come down on a strong offer.
Risks & watch-outs
- Watch-outs: built in 1900 — expect roof / HVAC / electrical / plumbing capex.
- Climate carrying-cost: extreme-heat days projected 7→19/yr by 2055 (HVAC capex compounding) — expect insurance premiums to compound above CPI over the hold.
Questions for the listing agent
- Can we see the unit-by-unit rent roll, current vacancy, and any below-market leases? What's the average tenancy length?
- What capital expenditures (roof, boiler, parking lot, exteriors) have been made in the last 5 years, and what's planned in the next 2?
- Built in 1900 — when were the roof, HVAC, electrical panel, plumbing, and water heater last replaced?
- Is there a deadline driving the sale (1031 exchange, divorce, estate, relocation)? That informs how much negotiation room exists.
- Schools are D-rated, which usually means shorter tenancies and higher turnover. Who's the typical renter profile here, and what's been the actual vacancy rate?
- Crime grade is F in this area — have there been break-ins, vandalism, or insurance claims at this property in the last 3 years? What carrier currently insures it and at what premium?
- What's the average days-on-market for RENTAL listings here right now (not sales)? A rising rental-DOM trend means longer vacancies and softer asking-rent achievability than the comps imply.
- What's the recent tenant-quality profile in this submarket — average credit score on applications, eviction rate, late-payment / NSF rate, and stable-employment percentage? A property-management company in the area should have these aggregated.
- How much new apartment / multifamily construction is in the pipeline within 1–3 miles? Heavy new supply (>2% of stock underway) typically softens rents 12–24 months out; light construction supports rent growth.
Investment metrics
- 1% rule
- 1.62% ✓
- Cap rate
- 14.03%
- Cash-on-cash
- 27.64%
- DSCR
- 2.23
- GRM
- 5.1
CMA / ARV
- ARV (on-the-fly)
- $388,024
- Comps found
- 12
Show comp detail 12 sales within ~0.75 mi
| Address | Dist | Beds/Ba | Sqft | Sold | Price | $/sf | Match |
|---|---|---|---|---|---|---|---|
| 1241 S 1st St | 0.15mi | 7/5.0 | 3,828 (+3%) | 1mo | $400,000 | $104 | 88 |
| 1420 S 1st St | 0.30mi | 7/4.0 | 3,736 (+0%) | 6mo | $442,000 | $118 | 81 |
| 1269 South South 1st Street St | 0.11mi | 8/5.0 | 3,718 (-0%) | 18mo | $115,000 | $31 | 79 |
| 1245 S 1st St | 0.14mi | —/— | 3,381 (-9%) | 4mo | $435,000 | $129 | 75 |
| 1219 S 2nd St | 0.25mi | 4/7.0 | 3,568 (-4%) | 18mo | $300,000 | $84 | 66 |
| 1410 S 2nd St | 0.34mi | —/3.0 | 3,483 (-7%) | 10mo | $140,000 | $40 | 65 |
| 1436 S 4th St | 0.52mi | 5/3.5 | 3,536 (-5%) | 4mo | $400,000 | $113 | 64 |
| 224 E Oak St | 0.19mi | 6/5.0 | 4,280 (+15%) | 11mo | $400,000 | $93 | 58 |
| 1445 S 1st St | 0.34mi | 8/3.0 | 3,407 (-9%) | 16mo | $454,000 | $133 | 57 |
| 103 W Kentucky St | 0.50mi | 5/4.0 | 3,432 (-8%) | 10mo | $310,000 | $90 | 55 |
| 528 E Oak St | 0.44mi | 5/3.0 | 3,358 (-10%) | 14mo | $390,000 | $116 | 51 |
| 541 E Ormsby Ave | 0.41mi | —/— | 3,440 (-8%) | 20mo | $152,500 | $44 | 51 |
Match score weights: distance 35% · size 25% · config 20% · recency 20%. Top-matched comps best support the ARV.
Projected returns pro-forma
-3.0% appreciation · 3.73% rent growth · sell at horizon
- IRR
- 22.5%
- Equity multiple
- 1.93×
- Total profit
- $98,747
- Equity at exit
- $56,510
- IRR
- 30.9%
- Equity multiple
- 3.88×
- Total profit
- $305,189
- Equity at exit
- $32,769
Cash invested: $106,120 (down + closing). Projections, not guarantees.
Landlord ↔ Tenant lean methodology
- Overall (STATE)
- 83 Strongly Landlord-Friendly
- State Kentucky
- 83 Strongly Landlord-Friendly · R+16
- County
- — inherits STATE
- City
- — inherits STATE
ZIP-level market 40203
- Home prices YoY
- -13.8%
- Rents YoY
- 3.7%
- Active inventory
- 114
- Price-to-rent
- 25.7×
Monthly cashflow live
- Estimated rent
- $6,141 high interval (Pro) →
- Mortgage (P&I)
- −$1,988
- Tax from tax record
- −$262 /mo · $3,144/yr
- Insurance
- −$158
- HOA
- −$0
- Vacancy / Maint / Mgmt
- −$1,290
- Net cashflow
- $2,444
Break-even live
5-unit breakdown (identical units grouped — click to expand)
| Units | Beds | Baths | Est. rent |
|---|---|---|---|
| 5× units | 3 | 1 | $6,140 |
| #1 | 3 | 1 | $1,228 |
| #2 | 3 | 1 | $1,228 |
| #3 | 3 | 1 | $1,228 |
| #4 | 3 | 1 | $1,228 |
| #5 | 3 | 1 | $1,228 |
| Total (5 units) | $6,141 | ||
UW: 25.0% down · 7.5% · 30yr · 1.5% tax · 5.0% vac · 8.0% maint · 8.0% mgmt
Financing live
Cash to close
- Down payment
- $94,750
- Closing costs
- $11,370
- Reserves months
- —
- Total cash needed
- —
Loan-product check · same deal, 3 products live
Conventional
25% down · 7.5% · 30yr
- Down + closing
- —
- Monthly P&I
- —
- Monthly cashflow
- —
- DSCR
- —
- Eligible?
- —
Personal DTI + credit; lowest rate.
DSCR
20% down · 8.5% · 30yr
- Down + closing
- —
- Monthly P&I
- —
- Monthly cashflow
- —
- DSCR
- —
- Eligible?
- —
No personal income docs; deal must DSCR.
Hard money
10% down · 12.0% · 12mo
- Down + closing
- —
- Monthly P&I
- —
- Monthly cashflow
- —
- DSCR
- —
- Eligible?
- —
Short-term bridge; refi at stabilization.
Rent comps 4 comps
| Address | Beds | Baths | Sqft | Rent | $/sqft | DOM | Units | Dist |
|---|---|---|---|---|---|---|---|---|
| 1100 S 3rd St Louisville, KY | 3.0 | 2.0 | 2832 | $2,500 | $0.88 | 23d | 1 | 0.49mi |
| 1115 S 4th St Unit 300 Louisville, KY | 3.0 | 1.0 | 3200 | $1,975 | $0.62 | 23d | 1 | 0.50mi |
| 540 S 4th St Unit 401 Louisville, KY | 3.0 | 3.5 | 3200 | $4,500 | $1.41 | 23d | 1 | 1.33mi |
| 540 S 4th St Unit 401 Louisville, KY | 3.0 | 3.5 | 3200 | $4,500 | $1.41 | 11d | 1 | 1.33mi |
Listing history 20 events
-
2026-06-18days on market $379,000 Active 27 DOM
-
2026-06-17days on market $379,000 Active 26 DOM
-
2026-06-16days on market $379,000 Active 25 DOM
-
2026-06-15days on market $379,000 Active 24 DOM
-
2026-06-13days on market $379,000 Active 22 DOM
-
2026-06-10days on market $379,000 Active 19 DOM
-
2026-06-09days on market $379,000 Active 18 DOM
-
2026-06-08days on market $379,000 Active 17 DOM
-
2026-06-07days on market $379,000 Active 16 DOM
-
2026-06-03days on market $379,000 Active 12 DOM
-
2026-06-02days on market $379,000 Active 11 DOM
-
2026-06-01days on market $379,000 Active 10 DOM
-
2026-05-31days on market $379,000 Active 9 DOM
-
2026-05-22$379,000 Active
-
2025-07-31historical
-
2025-06-04price $379,000
-
2025-06-04price $380,000
-
2025-04-24$350,000 Active
-
2016-05-25soldstatus $99,900
-
2016-04-07soldstatus $50,000
ⓘ Source: listings_history table (triggers on properties + properties_extension) + one-shot
backfill from property_details.listing_events for pre-trigger history.
Tax reassessment forecast KY · Resets to sale price
- Current annual tax
- $3,144 · $262/mo
- Projected year-2 tax
- $3,259 · $272/mo
- Expected delta
- +$115/yr (+$10/mo · 3.7%)
ⓘ Screening estimate from a state-policy table — verify with the county assessor before closing.
Climate risk First Street
- Flood 1/10 Low FEMA zone X (unshaded) · 0% chance over 30 yrs
- Wildfire 1/10 Low
- Heat 5/10 Major 7 d/yr ≥105°F today · 19 d/yr by 30 yrs out
- Wind 2/10 Low 100% chance of damaging wind over 30 yrs
- Air quality 2/10 Low 1 unhealthy d/yr today · 3 by 30 yrs out
Nearby sold comps map
Loading sold comps map…
Walkable amenities ~0.75 mi
Loading nearby amenities…
Taxation est. · year 1
- Rental income
- $73,692
- − Mortgage interest
- −$21,230
- − Property taxes
- −$3,144
- − Insurance
- −$1,895
- − Repairs & maintenance
- −$5,895
- − Management
- −$5,895
- − Depreciation
- −$11,025
- Taxable income
- $24,607
- Est. tax owed @ 24.0%
- −$5,906
- After-tax cash flow
- $23,422/yr
For passive investors: Depreciation is non-cash, so a rental often shows a tax loss while cash-flowing — sheltering income. Rental losses are passive: they offset passive income freely, and up to $25,000/yr can offset ordinary (W-2) income if you actively participate and your MAGI is under $100k (phasing out to $0 by $150k); unused losses carry forward. On sale, claimed depreciation is recaptured at up to 25%, and gains may owe capital-gains tax (a 1031 exchange can defer both). Figures are a year-1 estimate at your 24.0% rate — not tax advice; consult a CPA.
Schools (NCES district)
- District
- Jefferson County
- NCES district ID
- 2102990
- Math proficiency
- 19% ▼ -17.00%
- Reading proficiency
- 35% ▼ -11.00%
- Median HH income
- $47,885
- Composite
- 23.45/100
- National rank
- #7884
- State rank
- #121 of 165 in KY
Livability — Louisville
- Score
- 63/100
- State rank
- #333
- US rank
- #15887
Category grades
Schools grade is shown separately in the Schools card above.
Census & demographics
- Census place
- Louisville, KY
- County
- Jefferson County · 790,184 people
- City population
- 769,292
- Metro
- Louisville/Jefferson County, KY-IN
- Population (ZIP)
- 17,742
- Household income
- $30,794
- Rent vs Own
- Severe rent burden
- 1603.0
Population outlook (Jefferson County) Hauer SSP2
- Today (2025)
- 823,112 people
- By 2030
- 849,343 · +3.2%
- By 2040
- 895,696 · +8.8%
- By 2050
- 933,630 · +13.4%
- By 2075
- 1,028,262 · +24.9%
- By 2100
- 1,072,675 · +30.3%
Race, ethnicity, and origin ACS 2023
- Neighborhood character
- Diverse neighborhood (Simpson 0.56)
- Race & ethnicity
- Black 49% White 44% Two or more races 4% Hispanic / Latino 3%
- Common ancestry
- Slovak 2% Lithuanian 2% Romanian 1%
- Foreign-born
- 3% · Canada
- Languages at home
- 97% English-only · Spanish 2%
Political lean MEDSL · Jefferson
- 2024 margin
- D (+16.6) · D 57.4% · R 40.9% · Other 1.7%
- 2008→2024 swing
- +4.5pp toward D · 2008: 12.0pp · 2024: 16.6pp
- All cycles
- 2024: D+16.6 2020: D+20.1 2016: D+13.3 2012: D+11.1 2008: D+12.0
Not yet ingested
- Civics
- —
Market trends
- HPI YoY
- ▼ -64.74%
- Current HPI
- 405.1872
- Rent YoY
- ▲ 3.73%
- Metro
- Louisville/Jefferson County, KY-IN
- State GDP YoY
- ▲ 1.81%
- F500 in state
- 4
Industry mix (Fortune 500 HQ in KY)
| Industry | F500 HQs | Revenue |
|---|---|---|
| Healthcare | 1 | $118B |
|
||
| Food / Beverage | 1 | $7B |
|
||
Price history
+658.0% since first listed7 events — show timeline
- 2026-05-22 Listed $379,000 Metro Search MLS
- 2025-07-31 Listing Removed — Metro Search MLS
- 2025-06-04 Price Changed $379,000 Metro Search MLS
- 2025-06-04 Price Changed $380,000 Metro Search MLS
- 2025-04-24 Listed $350,000 Metro Search MLS
- 2016-05-25 Sold (Public Records) $99,900 Public Records
- 2016-04-07 Sold (Public Records) $50,000 Public Records
Property tax history
+9.2%/yrLatest (2025): $3,144 · -1.9% YoY. Source: county tax records.
Cash-flow waterfall
monthlySold comps — $/sqft
last 12 mo · ≤1 miLoading sold comps…