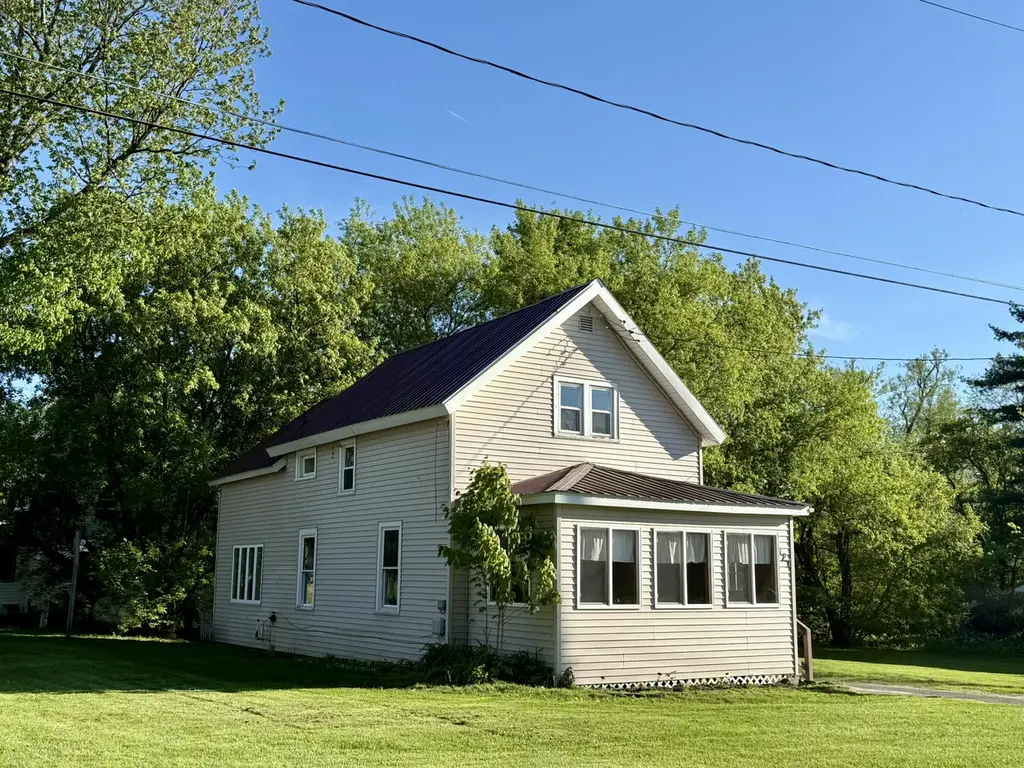
127 William St · Malone, NY
Flood risk 1/10 · Minimal
- FEMA flood zone
- X
- Chance of flooding over 30 yrs
- 0.0%
- Est. flood insurance / yr
- $473 – $860
Fire risk 2/10 · Minimal
- Est. fire insurance / yr
- $691 – $1,283
Heat risk 2/10 · Minimal
- Hot days now (above 90°F)
- 7 days/yr
- Hot days in 30 yrs
- 17 days/yr
Wind risk 1/10 · Minimal
- Chance of severe wind over 30 yrs
- —
Air-quality risk 1/10 · Minimal
- Unhealthy air days now
- 0 days/yr
- Unhealthy air days in 30 yrs
- 0 days/yr
Risk factors via First Street. Map © Google.
Why this score? — see what drove the D- grade
The composite is a weighted blend of 9 inputs, each scored 0–100. Each bar is that input's sub-score; the figure is the points it added to the 100-point composite (weight × sub-score).
- Cash flow +10.2/30.0
- Appreciation +10.0/10.0
- Livability +3.5/5.0
- 1% rule +3.1/10.0
- DSCR +2.9/10.0
- Rent growth +2.5/5.0
- Condition / age +2.5/5.0
- Schools +2.4/10.0
- ARV discount +0.0/15.0
$123,000
🖨 Deal sheet (PDF) 📄 Offer letter ✓ Due diligence
Listing remarks
127 William St offers charm, updates, and flexible living space on a . 27-acre lot in the Village of Malone. Public records list the home as a 2 bedroom, 1 bath, but the main floor includes an additional room that could easily be used as a first-floor primary suite, guest space, office, playroom, or second living area depending on the buyer's needs. Inside, you'll find spacious rooms, updated flooring, a stylish kitchen with dark cabinetry, tile backsplash, gas range, and great natural light. The large bathroom features a soaking tub, tiled shower, modern flooring, and plenty of space. Upstairs offers two bedrooms, including a roomy bedroom with sloped ceilings and character. Outside, the p
Key facts
- Great natural light
- Soaking tub
- Stylish kitchen
Tags
Property features AI
Exterior
- Parking: Garage (1 car)
- Utilities: Public water; Public sewer; Water and sewer connected
- Home design: Single-family residence; Residential property; Updated/remodeled condition
- Construction: Metal roof
- Exterior features: Enclosed patio/porch; Front porch; Paved road access
Interior
- Kitchen: Free-standing gas range; Microwave; Refrigerator
- Bathrooms: 1 full bathroom
- Interior features: Updated/remodeled interior; Free-standing gas range; Microwave; Refrigerator
- Laundry & utility: Laundry on main level
Neighborhood map
What this means for you Summary
Snapshot
- This is a 2-bed/1.0-bath single-family listed at $123k.
Deal economics
- At list price, monthly cash flow is $-69 ($-824/yr) — negative.
- To cash-flow at today's rent, offer at most $111k (9.9% below list).
- To meet the 1% rule (rent ≥ 1% of price), the offer needs to be $100k (18.7% below list).
- Recommended offer: $100k (18.7% below list) — sets the bar for 1% rule.
Location & tenants
- Location reads 70/100 on livability (#437 in NY) — a middle-class / working-renter tenant base. Strengths: cost of living A+, housing A+, health & safety A+; Watch: employment D+, crime D-, amenities F.
- Malone Central School District (town): math 27% / reading 29% proficiency, ranked #581 of 590 in NY (top 98%) — low school quality limits family demand, transient renter base, plan for 1-2y turnover.
- Zoned schools: Flanders Elementary School (math 17% / reading 27%, grade F, #1,923 of 2,108 statewide, top 92%, 201 students, 51% FRL); Malone Middle School (math 8% / reading 32%, grade F, #678 of 729 statewide, top 94%, 500 students, 52% FRL); Franklin Academy High School (math 82% / reading 70%, grade A-, #623 of 1,100 statewide, top 57%, 719 students, 47% FRL).
- Market conditions: 115 active listings in the ZIP; 124 units permitted in Franklin County in 2024 (0 in 5+ unit buildings).
Forward outlook
- In year one you build about $13k of equity ($850 loan paydown + $12k appreciation (10.0% local appreciation)).
- Franklin County population projected at -14% by 2050 — secular population decline; favor cash flow + early exit over multi-decade hold.
- At projected returns (10.0% appreciation + 3.0% rent growth), your $34k cash investment doubles in ~3 years — after that, you're playing with house money.
- By year 3, paydown + projected appreciation supports a ~$33k cash-out refi (75% LTV) — recoverable capital for the next deal without selling this one.
Negotiation context
- It's been on market 17 days — a 2% lower offer ($121k) is reasonable based on typical stale-listing flexibility.
- Current owner paid $36k; list at $123k implies a 242% gain — meaningful room to come down on a strong offer.
Risks & watch-outs
- Watch-outs: built in 1860 — expect roof / HVAC / electrical / plumbing capex.
Questions for the listing agent
- What do current leases actually rent for vs. the listed asking? Can we see a recent rent roll and the last 12 months of T-12 income?
- Built in 1860 — when were the roof, HVAC, electrical panel, plumbing, and water heater last replaced?
- Is there a deadline driving the sale (1031 exchange, divorce, estate, relocation)? That informs how much negotiation room exists.
- Schools are D-rated, which usually means shorter tenancies and higher turnover. Who's the typical renter profile here, and what's been the actual vacancy rate?
- Crime grade is D in this area — have there been break-ins, vandalism, or insurance claims at this property in the last 3 years? What carrier currently insures it and at what premium?
- The area grade is low — what's the realistic commute time and amenity access for the typical tenant pool here? Any planned neighborhood developments (good or bad) we should know about?
- What's the average days-on-market for RENTAL listings here right now (not sales)? A rising rental-DOM trend means longer vacancies and softer asking-rent achievability than the comps imply.
- What's the recent tenant-quality profile in this submarket — average credit score on applications, eviction rate, late-payment / NSF rate, and stable-employment percentage? A property-management company in the area should have these aggregated.
- How much new for-sale + rental construction is in the pipeline within 1–3 miles? Heavy new supply typically softens prices + rents 12–24 months out; constrained supply supports both.
Investment metrics
- 1% rule
- 0.81% ✗
- Cap rate
- 5.62%
- Cash-on-cash
- -2.39%
- DSCR
- 0.89
- GRM
- 10.3
CMA / ARV
- ARV (on-the-fly)
- $104,380
- Comps found
- 8
Show comp detail 8 sales within ~0.75 mi
| Address | Dist | Beds/Ba | Sqft | Sold | Price | $/sf | Match |
|---|---|---|---|---|---|---|---|
| 162 William St | 0.09mi | 3/1.0 (+1) | 1,156 (-6%) | 8mo | $82,400 | $71 | 74 |
| 24 William St | 0.25mi | 2/1.5 | 1,250 (+2%) | 18mo | $115,000 | $92 | 69 |
| 4 Scott Dr | 0.50mi | 3/1.0 (+1) | 1,232 (+0%) | 3mo | $161,000 | $131 | 68 |
| 28 Branch St St | 0.68mi | 2/1.5 | 1,196 (-3%) | 5mo | $18,000 | $15 | 58 |
| 12 Spaulding Ave. Ave | 0.54mi | 3/1.5 (+1) | 1,156 (-6%) | 5mo | $69,500 | $60 | 54 |
| 20 Beman St | 0.46mi | 2/1.5 | 1,350 (+10%) | 19mo | $80,000 | $59 | 44 |
| 43 Branch St St | 0.74mi | 3/1.0 (+1) | 1,176 (-4%) | 12mo | $125,000 | $106 | 43 |
| 31 South St | 0.73mi | 2/2.0 | 1,233 (+0%) | 22mo | $105,000 | $85 | 43 |
Match score weights: distance 35% · size 25% · config 20% · recency 20%. Top-matched comps best support the ARV.
Projected returns pro-forma
10.0% appreciation · 3.0% rent growth · sell at horizon
- IRR
- 22.6%
- Equity multiple
- 2.82×
- Total profit
- $62,635
- Equity at exit
- $110,808
- IRR
- 20.2%
- Equity multiple
- 6.46×
- Total profit
- $187,929
- Equity at exit
- $238,962
Cash invested: $34,440 (down + closing). Projections, not guarantees.
Landlord ↔ Tenant lean methodology
- Overall (STATE)
- 15 Strongly Tenant-Friendly
- State New York
- 15 Strongly Tenant-Friendly · D+10
- County
- — inherits STATE
- City
- — inherits STATE
ZIP-level market 12953
- Home prices YoY
- 7.2%
- Active inventory
- 115
- Price-to-rent
- 10.3×
Monthly cashflow live
- Estimated rent
- $1,000 medium interval (Pro) →
- Mortgage (P&I)
- −$645
- Tax from tax record
- −$162 /mo · $1,947/yr
- Insurance
- −$51
- HOA
- −$0
- Vacancy / Maint / Mgmt
- −$210
- Net cashflow
- $-69
Break-even live
Sensitivity live
| Price | -10% $1 | -5% $-34 | +0% $-69 | +5% $-104 | +10% $-138 |
|---|---|---|---|---|---|
| Rent | -10% $-148 | -5% $-108 | +0% $-69 | +5% $-29 | +10% $10 |
| Rate | -1.0pp $-7 | -0.5pp $-37 | base $-69 | +0.5pp $-101 | +1.0pp $-133 |
UW: 25.0% down · 7.5% · 30yr · 1.5% tax · 5.0% vac · 8.0% maint · 8.0% mgmt
Financing live
Cash to close
- Down payment
- $30,750
- Closing costs
- $3,690
- Reserves months
- —
- Total cash needed
- —
Loan-product check · same deal, 3 products live
Conventional
25% down · 7.5% · 30yr
- Down + closing
- —
- Monthly P&I
- —
- Monthly cashflow
- —
- DSCR
- —
- Eligible?
- —
Personal DTI + credit; lowest rate.
DSCR
20% down · 8.5% · 30yr
- Down + closing
- —
- Monthly P&I
- —
- Monthly cashflow
- —
- DSCR
- —
- Eligible?
- —
No personal income docs; deal must DSCR.
Hard money
10% down · 12.0% · 12mo
- Down + closing
- —
- Monthly P&I
- —
- Monthly cashflow
- —
- DSCR
- —
- Eligible?
- —
Short-term bridge; refi at stabilization.
Listing history 10 events
-
2026-06-09status $123,000 Pending 17 DOM
-
2026-06-08days on market $123,000 Active 17 DOM
-
2026-06-07days on market $123,000 Active 16 DOM
-
2026-06-07days on market $123,000 Active 15 DOM
-
2026-06-04days on market $123,000 Active 12 DOM
-
2026-06-02days on market $123,000 Active 11 DOM
-
2026-06-01days on market $123,000 Active 10 DOM
-
2026-05-31days on market $123,000 Active 9 DOM
-
2026-05-21$123,000 Active
-
1994-11-28soldstatus $36,000
ⓘ Source: listings_history table (triggers on properties + properties_extension) + one-shot
backfill from property_details.listing_events for pre-trigger history.
Tax reassessment forecast NY · Partial reset (capped growth)
- Current annual tax
- $1,947 · $162/mo
- Projected year-2 tax
- $2,013 · $168/mo
- Expected delta
- +$66/yr (+$5/mo · 3.4%)
ⓘ Screening estimate from a state-policy table — verify with the county assessor before closing.
Climate risk First Street
- Flood 1/10 Low FEMA zone X · 0% chance over 30 yrs
- Wildfire 2/10 Low
- Heat 2/10 Low 7 d/yr ≥90°F today · 17 d/yr by 30 yrs out
- Wind 1/10 Low
- Air quality 1/10 Low 0 unhealthy d/yr today · 0 by 30 yrs out
Nearby sold comps map
Loading sold comps map…
Walkable amenities ~0.75 mi
Loading nearby amenities…
Taxation est. · year 1
- Rental income
- $11,998
- − Mortgage interest
- −$6,890
- − Property taxes
- −$1,947
- − Insurance
- −$615
- − Repairs & maintenance
- −$960
- − Management
- −$960
- − Depreciation
- −$3,578
- Taxable loss
- −$2,952
- Est. tax savings @ 24.0%
- +$709
- After-tax cash flow
- $-116/yr
For passive investors: Depreciation is non-cash, so a rental often shows a tax loss while cash-flowing — sheltering income. Rental losses are passive: they offset passive income freely, and up to $25,000/yr can offset ordinary (W-2) income if you actively participate and your MAGI is under $100k (phasing out to $0 by $150k); unused losses carry forward. On sale, claimed depreciation is recaptured at up to 25%, and gains may owe capital-gains tax (a 1031 exchange can defer both). Figures are a year-1 estimate at your 24.0% rate — not tax advice; consult a CPA.
Schools (NCES district)
- District
- Malone Central School District
- NCES district ID
- 3618180
- Math proficiency
- 27% ▼ -16.00%
- Reading proficiency
- 29% ▼ -11.00%
- Median HH income
- $46,681
- Composite
- 24.23/100
- National rank
- #7725
- State rank
- #581 of 590 in NY
Livability — Malone
- Score
- 70/100
- State rank
- #437
- US rank
- #7656
Category grades
Schools grade is shown separately in the Schools card above.
Census & demographics
- Census place
- Malone, NY
- Population (ZIP)
- 12,842
Population outlook (Franklin County) Hauer SSP2
- Today (2025)
- 48,098 people
- By 2030
- 46,790 · -2.7%
- By 2040
- 44,400 · -7.7%
- By 2050
- 41,256 · -14.2%
- By 2075
- 32,190 · -33.1%
- By 2100
- 23,407 · -51.3%
Race, ethnicity, and origin ACS 2023
- Neighborhood character
- Predominantly White (83%)
- Race & ethnicity
- White 83% Black 9% Hispanic / Latino 6%
- Hispanic origin (detail)
- Puerto Rican 2%
- Common ancestry
- Lithuanian 16% Slovak 5% Italian 2%
- Foreign-born
- 3% · Canada
- Languages at home
- 94% English-only · Spanish 4% Other Indo-European 1% French/Haitian/Cajun 1%
Political lean MEDSL · Franklin
- 2024 margin
- Lean R (+9.0) · D 45.5% · R 54.5%
- 2008→2024 swing
- -31.2pp toward R · 2008: 22.2pp · 2024: -9.0pp
- All cycles
- 2024: R+9.0 2020: R+2.2 2016: R+7.4 2012: D+26.3 2008: D+22.2
Not yet ingested
- Civics
- —
Market trends
- HPI YoY
- ▲ 17.73%
- Current HPI
- 263.2406
- Rent YoY
- —
- Metro
- —
- State GDP YoY
- ▲ 2.60%
- F500 in state
- 92
Industry mix (Fortune 500 HQ in NY)
| Industry | F500 HQs | Revenue |
|---|---|---|
| Financial Services | 10 | $950B |
|
||
| Consumer Goods | 9 | $162B |
|
||
| Insurance | 4 | $225B |
|
||
| Telecommunications | 2 | $144B |
|
||
| Pharmaceuticals | 2 | $112B |
|
||
| Media / Entertainment | 2 | $69B |
|
||
Price history
+241.7% since first listed2 events — show timeline
- 2026-05-21 Listed $123,000 ACVMLS
- 1994-11-28 Sold (Public Records) $36,000 Public Records
Property tax history
+3.4%/yrLatest (2025): $1,947 · -0.7% YoY. Source: county tax records.
Cash-flow waterfall
monthlySold comps — $/sqft
last 12 mo · ≤1 miLoading sold comps…