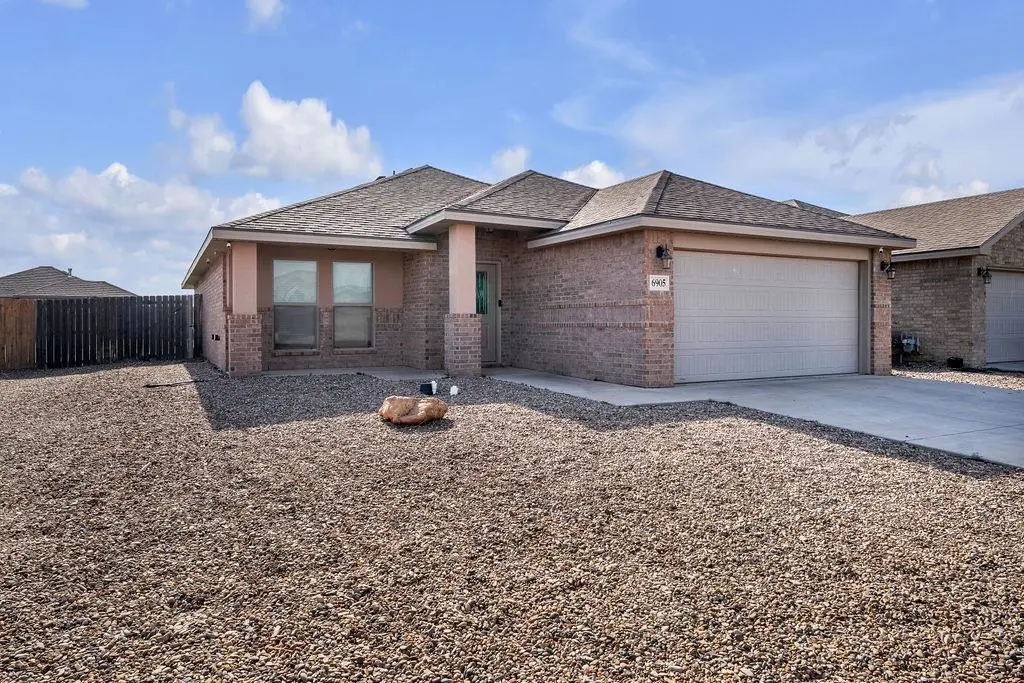
6905 Lone Star · Midland, TX
Flood risk 1/10 · Minimal
- FEMA flood zone
- X
- Chance of flooding over 30 yrs
- 0.0%
- Est. flood insurance / yr
- $507 – $1,088
Fire risk 8/10 · Major
- Est. fire insurance / yr
- $1,222 – $2,270
Heat risk 6/10 · Moderate
- Hot days now (above 102°F)
- 6 days/yr
- Hot days in 30 yrs
- 19 days/yr
Wind risk 2/10 · Minimal
- Chance of severe wind over 30 yrs
- 3.0%
Air-quality risk 1/10 · Minimal
- Unhealthy air days now
- 0 days/yr
- Unhealthy air days in 30 yrs
- 0 days/yr
Risk factors via First Street. Map © Google.
Why this score? — see what drove the D- grade
The composite is a weighted blend of 9 inputs, each scored 0–100. Each bar is that input's sub-score; the figure is the points it added to the 100-point composite (weight × sub-score).
- Cash flow +12.7/30.0
- ARV discount +6.4/15.0
- Livability +4.0/5.0
- DSCR +3.8/10.0
- 1% rule +3.7/10.0
- Schools +3.2/10.0
- Rent growth +3.1/5.0
- Condition / age +2.5/5.0
- Appreciation +0.0/10.0
$299,000
🖨 Deal sheet 📄 Offer letter ✓ Due diligence
Listing remarks MLS
A beautiful 3 bedroom, 2 bath, 2 car garage, located in Lone Star Trails. This home features an open concept floor plan with tall ceilings, granite counters throughout, water softener, tile floors in the living areas and bathrooms, carpet in the bedrooms, all bedroom closets have built ins for storage/organization. Low maintenance desert-scaped front yard, a nice sized back yard for your family get togethers. Call your favorite Realtor to schedule your showing!
Key facts
- 6,882 sq ft lot
- 2 garage spots
- Built 2017
Neighborhood map
What this means for you Summary
Snapshot
- This is a 3-bed/2.0-bath single-family listed at $299k.
Deal economics
- At list price, monthly cash flow is $-33 ($-397/yr) — negative.
- To cash-flow at today's rent, offer at most $293k (2.0% below list).
- To meet the 1% rule (rent ≥ 1% of price), the offer needs to be $260k (13.0% below list).
- Recommended offer: $260k (13.0% below list) — sets the bar for 1% rule.
- Cap rate 6.2% vs local median 4.7% in Midland — meaningfully above typical; check what's discounted (condition, days-on-market, listing class) to confirm the premium yield is real.
Location & tenants
- Location reads 79/100 on livability (#57 in TX, #2,192 nationally) — a middle-class / working-renter tenant base. Strengths: employment A+, housing A+, health & safety A+; Watch: schools C-, crime C-, commute D+.
- Midland ISD (urban): math 34% / reading 36% proficiency, ranked #477 of 826 in TX (top 58%) — families likely to look elsewhere, expect single-tenant / working-renter base with shorter leases.
- Market conditions: Rents rising (+2.6%/yr); 452 active listings in the ZIP; 40 comparable units currently listed for rent nearby; rentals at typical pace (median 21d on market — plan ~3-4 weeks tenant-placement turnaround); 42% of comp listings sitting > 30 days — soft ceiling on asking rent; solid renter incomes; 1,504 units permitted in Midland County in 2024 (0 in 5+ unit buildings).
Forward outlook
- Local home prices are declining (-3.0%/yr); year-one equity from $2k of loan paydown is wiped out by about $9k of value loss. Plan a longer hold.
- Midland County population projected at +83% by 2050 — long-run rental-demand tailwind backs the buy-and-hold thesis.
Negotiation context
- It's been on market 61 days — a 6% lower offer ($281k) is reasonable based on typical stale-listing flexibility.
- 2 sale attempts; this cycle's ask has dropped $21k (7%) from the opening price — seller is motivated, your offer sets the floor, not the list.
Risks & watch-outs
- Climate carrying-cost: severe wildfire risk; extreme-heat days projected 6→19/yr by 2055 (HVAC capex compounding) — expect insurance premiums to compound above CPI over the hold.
Questions for the listing agent
- What do current leases actually rent for vs. the listed asking? Can we see a recent rent roll and the last 12 months of T-12 income?
- It's been on market 61 days. Have you received any prior offers? Is the seller open to a 13% concession, seller financing, or rate buy-down credit?
- What does the HOA fee cover, when was the last increase, and are there any pending special assessments or reserve-fund shortfalls?
- Why hasn't it sold? Are there any deal-killer items the seller is aware of (foundation, flood, title, zoning, code violations)?
- Is there a deadline driving the sale (1031 exchange, divorce, estate, relocation)? That informs how much negotiation room exists.
- The area grade is low — what's the realistic commute time and amenity access for the typical tenant pool here? Any planned neighborhood developments (good or bad) we should know about?
- What's the average days-on-market for RENTAL listings here right now (not sales)? A rising rental-DOM trend means longer vacancies and softer asking-rent achievability than the comps imply.
- What's the recent tenant-quality profile in this submarket — average credit score on applications, eviction rate, late-payment / NSF rate, and stable-employment percentage? A property-management company in the area should have these aggregated.
- How much new for-sale + rental construction is in the pipeline within 1–3 miles? Heavy new supply typically softens prices + rents 12–24 months out; constrained supply supports both.
Investment metrics
- 1% rule
- 0.87% ✗
- Cap rate
- 6.16%
- Cash-on-cash
- -0.47%
- DSCR
- 0.98
- GRM
- 9.6
CMA / ARV
- ARV (median comp)
- $292,084
- List price
- $299,000
- Delta
- 2.37%
- Verdict
- FAIR
- Comps
- 4 within 1.0 mi
Show comp detail 2 sales within ~0.75 mi
| Address | Dist | Beds/Ba | Sqft | Sold | Price | $/sf | Match |
|---|---|---|---|---|---|---|---|
| 6907 Saddle Ct | 0.06mi | 3/2.0 | 1,706 (+0%) | 1mo | $309,000 | $181 | 96 |
| 1401 Brand Ln | 0.36mi | 3/2.0 | 1,658 (-2%) | 10mo | $310,000 | $187 | 71 |
Match score weights: distance 35% · size 25% · config 20% · recency 20%. Top-matched comps best support the ARV.
Projected returns pro-forma
-3.0% appreciation · 2.56% rent growth · sell at horizon
- IRR
- -17.6%
- Equity multiple
- 0.38×
- Total profit
- $-51,654
- Equity at exit
- $44,582
- IRR
- -10.4%
- Equity multiple
- 0.38×
- Total profit
- $-52,144
- Equity at exit
- $25,852
Cash invested: $83,720 (down + closing). Projections, not guarantees.
Landlord ↔ Tenant lean methodology
- Overall (STATE)
- 87 Strongly Landlord-Friendly
- State Texas
- 87 Strongly Landlord-Friendly · R+5
- County
- — inherits STATE
- City
- — inherits STATE
ZIP-level market 79705
- Rents YoY
- 2.6%
- Active inventory
- 452
- Price-to-rent
- 9.6×
Monthly cashflow live
- Estimated rent
- $2,600 high interval (Pro) →
- Mortgage (P&I)
- −$1,568
- Tax from tax record
- −$370 /mo · $4,435/yr
- Insurance
- −$125
- HOA
- −$25
- Vacancy / Maint / Mgmt
- −$546
- Net cashflow
- $-33
Break-even live
UW: 25.0% down · 7.5% · 30yr · 1.5% tax · 5.0% vac · 8.0% maint · 8.0% mgmt
Financing live
Cash to close
- Down payment
- $74,750
- Closing costs
- $8,970
- Reserves months
- —
- Total cash needed
- —
Loan-product check · same deal, 3 products live
Conventional
25% down · 7.5% · 30yr
- Down + closing
- —
- Monthly P&I
- —
- Monthly cashflow
- —
- DSCR
- —
- Eligible?
- —
Personal DTI + credit; lowest rate.
DSCR
20% down · 8.5% · 30yr
- Down + closing
- —
- Monthly P&I
- —
- Monthly cashflow
- —
- DSCR
- —
- Eligible?
- —
No personal income docs; deal must DSCR.
Hard money
10% down · 12.0% · 12mo
- Down + closing
- —
- Monthly P&I
- —
- Monthly cashflow
- —
- DSCR
- —
- Eligible?
- —
Short-term bridge; refi at stabilization.
Rent comps 40 comps
| Address | Beds | Baths | Sqft | Rent | $/sqft | DOM | Units | Dist |
|---|---|---|---|---|---|---|---|---|
| 6809 Brush Dr Midland, TX | 3.0 | 2.0 | 1466 | $2,500 | $1.71 | 13d | 1 | 0.21mi |
| 6812 Brush Dr Midland, TX | 3.0 | 2.0 | 1450 | $2,500 | $1.72 | 13d | 1 | 0.23mi |
| 1621 Revolution Dr Midland, TX | 3.0 | 2.0 | 1504 | $2,500 | $1.66 | 43d | 1 | 0.26mi |
| 1315 Yellow Rose Ct Midland, TX | 3.0 | 2.0 | 1600 | $2,600 | $1.62 | 13d | 1 | 0.29mi |
| 6706 Yellow Rose Ct Midland, TX | 3.0 | 2.0 | 1819 | $2,800 | $1.54 | 43d | 1 | 0.31mi |
| 1704 Rattler Ln Midland, TX | 3.0 | 2.0 | 1498 | $2,500 | $1.67 | 20d | 1 | 0.35mi |
| 1708 Rattler Ln Midland, TX | 3.0 | 2.0 | 1694 | $2,550 | $1.51 | 43d | 1 | 0.35mi |
| 1508 Rattler Ln Midland, TX | 3.0 | 2.0 | 1578 | $2,250 | $1.43 | 13d | 1 | 0.39mi |
| 6717 Brand Ln Midland, TX | 3.0 | 2.0 | 1500 | $2,400 | $1.60 | 20d | 1 | 0.39mi |
| 6801 Baron Dr Midland, TX | 4.0 | 2.0 | 2058 | $3,150 | $1.53 | 13d | 1 | 0.42mi |
| 1501 Wrangler Ln Midland, TX | 3.0 | 2.0 | 1960 | $2,750 | $1.40 | 13d | 1 | 0.42mi |
| 1310 Wrangler Ln Midland, TX | 3.0 | 2.0 | 1387 | $2,400 | $1.73 | 20d | 1 | 0.50mi |
| 1416 Bajada St Midland, TX | 4.0 | 2.0 | 1933 | $3,150 | $1.63 | 13d | 1 | 0.58mi |
| 1408 Bajada St Midland, TX | 3.0 | 2.0 | 1633 | $2,599 | $1.59 | 43d | 1 | 0.59mi |
| 1336 Hogback Way Midland, TX | 3.0 | 2.0 | 1633 | $2,950 | $1.81 | 43d | 1 | 0.59mi |
| 6914 Outlaw Ct Midland, TX | 4.0 | 2.0 | 2123 | $3,250 | $1.53 | 13d | 1 | 0.60mi |
| 1341 Hogback Way Midland, TX | 3.0 | 2.0 | 1633 | $2,850 | $1.75 | 43d | 1 | 0.60mi |
| 1348 Bajada St Midland, TX | 4.0 | 2.0 | 1910 | $3,100 | $1.62 | 43d | 1 | 0.61mi |
| 1405 Bajada St Midland, TX | 3.0 | 2.0 | 1633 | $2,950 | $1.81 | 13d | 1 | 0.61mi |
| 1316 Hogback Way Midland, TX | 3.0 | 2.0 | 1633 | $2,599 | $1.59 | 43d | 1 | 0.62mi |
| 1336 Bajada St Midland, TX | 4.0 | 2.0 | 1910 | $2,899 | $1.52 | 43d | 1 | 0.63mi |
| 1325 Hogback Way Midland, TX | 4.0 | 2.0 | 1910 | $2,950 | $1.54 | 43d | 1 | 0.63mi |
| 1321 Hogback Way Midland, TX | 3.0 | 2.0 | 1633 | $2,850 | $1.75 | 43d | 1 | 0.63mi |
| 1341 Bajada St Midland, TX | 4.0 | 2.0 | 1910 | $2,950 | $1.54 | 20d | 1 | 0.64mi |
| 1337 Bajada St Midland, TX | 3.0 | 2.0 | 1633 | $2,950 | $1.81 | 20d | 1 | 0.64mi |
| 1337 Bajada St Midland, TX | 3.0 | 2.0 | 1633 | $2,900 | $1.78 | 43d | 1 | 0.64mi |
| 1300 Hogback Way Midland, TX | 3.0 | 2.0 | 1485 | $2,350 | $1.58 | 43d | 1 | 0.65mi |
| 1305 Hogback Way Midland, TX | 3.0 | 2.0 | 1633 | $2,850 | $1.75 | 13d | 1 | 0.66mi |
| 1312 Bajada St Midland, TX | 3.0 | 2.0 | 1633 | $2,950 | $1.81 | 20d | 1 | 0.67mi |
| 1300 Bajada St Midland, TX | 4.0 | 2.0 | 1910 | $3,150 | $1.65 | 43d | 1 | 0.69mi |
| 1300 Bajada St Midland, TX | 4.0 | 2.0 | 1910 | $3,150 | $1.65 | 20d | 1 | 0.69mi |
| 1341 Loess St Midland, TX | 3.0 | 2.0 | 1623 | $2,795 | $1.72 | 43d | 1 | 0.70mi |
| 2060 Acacia Ln Midland, TX | 3.0 | 2.0 | 2050 | $3,100 | $1.51 | 13d | 1 | 0.73mi |
| 2409 Husk St Unit 1 Midland, TX | 3.0 | 2.0 | 1800 | $3,000 | $1.67 | 13d | 1 | 0.73mi |
| 2409 Husk St Midland, TX | 3.0 | 2.0 | 1927 | $2,800 | $1.45 | 13d | 1 | 0.73mi |
| 1301 Bajada St Midland, TX | 3.0 | 2.0 | 1633 | $2,950 | $1.81 | 20d | 1 | 0.75mi |
| 6309 Ojibwa Midland, TX | 3.0 | 2.0 | 1300 | $2,150 | $1.65 | 20d | 1 | 0.88mi |
| 6333 Poppy Dr Midland, TX | 3.0 | 2.0 | 1350 | $2,500 | $1.85 | 20d | 1 | 0.90mi |
| 2702 Southwest St Midland, TX | 3.0 | 2.0 | 1844 | $2,500 | $1.36 | 43d | 1 | 0.98mi |
| 6735 Draw Ct Midland, TX | 4.0 | 2.0 | 2050 | $2,500 | $1.22 | 43d | 1 | 0.99mi |
HOA detail
- Monthly dues
- $25 · $300/yr
- Likely covers
- water
Listing history 19 events
-
2026-06-18status $299,000 Pending 61 DOM
-
2026-06-17days on market $299,000 Active 61 DOM
-
2026-06-16days on market $299,000 Active 60 DOM
-
2026-06-15days on market $299,000 Active 59 DOM
-
2026-06-14days on market $299,000 Active 57 DOM
-
2026-06-13days on market $299,000 Active 56 DOM
-
2026-06-10days on market $299,000 Active 54 DOM
-
2026-06-09days on market $299,000 Active 53 DOM
-
2026-06-08days on market $299,000 Active 52 DOM
-
2026-06-07days on market $299,000 Active 51 DOM
-
2026-06-03days on market $299,000 Active 47 DOM
-
2026-06-02days on market $299,000 Active 46 DOM
-
2026-06-01pricedays on market $299,000 Active 45 DOM
-
2026-05-31days on market $310,000 Active 44 DOM
-
2026-05-30days on market $310,000 Active 43 DOM
-
2026-04-30price $310,000 465-char remark
Show marketing remark (465 chars)
A beautiful 3 bedroom, 2 bath, 2 car garage, located in Lone Star Trails. This home features an open concept floor plan with tall ceilings, granite counters throughout, water softener, tile floors in the living areas and bathrooms, carpet in the bedrooms, all bedroom closets have built ins for storage/organization. Low maintenance desert-scaped front yard, a nice sized back yard for your family get togethers. Call your favorite Realtor to schedule your showing!
-
2026-04-17$320,000 Active 465-char remark
Show marketing remark (465 chars)
A beautiful 3 bedroom, 2 bath, 2 car garage, located in Lone Star Trails. This home features an open concept floor plan with tall ceilings, granite counters throughout, water softener, tile floors in the living areas and bathrooms, carpet in the bedrooms, all bedroom closets have built ins for storage/organization. Low maintenance desert-scaped front yard, a nice sized back yard for your family get togethers. Call your favorite Realtor to schedule your showing!
ⓘ Source: listings_history table (triggers on properties + properties_extension) + one-shot
backfill from property_details.listing_events for pre-trigger history.
Tax reassessment forecast TX · Resets to sale price
- Current annual tax
- $4,435 · $370/mo
- Projected year-2 tax
- $5,472 · $456/mo
- Expected delta
- +$1,036/yr (+$86/mo · 23.4%)
ⓘ Screening estimate from a state-policy table — verify with the county assessor before closing.
Climate risk First Street
- Flood 1/10 Low FEMA zone X · 0% chance over 30 yrs
- Wildfire 8/10 Severe
- Heat 6/10 Major 6 d/yr ≥102°F today · 19 d/yr by 30 yrs out
- Wind 2/10 Low 3% chance of damaging wind over 30 yrs
- Air quality 1/10 Low 0 unhealthy d/yr today · 0 by 30 yrs out
Nearby sold comps map
Loading sold comps map…
Walkable amenities ~0.75 mi
Loading nearby amenities…
Taxation est. · year 1
- Rental income
- $31,201
- − Mortgage interest
- −$16,749
- − Property taxes
- −$4,435
- − Insurance
- −$1,495
- − Repairs & maintenance
- −$2,496
- − Management
- −$2,496
- − HOA
- −$300
- − Depreciation
- −$8,698
- Taxable loss
- −$5,468
- Est. tax savings @ 24.0%
- +$1,312
- After-tax cash flow
- $915/yr
For passive investors: Depreciation is non-cash, so a rental often shows a tax loss while cash-flowing — sheltering income. Rental losses are passive: they offset passive income freely, and up to $25,000/yr can offset ordinary (W-2) income if you actively participate and your MAGI is under $100k (phasing out to $0 by $150k); unused losses carry forward. On sale, claimed depreciation is recaptured at up to 25%, and gains may owe capital-gains tax (a 1031 exchange can defer both). Figures are a year-1 estimate at your 24.0% rate — not tax advice; consult a CPA.
Schools (NCES district)
- District
- Midland ISD
- NCES district ID
- 4830570
- Math proficiency
- 34% ▼ -7.00%
- Reading proficiency
- 36% ▬ 0.00%
- Median HH income
- $63,457
- Composite
- 31.63/100
- National rank
- #5938
- State rank
- #477 of 826 in TX
Livability — Midland
- Score
- 79/100
- State rank
- #57
- US rank
- #2192
Category grades
Schools grade is shown separately in the Schools card above.
Census & demographics
- Census place
- Midland, TX
- County
- Midland County · 168,494 people
- City population
- 168,494
- Metro
- Midland, TX
- Population (ZIP)
- 46,653
- Household income
- $105,310
- Rent vs Own
- Severe rent burden
- 1557.0
Population outlook (Midland County) Hauer SSP2
- Today (2025)
- 220,895 people
- By 2030
- 253,667 · +14.8%
- By 2040
- 325,498 · +47.4%
- By 2050
- 404,168 · +83.0%
- By 2075
- 609,802 · +176.1%
- By 2100
- 760,172 · +244.1%
Race, ethnicity, and origin ACS 2023
- Neighborhood character
- Diverse neighborhood (Simpson 0.60)
- Race & ethnicity
- White 46% Hispanic / Latino 43% Two or more races 20% Black 8%
- Hispanic origin (detail)
- Mexican 35%
- Common ancestry
- Slovak 1% Lithuanian 1% Serbian 1%
- Foreign-born
- 10% · Canada, Jamaica
- Languages at home
- 72% English-only · Spanish 24% Arabic 1%
Political lean MEDSL · Midland
- 2024 margin
- Solid R (+60.5) · D 19.3% · R 79.8%
- 2008→2024 swing
- -3.3pp toward R · 2008: -57.3pp · 2024: -60.5pp
- All cycles
- 2024: R+60.5 2020: R+56.6 2016: R+55.2 2012: R+61.5 2008: R+57.3
Not yet ingested
- Civics
- —
Market trends
- HPI YoY
- ▼ -300.44%
- Current HPI
- 207.2904
- Rent YoY
- ▲ 2.56%
- Metro
- Midland, TX
- State GDP YoY
- ▲ 3.95%
- F500 in state
- 110
Industry mix (Fortune 500 HQ in TX)
| Industry | F500 HQs | Revenue |
|---|---|---|
| Energy | 16 | $1,198B |
|
||
| Technology | 5 | $198B |
|
||
| Engineering / Construction | 4 | $72B |
|
||
| Energy Services | 3 | $60B |
|
||
| Utilities | 3 | $41B |
|
||
| Healthcare | 2 | $330B |
|
||
Price history
-3.1% since first listed4 events — show timeline
- 2026-04-30 Price Changed $310,000 ODMLS
- 2026-04-30 Price Changed $310,000 PBBOR
- 2026-04-17 Listed $320,000 PBBOR
- 2026-04-17 Listed $320,000 ODMLS
Property tax history
+30.2%/yrLatest (2025): $4,435 · -4.3% YoY. Source: county tax records.
Cash-flow waterfall
monthlySold comps — $/sqft
last 12 mo · ≤1 miLoading sold comps…