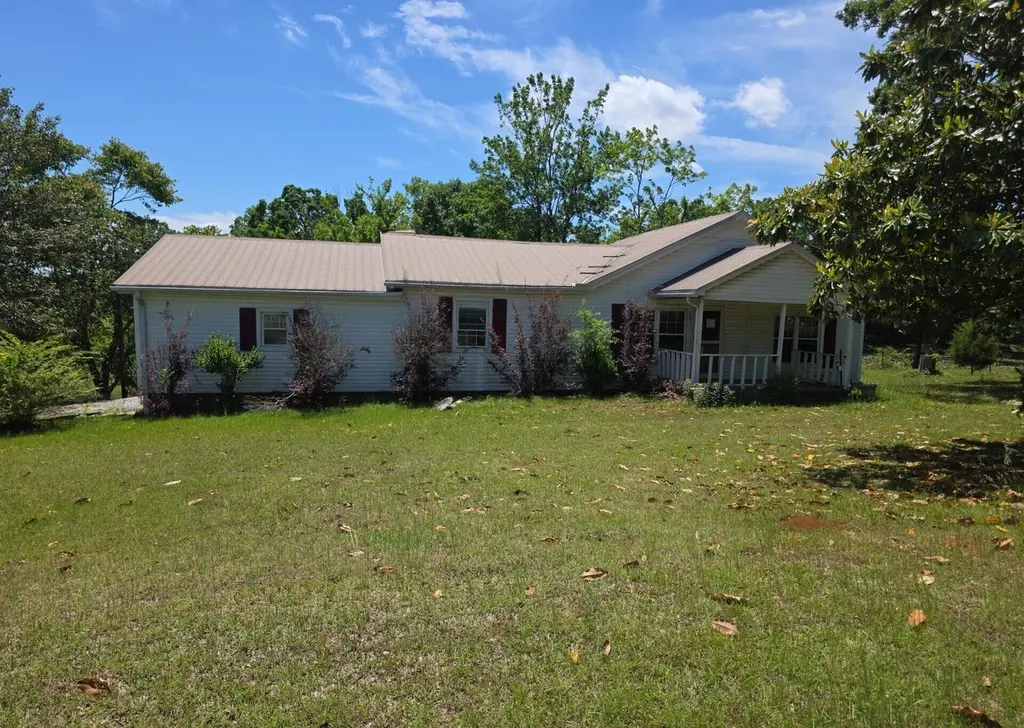
1421 County Road 232 · Chalybeate, MS
Flood risk 1/10 · Minimal
- FEMA flood zone
- X (unshaded)
- Chance of flooding over 30 yrs
- 0.0%
- Est. flood insurance / yr
- $507 – $1,088
Fire risk 6/10 · Moderate
- Est. fire insurance / yr
- $1,241 – $2,305
Heat risk 6/10 · Moderate
- Hot days now (above 109°F)
- 7 days/yr
- Hot days in 30 yrs
- 20 days/yr
Wind risk 5/10 · Moderate
- Chance of severe wind over 30 yrs
- 23.0%
Air-quality risk 1/10 · Minimal
- Unhealthy air days now
- 0 days/yr
- Unhealthy air days in 30 yrs
- 0 days/yr
Risk factors via First Street. Map © Google.
Why this score? — see what drove the B grade
The composite is a weighted blend of 9 inputs, each scored 0–100. Each bar is that input's sub-score; the figure is the points it added to the 100-point composite (weight × sub-score).
- Cash flow +30.0/30.0
- 1% rule +10.0/10.0
- DSCR +10.0/10.0
- ARV discount +7.5/15.0
- Appreciation +5.5/10.0
- Schools +2.7/10.0
- Rent growth +2.5/5.0
- Livability +2.5/5.0
- Condition / age +2.5/5.0
$55,900
🖨 Deal sheet 📄 Offer letter ✓ Due diligence
Listing remarks MLS
Updated farm house. Has New septic, Central H/A, Wiring & Box, Insulation, Vapor barriers, Fans, Blinds and Fence! Country Living could not be better! Priced to sell!
Key facts
- Pond view
- 0.48 acre lot
- Built 1981
Tags
Property features AI
Exterior
- Parking: Attached carport
- Home design: Residential single-family home
- Exterior features: Lot approximately 0.48 acres; Lot dimensions about 100 x 209; Directions: Take 232 across from barn; property will be on left
Interior
- Bathrooms: 1 full bathroom; 1 half bathroom
- Interior features: 6 total rooms
Neighborhood map
What this means for you Summary
Snapshot
- This is a 2-bed/1.5-bath single-family listed at $56k.
Deal economics
- At list price, monthly cash flow is $447 ($5k/yr) — positive.
- The deal already cash-flows at list — no discount required.
- Meets the 1% rule at list price ($1k rent vs $56k).
- Recommended offer: $54k (3.0% below list) — sets the bar for market timing.
Location & tenants
- Location reads: area grade B — affects rentability + tenant quality, not the cash-flow math above.
- North Tippah School District (rural): math 31% / reading 36% proficiency, ranked #59 of 130 in MS (top 45%) — families likely to look elsewhere, expect single-tenant / working-renter base with shorter leases; 62% free/reduced lunch — lower-income household profile, screen leases tightly.
- Market conditions: 13 active listings in the ZIP; 10 units permitted in Tippah County in 2024 (0 in 5+ unit buildings).
Forward outlook
- In year one you build about $997 of equity ($386 loan paydown + $611 appreciation (1.1% local appreciation)).
- Tippah County population projected to shrink 9% by 2050 — rents likely to lag national; underwrite the cash flow, not the appreciation.
- At projected returns (1.1% appreciation + 3.0% rent growth), your $16k cash investment doubles in ~3 years — after that, you're playing with house money.
Negotiation context
- It's been on market 36 days — a 3% lower offer ($54k) is reasonable based on typical stale-listing flexibility.
- 2 sale attempts since 10y ago with the ask held roughly flat each time — persistent listings suggest the price (not the market) is what's stuck; bring a comps-based counter.
Risks & watch-outs
- Climate carrying-cost: moderate wind risk, 23% chance of damaging wind over 30y; major wildfire risk; extreme-heat days projected 7→20/yr by 2055 (HVAC capex compounding) — expect insurance premiums to compound above CPI over the hold.
Questions for the listing agent
- It's been on market 36 days. Have you received any prior offers? Is the seller open to a 3% concession, seller financing, or rate buy-down credit?
- Is there a deadline driving the sale (1031 exchange, divorce, estate, relocation)? That informs how much negotiation room exists.
- What's the average days-on-market for RENTAL listings here right now (not sales)? A rising rental-DOM trend means longer vacancies and softer asking-rent achievability than the comps imply.
- What's the recent tenant-quality profile in this submarket — average credit score on applications, eviction rate, late-payment / NSF rate, and stable-employment percentage? A property-management company in the area should have these aggregated.
- How much new for-sale + rental construction is in the pipeline within 1–3 miles? Heavy new supply typically softens prices + rents 12–24 months out; constrained supply supports both.
Investment metrics
- 1% rule
- 1.82% ✓
- Cap rate
- 15.88%
- Cash-on-cash
- 34.25%
- DSCR
- 2.52
- GRM
- 4.6
CMA / ARV
No comps found within radius.
Projected returns pro-forma
1.09% appreciation · 3.0% rent growth · sell at horizon
- IRR
- 36.8%
- Equity multiple
- 2.90×
- Total profit
- $29,753
- Equity at exit
- $19,354
- IRR
- 38.9%
- Equity multiple
- 5.69×
- Total profit
- $73,349
- Equity at exit
- $25,931
Cash invested: $15,652 (down + closing). Projections, not guarantees.
Landlord ↔ Tenant lean methodology
- Overall (STATE)
- 90 Strongly Landlord-Friendly
- State Mississippi
- 90 Strongly Landlord-Friendly · R+11
- County
- — inherits STATE
- City
- — inherits STATE
ZIP-level market 38674
- Home prices YoY
- 1.0%
- Active inventory
- 13
- Price-to-rent
- 4.6×
Monthly cashflow live
- Estimated rent
- $1,017 medium interval (Pro) →
- Mortgage (P&I)
- −$293
- Tax from tax record
- −$40 /mo · $479/yr
- Insurance
- −$23
- HOA
- −$0
- Vacancy / Maint / Mgmt
- −$213
- Net cashflow
- $447
Break-even live
UW: 25.0% down · 7.5% · 30yr · 1.5% tax · 5.0% vac · 8.0% maint · 8.0% mgmt
Financing live
Cash to close
- Down payment
- $13,975
- Closing costs
- $1,677
- Reserves months
- —
- Total cash needed
- —
Loan-product check · same deal, 3 products live
Conventional
25% down · 7.5% · 30yr
- Down + closing
- —
- Monthly P&I
- —
- Monthly cashflow
- —
- DSCR
- —
- Eligible?
- —
Personal DTI + credit; lowest rate.
DSCR
20% down · 8.5% · 30yr
- Down + closing
- —
- Monthly P&I
- —
- Monthly cashflow
- —
- DSCR
- —
- Eligible?
- —
No personal income docs; deal must DSCR.
Hard money
10% down · 12.0% · 12mo
- Down + closing
- —
- Monthly P&I
- —
- Monthly cashflow
- —
- DSCR
- —
- Eligible?
- —
Short-term bridge; refi at stabilization.
Listing history 19 events
-
2026-06-18days on market $55,900 Active 36 DOM
-
2026-06-17days on market $55,900 Active 35 DOM
-
2026-06-16days on market $55,900 Active 34 DOM
-
2026-06-15days on market $55,900 Active 33 DOM
-
2026-06-13days on market $55,900 Active 31 DOM
-
2026-06-12days on market $55,900 Active 30 DOM
-
2026-06-09days on market $55,900 Active 27 DOM
-
2026-06-08days on market $55,900 Active 26 DOM
-
2026-06-07days on market $55,900 Active 25 DOM
-
2026-06-07days on market $55,900 Active 24 DOM
-
2026-06-04days on market $55,900 Active 21 DOM
-
2026-06-02days on market $55,900 Active 20 DOM
-
2026-06-01days on market $55,900 Active 19 DOM
-
2026-05-31days on market $55,900 Active 18 DOM
-
2026-05-13$55,900 Active 700-char remark
-
2016-10-28soldstatus 172-char remark
Show marketing remark (172 chars)
Updated farm house. Has New septic, Central H/A, Wiring & Box, Insulation, Vapor barriers, Fans, Blinds and Fence! Country Living could not be better! Priced to sell!
-
2016-07-01$75,000 172-char remark
Show marketing remark (172 chars)
Updated farm house. Has New septic, Central H/A, Wiring & Box, Insulation, Vapor barriers, Fans, Blinds and Fence! Country Living could not be better! Priced to sell!
-
2008-03-13soldstatus
-
2002-06-18soldstatus
ⓘ Source: listings_history table (triggers on properties + properties_extension) + one-shot
backfill from property_details.listing_events for pre-trigger history.
Tax reassessment forecast MS · Resets to sale price
- Current annual tax
- $479 · $40/mo
- Projected year-2 tax
- $479 · $40/mo
- Expected delta
- $0/yr ($0/mo · 0.0%)
ⓘ Screening estimate from a state-policy table — verify with the county assessor before closing.
Climate risk First Street
- Flood 1/10 Low FEMA zone X (unshaded) · 0% chance over 30 yrs
- Wildfire 6/10 Major
- Heat 6/10 Major 7 d/yr ≥109°F today · 20 d/yr by 30 yrs out
- Wind 5/10 Major 23% chance of damaging wind over 30 yrs
- Air quality 1/10 Low 0 unhealthy d/yr today · 0 by 30 yrs out
Nearby sold comps map
Loading sold comps map…
Walkable amenities ~0.75 mi
Loading nearby amenities…
Taxation est. · year 1
- Rental income
- $12,199
- − Mortgage interest
- −$3,131
- − Property taxes
- −$479
- − Insurance
- −$280
- − Repairs & maintenance
- −$976
- − Management
- −$976
- − Depreciation
- −$1,626
- Taxable income
- $4,732
- Est. tax owed @ 24.0%
- −$1,136
- After-tax cash flow
- $4,226/yr
For passive investors: Depreciation is non-cash, so a rental often shows a tax loss while cash-flowing — sheltering income. Rental losses are passive: they offset passive income freely, and up to $25,000/yr can offset ordinary (W-2) income if you actively participate and your MAGI is under $100k (phasing out to $0 by $150k); unused losses carry forward. On sale, claimed depreciation is recaptured at up to 25%, and gains may owe capital-gains tax (a 1031 exchange can defer both). Figures are a year-1 estimate at your 24.0% rate — not tax advice; consult a CPA.
Schools (NCES district)
- District
- North Tippah School District
- NCES district ID
- 2803270
- Math proficiency
- 31% ▼ -14.00%
- Reading proficiency
- 36% ▼ -7.00%
- Median HH income
- $32,951
- Composite
- 27.46/100
- National rank
- #6962
- State rank
- #59 of 130 in MS
Livability — Chalybeate
No livability data for this city. (Only ~50 U.S. cities are tracked.)
Census & demographics
- Population (ZIP)
- 1,430
Population outlook (Tippah County) Hauer SSP2
- Today (2025)
- 21,864 people
- By 2030
- 21,575 · -1.3%
- By 2040
- 20,850 · -4.6%
- By 2050
- 19,953 · -8.7%
- By 2075
- 17,257 · -21.1%
- By 2100
- 13,705 · -37.3%
Race, ethnicity, and origin ACS 2023
- Neighborhood character
- Majority White (61%)
- Race & ethnicity
- White 61% Black 37% Two or more races 2%
Political lean MEDSL · Tippah
- 2024 margin
- Solid R (+67.1) · D 16.1% · R 83.2%
- 2008→2024 swing
- -22.8pp toward R · 2008: -44.4pp · 2024: -67.1pp
- All cycles
- 2024: R+67.1 2020: R+60.6 2016: R+58.8 2012: R+48.5 2008: R+44.4
Not yet ingested
- Civics
- —
Market trends
- HPI YoY
- ▲ 1.09%
- Current HPI
- 106.8398
- Rent YoY
- —
- Metro
- —
- State GDP YoY
- —
- F500 in state
- 0
Price history
-25.5% since first listed5 events — show timeline
- 2026-05-13 Listed $55,900 NEMSBD
- 2016-10-28 Sold (MLS) — NEMSBD
- 2016-07-01 Listed $75,000 NEMSBD
- 2008-03-13 Sold (Public Records) — Public Records
- 2002-06-18 Sold (Public Records) — Public Records
Property tax history
+3.4%/yrLatest (2025): $479 · +2.1% YoY. Source: county tax records.
Cash-flow waterfall
monthlySold comps — $/sqft
last 12 mo · ≤1 miLoading sold comps…