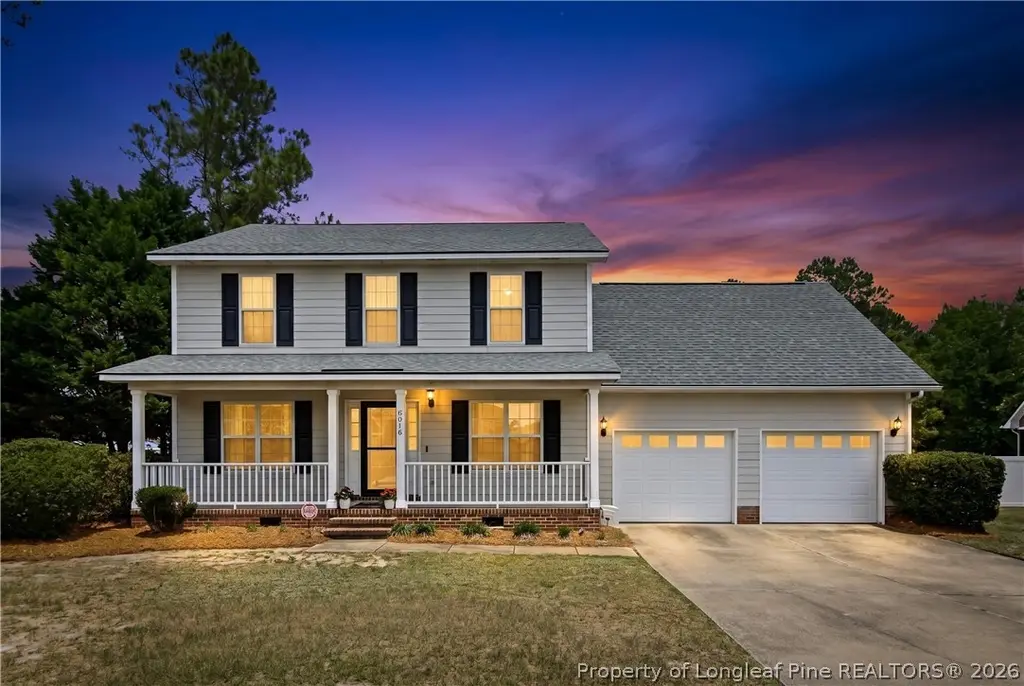
6016 Woodspring Dr · Hope Mills, NC
Flood risk 1/10 · Minimal
- FEMA flood zone
- X (unshaded)
- Chance of flooding over 30 yrs
- 0.0%
- Est. flood insurance / yr
- $507 – $1,088
Fire risk 6/10 · Moderate
- Est. fire insurance / yr
- $906 – $1,684
Heat risk 7/10 · Major
- Hot days now (above 106°F)
- 7 days/yr
- Hot days in 30 yrs
- 16 days/yr
Wind risk 6/10 · Moderate
- Chance of severe wind over 30 yrs
- 77.0%
Air-quality risk 1/10 · Minimal
- Unhealthy air days now
- 0 days/yr
- Unhealthy air days in 30 yrs
- 0 days/yr
Risk factors via First Street. Map © Google.
Why this score? — see what drove the D- grade
The composite is a weighted blend of 9 inputs, each scored 0–100. Each bar is that input's sub-score; the figure is the points it added to the 100-point composite (weight × sub-score).
- ARV discount +11.5/15.0
- Cash flow +7.8/30.0
- Rent growth +3.6/5.0
- Livability +3.4/5.0
- Schools +3.1/10.0
- Condition / age +2.5/5.0
- 1% rule +2.0/10.0
- DSCR +1.8/10.0
- Appreciation +0.0/10.0
$295,000
🖨 Deal sheet 📄 Offer letter ✓ Due diligence
Listing remarks
Nestled in a beautifully developed, tucked-away neighborhood, this stunning 4-bedroom, 3-bathroom, two-story home offers the perfect blend of peaceful privacy and unbeatable convenience. As you step from the charming, large front porch, you walk into beautiful hardwood floors that immediately welcome you into a layout designed for modern living. The main floor features a spacious formal dining room for entertaining, a flexible bonus room ideal for a home office or playroom, and a cozy family room centered around a warm fireplace. The heart of the home features a bright kitchen with a lovely breakfast area, while the first floor also boasts a beautifully remodeled bathroom complete with a mo
Key facts
- Bright kitchen
- Formal dining room
- Remodeled bathroom
Tags
Property features AI
Finance
- Other: Property listed by EXP REALTY LLC
Exterior
- Parking: Attached garage with 2 covered spaces (2-car)
- Utilities: Public water; Public sewer
- Home design: Single family residence; Two levels
- Construction: Construction materials: Unknown
- Exterior features: Shed(s); Subdivision: SOUTH HAMPTON AT TIMBERLAKE; Zoned R10 - Residential District
Interior
- Kitchen: Refrigerator
- Bedrooms: Total of 7 rooms (bedroom count not specified)
- Flooring: Carpet; Hardwood; Vinyl
- Bathrooms: 3 full bathrooms
- Heating & cooling: Heat pump (heating present)
- Interior features: Refrigerator included; Gas log fireplace (1)
- Laundry & utility: Crawl space foundation
Neighborhood map
What this means for you Summary
Snapshot
- This is a 3-bed/3.0-bath single-family listed at $295k.
Deal economics
- At list price, monthly cash flow is $-333 ($-4k/yr) — negative.
- To cash-flow at today's rent, offer at most $236k (19.9% below list).
- To meet the 1% rule (rent ≥ 1% of price), the offer needs to be $207k (29.7% below list).
- Recommended offer: $207k (29.7% below list) — sets the bar for 1% rule.
Location & tenants
- Location reads 67/100 on livability (#234 in NC) — a middle-class / working-renter tenant base. Strengths: cost of living A+, housing A+, health & safety B+; Watch: crime D-, amenities F, commute F.
- Cumberland County Schools (urban): math 32% / reading 41% proficiency, ranked #126 of 178 in NC (top 71%) — families likely to look elsewhere, expect single-tenant / working-renter base with shorter leases.
- Zoned schools: Hope Mills Middle (math 27% / reading 34%, grade F, #331 of 475 statewide, top 70%, 514 students, 99% FRL); South View High (math 60% / reading 43%, grade D+, #299 of 535 statewide, top 56%, 1,502 students, 66% FRL) — zoned schools average 83% FRL vs 55% district-wide (28 pts higher); higher-poverty schools than district average — tighter screening recommended.
- Market conditions: Rents rising fast (+4.3%/yr); 317 active listings in the ZIP; 8 comparable units currently listed for rent nearby; rentals leasing fast (median 14d on market — plan ~1-2 weeks tenant-placement turnaround); 1,125 units permitted in Cumberland County in 2024 (104 in 5+ unit buildings).
- This rent runs 38% of the median local income ($66k/yr) — at the standard rent-burdened threshold; future hikes will face affordability resistance.
Forward outlook
- Local home prices are declining (-3.0%/yr); year-one equity from $2k of loan paydown is wiped out by about $9k of value loss. Plan a longer hold.
Negotiation context
- Only 6 days on market — expect competitive offers; lowballing is unlikely to land.
Risks & watch-outs
- Climate carrying-cost: major wind risk, 77% chance of damaging wind over 30y; major wildfire risk; extreme-heat days projected 7→16/yr by 2055 (HVAC capex compounding) — expect insurance premiums to compound above CPI over the hold.
Questions for the listing agent
- What do current leases actually rent for vs. the listed asking? Can we see a recent rent roll and the last 12 months of T-12 income?
- Is there a deadline driving the sale (1031 exchange, divorce, estate, relocation)? That informs how much negotiation room exists.
- Schools are D-rated, which usually means shorter tenancies and higher turnover. Who's the typical renter profile here, and what's been the actual vacancy rate?
- Crime grade is D in this area — have there been break-ins, vandalism, or insurance claims at this property in the last 3 years? What carrier currently insures it and at what premium?
- The area grade is low — what's the realistic commute time and amenity access for the typical tenant pool here? Any planned neighborhood developments (good or bad) we should know about?
- What's the average days-on-market for RENTAL listings here right now (not sales)? A rising rental-DOM trend means longer vacancies and softer asking-rent achievability than the comps imply.
- What's the recent tenant-quality profile in this submarket — average credit score on applications, eviction rate, late-payment / NSF rate, and stable-employment percentage? A property-management company in the area should have these aggregated.
- How much new for-sale + rental construction is in the pipeline within 1–3 miles? Heavy new supply typically softens prices + rents 12–24 months out; constrained supply supports both.
Investment metrics
- 1% rule
- 0.70% ✗
- Cap rate
- 4.94%
- Cash-on-cash
- -4.84%
- DSCR
- 0.78
- GRM
- 11.8
CMA / ARV
- ARV (on-the-fly)
- $323,424
- Comps found
- 12
Show comp detail 12 sales within ~0.75 mi
| Address | Dist | Beds/Ba | Sqft | Sold | Price | $/sf | Match |
|---|---|---|---|---|---|---|---|
| 3931 Dickens Ave | 0.22mi | 4/2.5 (+1) | 2,210 (-2%) | 15mo | $325,000 | $147 | 68 |
| 4005 Dickens Ave | 0.16mi | 3/2.5 | 1,948 (-13%) | 12mo | $305,000 | $157 | 58 |
| 5019 Woodspring Dr | 0.20mi | 4/3.0 (+1) | 1,931 (-14%) | 6mo | $265,000 | $137 | 58 |
| 1908 Sir Michael Dr | 0.28mi | 3/2.5 | 1,939 (-14%) | 10mo | $285,000 | $147 | 54 |
| 4013 Shire St | 0.67mi | 4/2.5 (+1) | 2,193 (-2%) | 7mo | $315,000 | $144 | 52 |
| 2119 Queen Elizabeth Ln | 0.44mi | 3/2.5 | 1,994 (-11%) | 8mo | $288,000 | $144 | 52 |
| 1604 Citation Ct | 0.73mi | 3/2.5 | 2,285 (+2%) | 14mo | $319,000 | $140 | 49 |
| 1617 Citation Ct | 0.72mi | 4/3.0 (+1) | 2,137 (-5%) | 7mo | $305,000 | $143 | 47 |
| 2108 Sir Michael Dr | 0.44mi | 4/2.5 (+1) | 1,984 (-12%) | 9mo | $285,000 | $144 | 45 |
| 2107 Queen Elizabeth Ln | 0.40mi | 4/2.5 (+1) | 1,987 (-12%) | 12mo | $282,000 | $142 | 45 |
| 1624 Citation Ct | 0.67mi | 4/3.0 (+1) | 2,429 (+8%) | 10mo | $320,000 | $132 | 41 |
| 4352 Jockey Whip Ln | 0.57mi | 4/3.0 (+1) | 2,481 (+10%) | 13mo | $390,000 | $157 | 40 |
Match score weights: distance 35% · size 25% · config 20% · recency 20%. Top-matched comps best support the ARV.
Projected returns pro-forma
-3.0% appreciation · 4.28% rent growth · sell at horizon
- IRR
- -23.2%
- Equity multiple
- 0.20×
- Total profit
- $-66,304
- Equity at exit
- $43,985
- IRR
- -14.9%
- Equity multiple
- 0.11×
- Total profit
- $-73,674
- Equity at exit
- $25,506
Cash invested: $82,600 (down + closing). Projections, not guarantees.
Landlord ↔ Tenant lean methodology
- Overall (STATE)
- 85 Strongly Landlord-Friendly
- State North Carolina
- 85 Strongly Landlord-Friendly · R+3
- County
- — inherits STATE
- City
- — inherits STATE
ZIP-level market 28348
- Home prices YoY
- -14.0%
- Rents YoY
- 4.3%
- Active inventory
- 317
- Price-to-rent
- 11.8×
Monthly cashflow live
- Estimated rent
- $2,075 high interval (Pro) →
- Mortgage (P&I)
- −$1,547
- Tax from tax record
- −$302 /mo · $3,622/yr
- Insurance
- −$123
- HOA
- −$0
- Vacancy / Maint / Mgmt
- −$436
- Net cashflow
- $-333
Break-even live
UW: 25.0% down · 7.5% · 30yr · 1.5% tax · 5.0% vac · 8.0% maint · 8.0% mgmt
Financing live
Cash to close
- Down payment
- $73,750
- Closing costs
- $8,850
- Reserves months
- —
- Total cash needed
- —
Loan-product check · same deal, 3 products live
Conventional
25% down · 7.5% · 30yr
- Down + closing
- —
- Monthly P&I
- —
- Monthly cashflow
- —
- DSCR
- —
- Eligible?
- —
Personal DTI + credit; lowest rate.
DSCR
20% down · 8.5% · 30yr
- Down + closing
- —
- Monthly P&I
- —
- Monthly cashflow
- —
- DSCR
- —
- Eligible?
- —
No personal income docs; deal must DSCR.
Hard money
10% down · 12.0% · 12mo
- Down + closing
- —
- Monthly P&I
- —
- Monthly cashflow
- —
- DSCR
- —
- Eligible?
- —
Short-term bridge; refi at stabilization.
Rent comps 8 comps
| Address | Beds | Baths | Sqft | Rent | $/sqft | DOM | Units | Dist |
|---|---|---|---|---|---|---|---|---|
| 5959 Rehoboth Rd Hope Mills, NC | 3.0 | 2.0 | 1667 | $1,795 | $1.08 | 13d | 1 | 0.42mi |
| 3766 Colonial Cv Hope Mills, NC | 3.0 | 1.5 | 1475 | $1,445 | $0.98 | 13d | 1 | 0.56mi |
| 3541 Rittenour Dr Hope Mills, NC | 3.0 | 2.0 | 1552 | $1,825 | $1.18 | 13d | 1 | 0.88mi |
| 3511 Birchfield Ct Fayetteville, NC | 2.0–3.0 | 2.0 | 1270 | $1,685 | $1.33 | 13d | 5 | 0.99mi |
| 3541 Castlefield Ln Fayetteville, NC | 4.0 | 3.0 | 2858 | $2,650 | $0.93 | 23d | 1 | 1.13mi |
| 4113 Saint Ives Ct Fayetteville, NC | 4.0 | 3.0 | 2750 | $2,495 | $0.91 | 23d | 1 | 1.24mi |
| 4032 Newgate St Fayetteville, NC | 4.0 | 2.5 | 2209 | $2,750 | $1.24 | 23d | 1 | 1.39mi |
| 6258 Stoney Point Loop Fayetteville, NC | 3.0 | 2.5 | 1799 | $2,300 | $1.28 | 13d | 1 | 1.47mi |
Listing history 6 events
-
2026-06-18days on market $295,000 Active 6 DOM
-
2026-06-17days on market $295,000 Active 5 DOM
-
2026-06-16days on market $295,000 Active 4 DOM
-
2026-06-15days on market $295,000 Active 3 DOM
-
2026-06-13remarks 699-char remark
-
2026-06-13$295,000 Active 1 DOM
ⓘ Source: listings_history table (triggers on properties + properties_extension) + one-shot
backfill from property_details.listing_events for pre-trigger history.
Tax reassessment forecast NC · Resets to sale price
- Current annual tax
- $3,622 · $302/mo
- Projected year-2 tax
- $3,622 · $302/mo
- Expected delta
- $0/yr ($0/mo · 0.0%)
ⓘ Screening estimate from a state-policy table — verify with the county assessor before closing.
Climate risk First Street
- Flood 1/10 Low FEMA zone X (unshaded) · 0% chance over 30 yrs
- Wildfire 6/10 Major
- Heat 7/10 Severe 7 d/yr ≥106°F today · 16 d/yr by 30 yrs out
- Wind 6/10 Major 77% chance of damaging wind over 30 yrs
- Air quality 1/10 Low 0 unhealthy d/yr today · 0 by 30 yrs out
Nearby sold comps map
Loading sold comps map…
Walkable amenities ~0.75 mi
Loading nearby amenities…
Taxation est. · year 1
- Rental income
- $24,895
- − Mortgage interest
- −$16,525
- − Property taxes
- −$3,622
- − Insurance
- −$1,475
- − Repairs & maintenance
- −$1,992
- − Management
- −$1,992
- − Depreciation
- −$8,582
- Taxable loss
- −$9,291
- Est. tax savings @ 24.0%
- +$2,230
- After-tax cash flow
- $-1,764/yr
For passive investors: Depreciation is non-cash, so a rental often shows a tax loss while cash-flowing — sheltering income. Rental losses are passive: they offset passive income freely, and up to $25,000/yr can offset ordinary (W-2) income if you actively participate and your MAGI is under $100k (phasing out to $0 by $150k); unused losses carry forward. On sale, claimed depreciation is recaptured at up to 25%, and gains may owe capital-gains tax (a 1031 exchange can defer both). Figures are a year-1 estimate at your 24.0% rate — not tax advice; consult a CPA.
Schools (NCES district)
- District
- Cumberland County Schools
- NCES district ID
- 3700011
- Math proficiency
- 32% ▼ -2.00%
- Reading proficiency
- 41% ▼ -1.00%
- Median HH income
- $44,168
- Composite
- 31.0/100
- National rank
- #6096
- State rank
- #126 of 178 in NC
Livability — Hope Mills
- Score
- 67/100
- State rank
- #234
- US rank
- #10761
Category grades
Schools grade is shown separately in the Schools card above.
Census & demographics
- Census place
- Hope Mills, NC
- County
- Cumberland County · 265,314 people
- City population
- 39,196
- Metro
- Fayetteville, NC
- Population (ZIP)
- 39,196
- Household income
- $66,129
- Rent vs Own
- Severe rent burden
- 746.0
Population outlook (Cumberland County) Hauer SSP2
- Today (2025)
- 330,855 people
- By 2030
- 333,523 · +0.8%
- By 2040
- 335,583 · +1.4%
- By 2050
- 335,325 · +1.4%
- By 2075
- 342,853 · +3.6%
- By 2100
- 340,698 · +3.0%
Race, ethnicity, and origin ACS 2023
- Neighborhood character
- Diverse neighborhood (Simpson 0.67)
- Race & ethnicity
- White 49% Black 27% Hispanic / Latino 13% Two or more races 11% Asian 2% Native American 2%
- Hispanic origin (detail)
- Mexican 4% Puerto Rican 5%
- Common ancestry
- Romanian 2% Lithuanian 1% Serbian 1%
- Foreign-born
- 5% · Canada, South Korea, Vietnam
- Languages at home
- 90% English-only · Spanish 8% Other Indo-European 1%
Political lean MEDSL · Cumberland
- 2024 margin
- D (+13.4) · D 56.1% · R 42.7% · Other 1.2%
- 2008→2024 swing
- -4.3pp toward R · 2008: 17.7pp · 2024: 13.4pp
- All cycles
- 2024: D+13.4 2020: D+16.6 2016: D+16.0 2012: D+19.7 2008: D+17.7
Not yet ingested
- Civics
- —
Market trends
- HPI YoY
- ▼ -37.14%
- Current HPI
- 228.3122
- Rent YoY
- ▲ 4.28%
- Metro
- Fayetteville, NC
- State GDP YoY
- ▲ 3.28%
- F500 in state
- 26
Industry mix (Fortune 500 HQ in NC)
| Industry | F500 HQs | Revenue |
|---|---|---|
| Financial Services | 2 | $213B |
|
||
| Retail | 2 | $95B |
|
||
| Industrial Conglomerate | 1 | $38B |
|
||
| Metals / Steel | 1 | $35B |
|
||
| Utilities | 1 | $30B |
|
||
| Industrial Machinery | 1 | $19B |
|
||
Price history
1 event — show timeline
- 2026-06-12 Listed $295,000 LPRMLS
Property tax history
+2.7%/yrLatest (2025): $3,622 · +24.0% YoY. Source: county tax records.
Cash-flow waterfall
monthlySold comps — $/sqft
last 12 mo · ≤1 miLoading sold comps…