111 South St · Bismarck, IL
Flood risk 1/10 · Minimal
- FEMA flood zone
- X (unshaded)
- Chance of flooding over 30 yrs
- 0.0%
- Est. flood insurance / yr
- $473 – $860
Fire risk 5/10 · Moderate
- Est. fire insurance / yr
- $804 – $1,492
Heat risk 3/10 · Minor
- Hot days now (above 104°F)
- 7 days/yr
- Hot days in 30 yrs
- 18 days/yr
Wind risk 2/10 · Minimal
- Chance of severe wind over 30 yrs
- 1.0%
Air-quality risk 2/10 · Minimal
- Unhealthy air days now
- 1 days/yr
- Unhealthy air days in 30 yrs
- 1 days/yr
Risk factors via First Street. Map © Google.
Why this score? — see what drove the B grade
The composite is a weighted blend of 9 inputs, each scored 0–100. Each bar is that input's sub-score; the figure is the points it added to the 100-point composite (weight × sub-score).
- Cash flow +29.4/30.0
- DSCR +10.0/10.0
- 1% rule +8.8/10.0
- ARV discount +7.5/15.0
- Appreciation +6.5/10.0
- Livability +3.1/5.0
- Rent growth +2.5/5.0
- Condition / age +2.5/5.0
- Schools +2.4/10.0
$89,900
🖨 Deal sheet 📄 Offer letter ✓ Due diligence
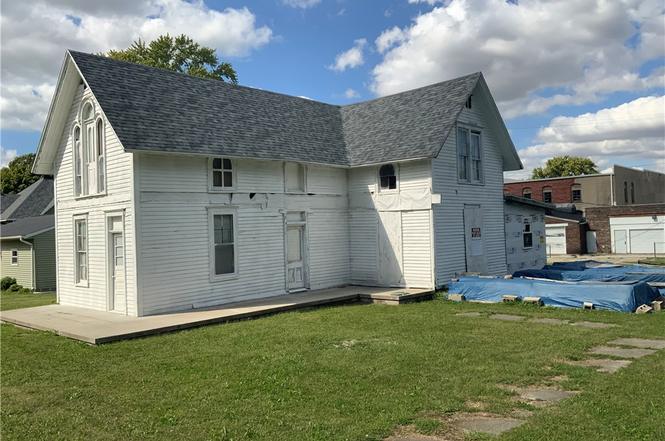
Listing remarks
Do you love history and want a renovation project? Take a look at this 1867 historically Victorian home located in Bismarck. Endless possibilities and room design with project waiting to be completed. New Roof in December of 2023, Concrete flooring ready for completion of wrap around porch. House repainted with primer coat in November of 2023. Windows repaired with new glass. New foundation and footings for new bedroom, bathroom, utility room, and entryway. Newer aeration sewer system in North yard. Installation of new A/C with electric heat for the upstairs. Call listing agent for a private tour.
Key facts
- Wrap around porch
- New foundation
- Victorian home
Tags
Property features AI
Exterior
- Utilities: Public water; Septic tank sewer
- Home design: Single-family residence; Two-story home; Wood siding exterior; R-1 zoning
- Construction: Asphalt roof
- Exterior features: Chip-and-seal road access
Interior
- Kitchen: No specific kitchen appliance details provided
- Bedrooms: Total of 5 rooms (bedrooms and living spaces combined)
- Bathrooms: 1 full bathroom
- Heating & cooling: Electric heating; Central air conditioning
- Interior features: Electric water heater; Crawl space basement
- Laundry & utility: No laundry appliance details provided
Neighborhood map
What this means for you Summary
Snapshot
- This is a 3-bed/1.0-bath other listed at $90k.
Deal economics
- At list price, monthly cash flow is $319 ($4k/yr) — positive.
- The deal already cash-flows at list — no discount required.
- Meets the 1% rule at list price ($1k rent vs $90k).
- Recommended offer: $79k (12.0% below list) — sets the bar for market timing.
Location & tenants
- Location reads 62/100 on livability (#844 in IL) — a middle-class / working-renter tenant base. Strengths: cost of living A+, housing A+; Watch: employment C-, crime D, amenities F.
- Bismarck Henning CUSD (rural): math 21% / reading 30% proficiency, ranked #287 of 620 in IL (top 46%) — low school quality limits family demand, transient renter base, plan for 1-2y turnover.
- Market conditions: 3 active listings in the ZIP; 8 units permitted in Vermilion County in 2024 (0 in 5+ unit buildings).
Forward outlook
- In year one you build about $3k of equity ($622 loan paydown + $3k appreciation (3.1% local appreciation)).
- Vermilion County population projected at -24% by 2050 — secular population decline; favor cash flow + early exit over multi-decade hold.
- At projected returns (3.1% appreciation + 3.0% rent growth), your $25k cash investment doubles in ~4 years — after that, you're playing with house money.
- By year 10, paydown + projected appreciation supports a ~$33k cash-out refi (75% LTV) — recoverable capital for the next deal without selling this one.
Negotiation context
- It's been on market 630 days — a 12% lower offer ($79k) is reasonable based on typical stale-listing flexibility.
- Current owner paid $25k; list at $90k implies a 260% gain — meaningful room to come down on a strong offer.
Risks & watch-outs
- Watch-outs: built in 1867 — expect roof / HVAC / electrical / plumbing capex.
- Climate carrying-cost: moderate wildfire risk — expect insurance premiums to compound above CPI over the hold.
Questions for the listing agent
- It's been on market 630 days. Have you received any prior offers? Is the seller open to a 12% concession, seller financing, or rate buy-down credit?
- Built in 1867 — when were the roof, HVAC, electrical panel, plumbing, and water heater last replaced?
- Why hasn't it sold? Are there any deal-killer items the seller is aware of (foundation, flood, title, zoning, code violations)?
- Is there a deadline driving the sale (1031 exchange, divorce, estate, relocation)? That informs how much negotiation room exists.
- Schools are B-rated — typically a magnet for longer-tenancy family renters. What's the average tenant stay here, and is there a school-zone premium baked into asking?
- Crime grade is D in this area — have there been break-ins, vandalism, or insurance claims at this property in the last 3 years? What carrier currently insures it and at what premium?
- What's the average days-on-market for RENTAL listings here right now (not sales)? A rising rental-DOM trend means longer vacancies and softer asking-rent achievability than the comps imply.
- What's the recent tenant-quality profile in this submarket — average credit score on applications, eviction rate, late-payment / NSF rate, and stable-employment percentage? A property-management company in the area should have these aggregated.
- How much new for-sale + rental construction is in the pipeline within 1–3 miles? Heavy new supply typically softens prices + rents 12–24 months out; constrained supply supports both.
Investment metrics
- 1% rule
- 1.38% ✓
- Cap rate
- 10.55%
- Cash-on-cash
- 15.21%
- DSCR
- 1.68
- GRM
- 6.0
CMA / ARV
No comps found within radius.
Projected returns pro-forma
3.08% appreciation · 3.0% rent growth · sell at horizon
- IRR
- 22.0%
- Equity multiple
- 2.26×
- Total profit
- $31,598
- Equity at exit
- $40,849
- IRR
- 22.9%
- Equity multiple
- 4.32×
- Total profit
- $83,577
- Equity at exit
- $63,285
Cash invested: $25,172 (down + closing). Projections, not guarantees.
Landlord ↔ Tenant lean methodology
- Overall (STATE)
- 43 Moderately Tenant-Leaning
- State Illinois
- 43 Moderately Tenant-Leaning · D+7
- County
- — inherits STATE
- City
- — inherits STATE
ZIP-level market 61814
- Home prices YoY
- 2.3%
- Active inventory
- 3
- Price-to-rent
- 6.0×
Monthly cashflow live
- Estimated rent
- $1,239 medium interval (Pro) →
- Mortgage (P&I)
- −$471
- Tax from tax record
- −$151 /mo · $1,811/yr
- Insurance
- −$37
- HOA
- −$0
- Vacancy / Maint / Mgmt
- −$260
- Net cashflow
- $319
Break-even live
UW: 25.0% down · 7.5% · 30yr · 1.5% tax · 5.0% vac · 8.0% maint · 8.0% mgmt
Financing live
Cash to close
- Down payment
- $22,475
- Closing costs
- $2,697
- Reserves months
- —
- Total cash needed
- —
Loan-product check · same deal, 3 products live
Conventional
25% down · 7.5% · 30yr
- Down + closing
- —
- Monthly P&I
- —
- Monthly cashflow
- —
- DSCR
- —
- Eligible?
- —
Personal DTI + credit; lowest rate.
DSCR
20% down · 8.5% · 30yr
- Down + closing
- —
- Monthly P&I
- —
- Monthly cashflow
- —
- DSCR
- —
- Eligible?
- —
No personal income docs; deal must DSCR.
Hard money
10% down · 12.0% · 12mo
- Down + closing
- —
- Monthly P&I
- —
- Monthly cashflow
- —
- DSCR
- —
- Eligible?
- —
Short-term bridge; refi at stabilization.
Listing history 19 events
-
2026-06-19days on market $89,900 Active 630 DOM
-
2026-06-18days on market $89,900 Active 629 DOM
-
2026-06-17days on market $89,900 Active 628 DOM
-
2026-06-16days on market $89,900 Active 627 DOM
-
2026-06-15days on market $89,900 Active 626 DOM
-
2026-06-14days on market $89,900 Active 624 DOM
-
2026-06-12days on market $89,900 Active 623 DOM
-
2026-06-09days on market $89,900 Active 620 DOM
-
2026-06-08days on market $89,900 Active 619 DOM
-
2026-06-07days on market $89,900 Active 618 DOM
-
2026-06-05days on market $89,900 Active 615 DOM
-
2026-06-02days on market $89,900 Active 613 DOM
-
2026-06-01days on market $89,900 Active 612 DOM
-
2026-05-31days on market $89,900 Active 611 DOM
-
2026-05-30days on market $89,900 Active 610 DOM
-
2025-11-20price $89,900
-
2025-05-01price $117,000
-
2024-09-26$119,000 Active
-
2002-07-29soldstatus $25,000
ⓘ Source: listings_history table (triggers on properties + properties_extension) + one-shot
backfill from property_details.listing_events for pre-trigger history.
Tax reassessment forecast IL · Partial reset (capped growth)
- Current annual tax
- $1,811 · $151/mo
- Projected year-2 tax
- $1,926 · $160/mo
- Expected delta
- +$115/yr (+$10/mo · 6.4%)
ⓘ Screening estimate from a state-policy table — verify with the county assessor before closing.
Climate risk First Street
- Flood 1/10 Low FEMA zone X (unshaded) · 0% chance over 30 yrs
- Wildfire 5/10 Major
- Heat 3/10 Moderate 7 d/yr ≥104°F today · 18 d/yr by 30 yrs out
- Wind 2/10 Low 100% chance of damaging wind over 30 yrs
- Air quality 2/10 Low 1 unhealthy d/yr today · 1 by 30 yrs out
Nearby sold comps map
Loading sold comps map…
Walkable amenities ~0.75 mi
Loading nearby amenities…
Taxation est. · year 1
- Rental income
- $14,870
- − Mortgage interest
- −$5,036
- − Property taxes
- −$1,811
- − Insurance
- −$450
- − Repairs & maintenance
- −$1,190
- − Management
- −$1,190
- − Depreciation
- −$2,615
- Taxable income
- $2,579
- Est. tax owed @ 24.0%
- −$619
- After-tax cash flow
- $3,211/yr
For passive investors: Depreciation is non-cash, so a rental often shows a tax loss while cash-flowing — sheltering income. Rental losses are passive: they offset passive income freely, and up to $25,000/yr can offset ordinary (W-2) income if you actively participate and your MAGI is under $100k (phasing out to $0 by $150k); unused losses carry forward. On sale, claimed depreciation is recaptured at up to 25%, and gains may owe capital-gains tax (a 1031 exchange can defer both). Figures are a year-1 estimate at your 24.0% rate — not tax advice; consult a CPA.
Schools (NCES district)
- District
- Bismarck Henning CUSD
- NCES district ID
- 1706390
- Math proficiency
- 21% ▼ -7.00%
- Reading proficiency
- 30% ▼ -18.00%
- Median HH income
- $61,494
- Composite
- 23.54/100
- National rank
- #7862
- State rank
- #287 of 620 in IL
Livability — Bismarck
- Score
- 62/100
- State rank
- #844
- US rank
- #16640
Category grades
Schools grade is shown separately in the Schools card above.
Census & demographics
- Census place
- Bismarck, IL
- Population (ZIP)
- 1,207
Population outlook (Vermilion County) Hauer SSP2
- Today (2025)
- 72,775 people
- By 2030
- 69,235 · -4.9%
- By 2040
- 62,360 · -14.3%
- By 2050
- 55,539 · -23.7%
- By 2075
- 40,606 · -44.2%
- By 2100
- 26,985 · -62.9%
Race, ethnicity, and origin ACS 2023
- Neighborhood character
- Predominantly White (97%)
- Race & ethnicity
- White 97% Two or more races 2%
- Common ancestry
- Lithuanian 4% Iranian 2% Scotch-Irish 1%
Political lean MEDSL · Vermilion
- 2024 margin
- Solid R (+35.7) · D 31.4% · R 67.0% · Other 1.6%
- 2008→2024 swing
- -36.2pp toward R · 2008: 0.6pp · 2024: -35.7pp
- All cycles
- 2024: R+35.7 2020: R+32.9 2016: R+29.2 2012: R+15.7 2008: D+0.6
Not yet ingested
- Civics
- —
Market trends
- HPI YoY
- ▲ 3.08%
- Current HPI
- 137.9851
- Rent YoY
- —
- Metro
- —
- State GDP YoY
- ▲ 1.59%
- F500 in state
- 60
Industry mix (Fortune 500 HQ in IL)
| Industry | F500 HQs | Revenue |
|---|---|---|
| Insurance | 4 | $201B |
|
||
| Consumer Goods | 4 | $87B |
|
||
| Industrial Machinery | 3 | $64B |
|
||
| Healthcare | 2 | $55B |
|
||
| Retail / Pharmacy | 1 | $148B |
|
||
| Agriculture / Food | 1 | $86B |
|
||
Price history
+259.6% since first listed4 events — show timeline
- 2025-11-20 Price Changed $89,900 CIBR
- 2025-05-01 Price Changed $117,000 CIBR
- 2024-09-26 Listed $119,000 CIBR
- 2002-07-29 Sold (Public Records) $25,000 Public Records
Property tax history
+2.6%/yrLatest (2024): $1,811 · +5.0% YoY. Source: county tax records.
Cash-flow waterfall
monthlySold comps — $/sqft
last 12 mo · ≤1 miLoading sold comps…