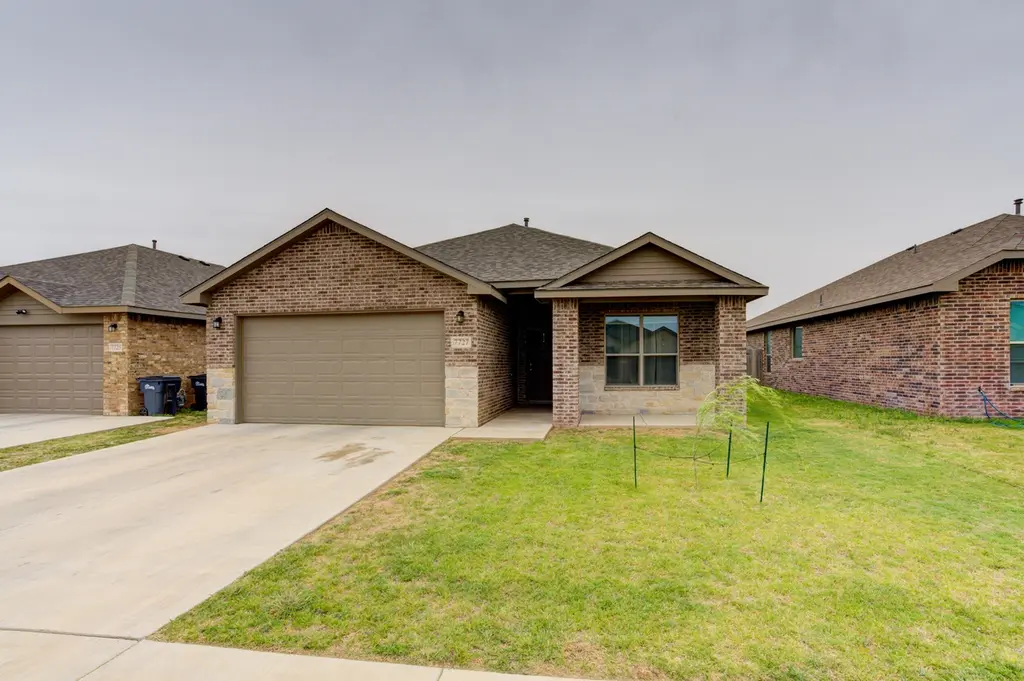
7727 96th St · Lubbock, TX
Flood risk 1/10 · Minimal
- FEMA flood zone
- X (unshaded)
- Chance of flooding over 30 yrs
- 0.0%
- Est. flood insurance / yr
- $507 – $1,088
Fire risk 6/10 · Moderate
- Est. fire insurance / yr
- $1,222 – $2,270
Heat risk 5/10 · Moderate
- Hot days now (above 99°F)
- 7 days/yr
- Hot days in 30 yrs
- 21 days/yr
Wind risk 2/10 · Minimal
- Chance of severe wind over 30 yrs
- 2.0%
Air-quality risk 2/10 · Minimal
- Unhealthy air days now
- 1 days/yr
- Unhealthy air days in 30 yrs
- 1 days/yr
Risk factors via First Street. Map © Google.
Why this score? — see what drove the D grade
The composite is a weighted blend of 9 inputs, each scored 0–100. Each bar is that input's sub-score; the figure is the points it added to the 100-point composite (weight × sub-score).
- ARV discount +12.2/15.0
- Cash flow +8.3/30.0
- Schools +4.4/10.0
- Livability +4.0/5.0
- Condition / age +4.0/5.0
- 1% rule +3.3/10.0
- Rent growth +3.2/5.0
- DSCR +2.3/10.0
- Appreciation +0.0/10.0
$237,500
🖨 Deal sheet (PDF) 📄 Offer letter ✓ Due diligence
Listing remarks
Bright and inviting, this 3-bedroom, 2-bath home offers an open floor plan designed for comfortable living and effortless entertaining. Natural light fills the spacious living and dining areas, creating a warm and welcoming atmosphere throughout. The primary suite is a true retreat, featuring a bathroom with his and hers closets for added convenience and storage, a relaxing soaking tub, separate shower, and double sinks--everything you need to unwind in style. Step outside to a large backyard complete with a covered porch, perfect for relaxing evenings or hosting gatherings. This home blends functionality and charm, ready for its next owner to enjoy!
Key facts
- Covered porch
- Open floor plan
- Soaking tub
Tags
Property features AI
Finance
- Other: Annual tax information available
Exterior
- Parking: Attached 2-car garage
- Home design: Single-family residence; Residential property
- Construction: Brick and stone construction; Composition roof; Slab foundation; Built with 1,702 above-grade finished area
- Exterior features: Private yard; Front porch; Privacy wood fencing; Paved road access; Publicly maintained road; City street frontage
Interior
- Kitchen: Disposal; Dishwasher; Electric cooktop; Electric oven; Microwave
- Bathrooms: 2 full bathrooms
- Heating & cooling: Central heating; Central air; Electric cooling; Ceiling fans
- Interior features: Breakfast bar; Ceiling fans; Granite counters; Kitchen island; Open floorplan
- Laundry & utility: Laundry room
Neighborhood map
What this means for you Summary
Snapshot
- This is a 3-bed/2.0-bath single-family listed at $238k. Condition is rated good.
Deal economics
- At list price, monthly cash flow is $-215 ($-3k/yr) — negative.
- To cash-flow at today's rent, offer at most $199k (16.0% below list).
- To meet the 1% rule (rent ≥ 1% of price), the offer needs to be $197k (16.9% below list).
- Recommended offer: $197k (16.9% below list) — sets the bar for 1% rule.
Location & tenants
- Location reads 80/100 on livability (#37 in TX, #1,749 nationally) — a professional / high-income tenant draw. Strengths: commute A+, cost of living A+, housing A+; Watch: employment C-, crime F.
- Frenship ISD (urban): math 47% / reading 54% proficiency, ranked #162 of 826 in TX (top 20%) — acceptable for families but not a draw, mixed tenant base, ~2y average lease.
- Zoned schools: Upland Heights El (math 49% / reading 55%, grade C-, #742 of 4,322 statewide, top 19%, 840 students, 46% FRL); Frenship Middle (math 46% / reading 50%, grade C-, #400 of 1,662 statewide, top 24%, 833 students, 47% FRL); Frenship H S (math 44% / reading 65%, grade C-, #379 of 1,632 statewide, top 26%, 3,247 students, 46% FRL).
- Market conditions: Rents rising (+2.8%/yr); 712 active listings in the ZIP; 40 comparable units currently listed for rent nearby; rentals at typical pace (median 23d on market — plan ~3-4 weeks tenant-placement turnaround); 45% of comp listings sitting > 30 days — soft ceiling on asking rent; solid renter incomes; 2,219 units permitted in Lubbock County in 2024 (252 in 5+ unit buildings).
Forward outlook
- Local home prices are declining (-3.0%/yr); year-one equity from $2k of loan paydown is wiped out by about $7k of value loss. Plan a longer hold.
- Lubbock County population projected at +39% by 2050 — long-run rental-demand tailwind backs the buy-and-hold thesis.
Negotiation context
- Only 9 days on market — expect competitive offers; lowballing is unlikely to land.
Risks & watch-outs
- Climate carrying-cost: major wildfire risk; extreme-heat days projected 7→21/yr by 2055 (HVAC capex compounding) — expect insurance premiums to compound above CPI over the hold.
Questions for the listing agent
- What do current leases actually rent for vs. the listed asking? Can we see a recent rent roll and the last 12 months of T-12 income?
- Is there a deadline driving the sale (1031 exchange, divorce, estate, relocation)? That informs how much negotiation room exists.
- Schools are D-rated, which usually means shorter tenancies and higher turnover. Who's the typical renter profile here, and what's been the actual vacancy rate?
- Crime grade is F in this area — have there been break-ins, vandalism, or insurance claims at this property in the last 3 years? What carrier currently insures it and at what premium?
- The area grade is low — what's the realistic commute time and amenity access for the typical tenant pool here? Any planned neighborhood developments (good or bad) we should know about?
- What's the average days-on-market for RENTAL listings here right now (not sales)? A rising rental-DOM trend means longer vacancies and softer asking-rent achievability than the comps imply.
- What's the recent tenant-quality profile in this submarket — average credit score on applications, eviction rate, late-payment / NSF rate, and stable-employment percentage? A property-management company in the area should have these aggregated.
- How much new for-sale + rental construction is in the pipeline within 1–3 miles? Heavy new supply typically softens prices + rents 12–24 months out; constrained supply supports both.
Investment metrics
- 1% rule
- 0.83% ✗
- Cap rate
- 5.20%
- Cash-on-cash
- -3.89%
- DSCR
- 0.83
- GRM
- 10.0
CMA / ARV
- ARV (median comp)
- $265,518
- List price
- $237,500
- Delta
- -7.73%
- Verdict
- FAIR
- Comps
- 1 within 2.0 mi
Projected returns pro-forma
-3.0% appreciation · 2.75% rent growth · sell at horizon
- IRR
- -23.1%
- Equity multiple
- 0.21×
- Total profit
- $-52,583
- Equity at exit
- $35,412
- IRR
- -18.2%
- Equity multiple
- 0.02×
- Total profit
- $-65,014
- Equity at exit
- $20,535
Cash invested: $66,500 (down + closing). Projections, not guarantees.
Landlord ↔ Tenant lean methodology
- Overall (STATE)
- 87 Strongly Landlord-Friendly
- State Texas
- 87 Strongly Landlord-Friendly · R+5
- County
- — inherits STATE
- City
- — inherits STATE
ZIP-level market 79424
- Rents YoY
- 2.8%
- Active inventory
- 712
- Price-to-rent
- 10.0×
Monthly cashflow live
- Estimated rent
- $1,975 high interval (Pro) →
- Mortgage (P&I)
- −$1,245
- Tax from tax record
- −$431 /mo · $5,170/yr
- Insurance
- −$99
- HOA
- −$0
- Vacancy / Maint / Mgmt
- −$415
- Net cashflow
- $-215
Break-even live
Sensitivity live
| Price | -10% $-81 | -5% $-148 | +0% $-215 | +5% $-283 | +10% $-350 |
|---|---|---|---|---|---|
| Rent | -10% $-371 | -5% $-293 | +0% $-215 | +5% $-137 | +10% $-59 |
| Rate | -1.0pp $-96 | -0.5pp $-155 | base $-215 | +0.5pp $-277 | +1.0pp $-339 |
UW: 25.0% down · 7.5% · 30yr · 1.5% tax · 5.0% vac · 8.0% maint · 8.0% mgmt
Financing live
Cash to close
- Down payment
- $59,375
- Closing costs
- $7,125
- Reserves months
- —
- Total cash needed
- —
Loan-product check · same deal, 3 products live
Conventional
25% down · 7.5% · 30yr
- Down + closing
- —
- Monthly P&I
- —
- Monthly cashflow
- —
- DSCR
- —
- Eligible?
- —
Personal DTI + credit; lowest rate.
DSCR
20% down · 8.5% · 30yr
- Down + closing
- —
- Monthly P&I
- —
- Monthly cashflow
- —
- DSCR
- —
- Eligible?
- —
No personal income docs; deal must DSCR.
Hard money
10% down · 12.0% · 12mo
- Down + closing
- —
- Monthly P&I
- —
- Monthly cashflow
- —
- DSCR
- —
- Eligible?
- —
Short-term bridge; refi at stabilization.
Rent comps 40 comps
| Address | Beds | Baths | Sqft | Rent | $/sqft | DOM | Units | Dist |
|---|---|---|---|---|---|---|---|---|
| 7729 96th St Lubbock, TX | 4.0 | 2.0 | 1978 | $2,300 | $1.16 | 15d | 1 | 0.03mi |
| 7731 97th St Lubbock, TX | 4.0 | 2.0 | 1888 | $2,075 | $1.10 | 23d | 1 | 0.03mi |
| 7732 96th St Lubbock, TX | 4.0 | 2.0 | 1888 | $2,075 | $1.10 | 23d | 1 | 0.06mi |
| 7805 96th St Lubbock, TX | 4.0 | 2.0 | 1888 | $2,150 | $1.14 | 45d | 1 | 0.09mi |
| 7811 96th St Lubbock, TX | 4.0 | 2.0 | 1946 | $2,195 | $1.13 | 23d | 1 | 0.12mi |
| 7729 92nd St Lubbock, TX | 4.0 | 3.0 | 1810 | $2,495 | $1.38 | 23d | 1 | 0.25mi |
| 7510 102nd St Lubbock, TX | 3.0 | 2.0 | 1503 | $1,600 | $1.06 | 45d | 1 | 0.39mi |
| 7456 104th St Lubbock, TX | 3.0 | 2.0 | 1460 | $1,700 | $1.16 | 45d | 1 | 0.56mi |
| 7350 100th St Lubbock, TX | 3.0 | 2.0 | 1400 | $1,650 | $1.18 | 45d | 1 | 0.57mi |
| 7449 104th St Lubbock, TX | 3.0 | 2.0 | 1481 | $1,625 | $1.10 | 23d | 1 | 0.61mi |
| 7440 104th St Lubbock, TX | 3.0 | 2.0 | 1578 | $1,600 | $1.01 | 15d | 1 | 0.62mi |
| 7424 104th St Lubbock, TX | 3.0 | 2.0 | 1598 | $1,750 | $1.10 | 45d | 1 | 0.68mi |
| 7811 86th St Lubbock, TX | 3.0 | 2.0 | 1710 | $2,025 | $1.18 | 23d | 1 | 0.68mi |
| 9702 Trenton Ave Lubbock, TX | 3.0 | 2.0 | 1350 | $1,499 | $1.11 | 45d | 1 | 0.91mi |
| 9712 Trenton Ave Lubbock, TX | 3.0 | 2.0 | 1350 | $1,499 | $1.11 | 23d | 1 | 0.91mi |
| 9716 Trenton Ave Lubbock, TX | 3.0 | 2.0 | 1300 | $1,499 | $1.15 | 45d | 1 | 0.91mi |
| 611 E 14th St Wolfforth, TX | 3.0 | 2.0 | 1299 | $1,725 | $1.33 | 45d | 1 | 0.93mi |
| 9705 Trenton Ave Lubbock, TX | 3.0 | 2.0 | 1350 | $1,499 | $1.11 | 23d | 1 | 0.93mi |
| 9711 Trenton Ave Lubbock, TX | 3.0 | 2.0 | 1267 | $1,499 | $1.18 | 45d | 1 | 0.93mi |
| 9709 Trenton Ave Lubbock, TX | 3.0 | 2.0 | 1350 | $1,499 | $1.11 | 45d | 1 | 0.93mi |
| 7051 96th St Unit A Lubbock, TX | 3.0 | 2.0 | 1500 | $1,450 | $0.97 | 15d | 1 | 0.94mi |
| 127 Brooke Blvd Wolfforth, TX | 3.0 | 2.5 | 1714 | $1,757 | $1.03 | 15d | 2 | 0.95mi |
| 9710 Saratoga Ave Unit B Lubbock, TX | 3.0 | 2.0 | 1350 | $1,450 | $1.07 | 23d | 1 | 0.96mi |
| 9707 Saratoga Ave Unit A Lubbock, TX | 3.0 | 2.0 | 1350 | $1,499 | $1.11 | 23d | 1 | 0.99mi |
| 1503 Good Prairie Ave Wolfforth, TX | 4.0 | 2.5 | 2173 | $2,450 | $1.13 | 23d | 1 | 1.01mi |
| 9706 Ross Ave Lubbock, TX | 3.0 | 2.0 | 1760 | $1,895 | $1.08 | 45d | 1 | 1.02mi |
| 1216 Donald Preston Dr Unit B Wolfforth, TX | 3.0 | 2.0 | 1450 | $1,400 | $0.97 | 45d | 1 | 1.04mi |
| 1224 Donald Preston Dr Unit B Wolfforth, TX | 3.0 | 2.0 | 1400 | $1,550 | $1.11 | 45d | 1 | 1.04mi |
| 1019 Donald Preston Dr Unit A Wolfforth, TX | 3.0 | 2.0 | 1400 | $1,275 | $0.91 | 23d | 1 | 1.10mi |
| 1019 Donald Preston Dr Unit A Wolfforth, TX | 3.0 | 2.0 | 1400 | $1,275 | $0.91 | 45d | 1 | 1.10mi |
| 1313 Corpus Ave Unit B Wolfforth, TX | 3.0 | 2.0 | 1550 | $1,850 | $1.19 | 15d | 1 | 1.14mi |
| 723 E 17th St Wolfforth, TX | 3.0 | 2.0 | 1670 | $1,800 | $1.08 | 45d | 1 | 1.16mi |
| 9304 Remington Ave Lubbock, TX | 3.0 | 2.0 | 1649 | $1,850 | $1.12 | 45d | 1 | 1.22mi |
| 132 Calvin Dr Wolfforth, TX | 4.0 | 2.0 | 1652 | $2,300 | $1.39 | 15d | 1 | 1.23mi |
| 1712 Corpus Ave Wolfforth, TX | 2.0 | 2.0 | 1335 | $1,375 | $1.03 | 45d | 1 | 1.28mi |
| 9309 Quitman Ave Lubbock, TX | 3.0 | 2.0 | 1577 | $1,575 | $1.00 | 23d | 1 | 1.31mi |
| 9305 Quitman Ave Lubbock, TX | 3.0 | 2.0 | 1560 | $1,650 | $1.06 | 23d | 1 | 1.31mi |
| 2008 Cottonwood Ave Wolfforth, TX | 3.0 | 2.0 | 1450 | $1,810 | $1.25 | 45d | 1 | 1.34mi |
| 9106 Quincy Ave Lubbock, TX | 3.0 | 2.0 | 1593 | $1,750 | $1.10 | 15d | 1 | 1.35mi |
| 9104 Quincy Ave Lubbock, TX | 3.0 | 2.0 | 1562 | $1,750 | $1.12 | 23d | 1 | 1.35mi |
Listing history 1 events
-
2026-04-30$245,000 Active 663-char remark
ⓘ Source: listings_history table (triggers on properties + properties_extension) + one-shot
backfill from property_details.listing_events for pre-trigger history.
Tax reassessment forecast TX · Resets to sale price
- Current annual tax
- $5,170 · $431/mo
- Projected year-2 tax
- $5,170 · $431/mo
- Expected delta
- $0/yr ($0/mo · 0.0%)
ⓘ Screening estimate from a state-policy table — verify with the county assessor before closing.
Climate risk First Street
- Flood 1/10 Low FEMA zone X (unshaded) · 0% chance over 30 yrs
- Wildfire 6/10 Major
- Heat 5/10 Major 7 d/yr ≥99°F today · 21 d/yr by 30 yrs out
- Wind 2/10 Low 2% chance of damaging wind over 30 yrs
- Air quality 2/10 Low 1 unhealthy d/yr today · 1 by 30 yrs out
Nearby sold comps map
Loading sold comps map…
Walkable amenities ~0.75 mi
Loading nearby amenities…
Taxation est. · year 1
- Rental income
- $23,695
- − Mortgage interest
- −$13,304
- − Property taxes
- −$5,170
- − Insurance
- −$1,188
- − Repairs & maintenance
- −$1,896
- − Management
- −$1,896
- − Depreciation
- −$6,909
- Taxable loss
- −$6,666
- Est. tax savings @ 24.0%
- +$1,600
- After-tax cash flow
- $-984/yr
For passive investors: Depreciation is non-cash, so a rental often shows a tax loss while cash-flowing — sheltering income. Rental losses are passive: they offset passive income freely, and up to $25,000/yr can offset ordinary (W-2) income if you actively participate and your MAGI is under $100k (phasing out to $0 by $150k); unused losses carry forward. On sale, claimed depreciation is recaptured at up to 25%, and gains may owe capital-gains tax (a 1031 exchange can defer both). Figures are a year-1 estimate at your 24.0% rate — not tax advice; consult a CPA.
Condition & rehab AI · 12 photos
This 3-bedroom, 2-bath home offers a good condition with a good rehab level, ready for a new owner to enjoy!
Value-add opportunities
- Both Paint exterior trim — Enhances curb appeal and value
- Both Clean gutters — Improves drainage and overall appearance
Renovation cost estimate screening
Value-add ROI direction
- Both Paint exterior trim — Enhances curb appeal and value ↑
- Both Clean gutters — Improves drainage and overall appearance ↑
ⓘ Cost ranges are severity-bucket heuristics (US national rule-of-thumb). Get contractor quotes + a written scope before underwriting a rehab budget.
Schools (NCES district)
- District
- Frenship ISD
- NCES district ID
- 4819830
- Math proficiency
- 47% ▼ -8.00%
- Reading proficiency
- 54% ▬ 0.00%
- Median HH income
- $54,376
- Composite
- 43.59/100
- National rank
- #2976
- State rank
- #162 of 826 in TX
Livability — Lubbock
- Score
- 80/100
- State rank
- #37
- US rank
- #1749
Category grades
Schools grade is shown separately in the Schools card above.
Census & demographics
- Census place
- Lubbock, TX
- County
- Lubbock County · 293,542 people
- City population
- 283,030
- Metro
- Lubbock, TX
- Population (ZIP)
- 53,478
- Household income
- $97,231
- Rent vs Own
- Severe rent burden
- 1958.0
Population outlook (Lubbock County) Hauer SSP2
- Today (2025)
- 345,960 people
- By 2030
- 371,449 · +7.4%
- By 2040
- 424,539 · +22.7%
- By 2050
- 481,150 · +39.1%
- By 2075
- 633,467 · +83.1%
- By 2100
- 746,853 · +115.9%
Race, ethnicity, and origin ACS 2023
- Neighborhood character
- Predominantly White (71%)
- Race & ethnicity
- White 71% Hispanic / Latino 21% Two or more races 12% Asian 3% Black 2%
- Hispanic origin (detail)
- Mexican 17%
- Common ancestry
- Slovak 2% Italian 2% Lithuanian 1%
- Foreign-born
- 6% · Canada, China
- Languages at home
- 88% English-only · Spanish 8% Chinese 1% Tagalog/Filipino 1%
Political lean MEDSL · Lubbock
- 2024 margin
- Solid R (+39.5) · D 29.7% · R 69.2% · Other 1.0%
- 2008→2024 swing
- -2.8pp toward R · 2008: -36.7pp · 2024: -39.5pp
- All cycles
- 2024: R+39.5 2020: R+32.2 2016: R+38.4 2012: R+40.9 2008: R+36.7
Not yet ingested
- Civics
- —
Market trends
- HPI YoY
- ▼ -146.64%
- Current HPI
- 213.2155
- Rent YoY
- ▲ 2.75%
- Metro
- Lubbock, TX
- State GDP YoY
- ▲ 3.95%
- F500 in state
- 110
Industry mix (Fortune 500 HQ in TX)
| Industry | F500 HQs | Revenue |
|---|---|---|
| Energy | 16 | $1,198B |
|
||
| Technology | 5 | $198B |
|
||
| Engineering / Construction | 4 | $72B |
|
||
| Energy Services | 3 | $60B |
|
||
| Utilities | 3 | $41B |
|
||
| Healthcare | 2 | $330B |
|
||
Price history
2 events — show timeline
- 2026-05-28 Pending — LARMLS
- 2026-05-19 Listed $237,500 LARMLS
Property tax history
+1.4%/yrLatest (2025): $5,170 · +2.9% YoY. Source: county tax records.
Cash-flow waterfall
monthlySold comps — $/sqft
last 12 mo · ≤1 miLoading sold comps…