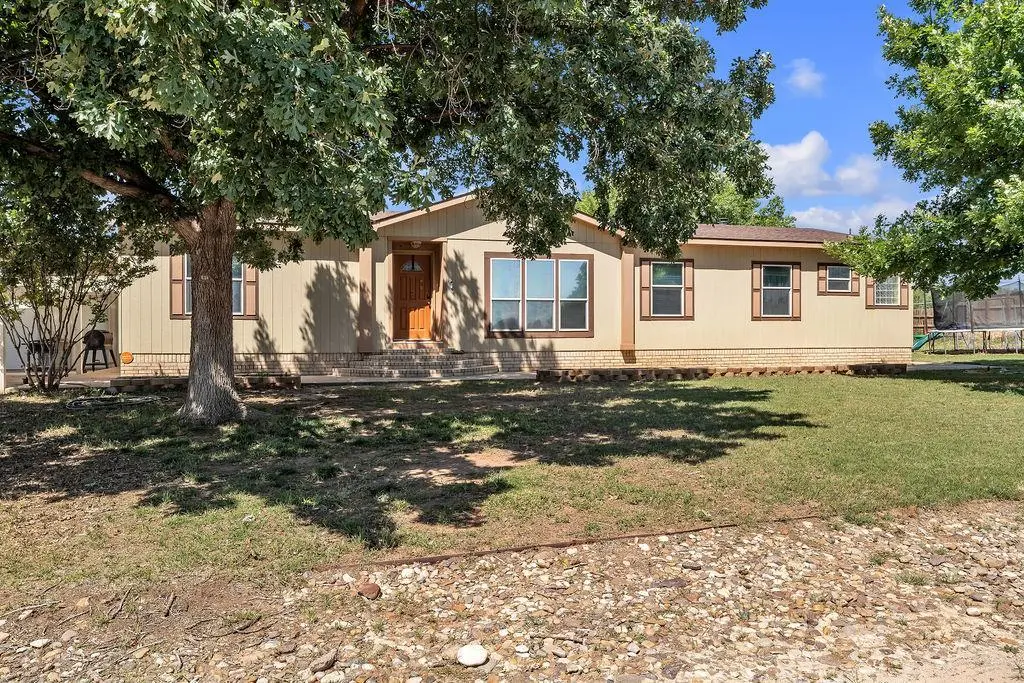
3212 S County Rd 1068 · Stanton, TX
Flood risk 1/10 · Minimal
- FEMA flood zone
- X
- Chance of flooding over 30 yrs
- 0.0%
- Est. flood insurance / yr
- $507 – $1,088
Fire risk 8/10 · Major
- Est. fire insurance / yr
- $1,222 – $2,270
Heat risk 6/10 · Moderate
- Hot days now (above 102°F)
- 7 days/yr
- Hot days in 30 yrs
- 20 days/yr
Wind risk 3/10 · Minor
- Chance of severe wind over 30 yrs
- 7.0%
Air-quality risk 1/10 · Minimal
- Unhealthy air days now
- 0 days/yr
- Unhealthy air days in 30 yrs
- 0 days/yr
Risk factors via First Street. Map © Google.
Why this score? — see what drove the D grade
The composite is a weighted blend of 9 inputs, each scored 0–100. Each bar is that input's sub-score; the figure is the points it added to the 100-point composite (weight × sub-score).
- Cash flow +12.9/30.0
- ARV discount +7.5/15.0
- Schools +4.1/10.0
- DSCR +3.8/10.0
- Livability +3.8/5.0
- Rent growth +3.2/5.0
- 1% rule +2.5/10.0
- Condition / age +2.5/5.0
- Appreciation +0.0/10.0
$365,000
🖨 Deal sheet 📄 Offer letter ✓ Due diligence
Listing remarks
Turn key and packed with upgrades in sought after Greenwood ISD, this 3 bed, 2 bath home is the one buyers wait for. Hardwood floors run throughout with ceramic tinted windows for comfort and efficiency. Major updates include a 4 year old HVAC, hot water heater less than a year old, plus dishwasher and sink replaced within 2 years. The backyard is made for summer with an above ground pool surrounded by rock landscaping, while the insulated shop with mini split is perfect for hobbies, workouts, or entertaining.
Key facts
- Rock landscaping
- Above ground pool
- Insulated shop
Tags
Property features AI
Exterior
- Parking: Detached carport (2 spaces)
- Utilities: Private well water; Septic tank
- Home design: Manufactured single-family home; Single-story
- Construction: Composition roof
- Exterior features: Covered patio/porch; Above-ground private pool; Workshop
Interior
- Kitchen: Dishwasher; Microwave; Electric range; Refrigerator
- Flooring: Carpet; Hardwood
- Bathrooms: 2 full bathrooms
- Heating & cooling: Central heating (electric); Central air
- Interior features: Pantry; Wood-burning fireplace; Ceiling fan(s); Security system; Smoke detector(s)
- Laundry & utility: Electric water heater
Neighborhood map
What this means for you Summary
Snapshot
- This is a 3-bed/2.0-bath manufactured listed at $365k.
Deal economics
- At list price, monthly cash flow is $-30 ($-359/yr) — negative.
- To cash-flow at today's rent, offer at most $360k (1.4% below list).
- To meet the 1% rule (rent ≥ 1% of price), the offer needs to be $273k (25.1% below list).
- Recommended offer: $273k (25.1% below list) — sets the bar for 1% rule.
Location & tenants
- Location reads 75/100 on livability (#140 in TX, #4,008 nationally) — a middle-class / working-renter tenant base. Strengths: cost of living A+, housing A+, health & safety A+; Watch: amenities F, commute F.
- Greenwood ISD (rural): math 45% / reading 44% proficiency, ranked #220 of 826 in TX (top 27%) — families likely to look elsewhere, expect single-tenant / working-renter base with shorter leases.
- Zoned schools: Greenwood El (795 students, 45% FRL); Greenwood H S (math 51% / reading 53%, grade D+, #447 of 1,632 statewide, top 29%, 808 students, 33% FRL).
- Market conditions: Rents rising (+2.8%/yr); 379 active listings in the ZIP; 9 comparable units currently listed for rent nearby; rentals lingering (median 44d on market — plan ~5-8 weeks vacancy on turnover, expect pricing pressure); 78% of comp listings sitting > 30 days — soft ceiling on asking rent; solid renter incomes; 1,504 units permitted in Midland County in 2024 (0 in 5+ unit buildings).
- This rent runs 30% of the median local income ($108k/yr) — at the standard rent-burdened threshold; future hikes will face affordability resistance.
Forward outlook
- Local home prices are declining (-3.0%/yr); year-one equity from $3k of loan paydown is wiped out by about $11k of value loss. Plan a longer hold.
- Midland County population projected at +83% by 2050 — long-run rental-demand tailwind backs the buy-and-hold thesis.
Negotiation context
- It's been on market 34 days — a 3% lower offer ($354k) is reasonable based on typical stale-listing flexibility.
Risks & watch-outs
- Climate carrying-cost: severe wildfire risk; extreme-heat days projected 7→20/yr by 2055 (HVAC capex compounding) — expect insurance premiums to compound above CPI over the hold.
Questions for the listing agent
- What do current leases actually rent for vs. the listed asking? Can we see a recent rent roll and the last 12 months of T-12 income?
- It's been on market 34 days. Have you received any prior offers? Is the seller open to a 25% concession, seller financing, or rate buy-down credit?
- Is there a deadline driving the sale (1031 exchange, divorce, estate, relocation)? That informs how much negotiation room exists.
- Schools are D-rated, which usually means shorter tenancies and higher turnover. Who's the typical renter profile here, and what's been the actual vacancy rate?
- The area grade is low — what's the realistic commute time and amenity access for the typical tenant pool here? Any planned neighborhood developments (good or bad) we should know about?
- What's the average days-on-market for RENTAL listings here right now (not sales)? A rising rental-DOM trend means longer vacancies and softer asking-rent achievability than the comps imply.
- What's the recent tenant-quality profile in this submarket — average credit score on applications, eviction rate, late-payment / NSF rate, and stable-employment percentage? A property-management company in the area should have these aggregated.
- How much new for-sale + rental construction is in the pipeline within 1–3 miles? Heavy new supply typically softens prices + rents 12–24 months out; constrained supply supports both.
Investment metrics
- 1% rule
- 0.75% ✗
- Cap rate
- 6.19%
- Cash-on-cash
- -0.35%
- DSCR
- 0.98
- GRM
- 11.1
CMA / ARV
No comps found within radius.
Projected returns pro-forma
-3.0% appreciation · 2.75% rent growth · sell at horizon
- IRR
- -17.2%
- Equity multiple
- 0.39×
- Total profit
- $-61,901
- Equity at exit
- $54,423
- IRR
- -9.6%
- Equity multiple
- 0.41×
- Total profit
- $-59,822
- Equity at exit
- $31,559
Cash invested: $102,200 (down + closing). Projections, not guarantees.
Landlord ↔ Tenant lean methodology
- Overall (STATE)
- 87 Strongly Landlord-Friendly
- State Texas
- 87 Strongly Landlord-Friendly · R+5
- County
- — inherits STATE
- City
- — inherits STATE
ZIP-level market 79706
- Rents YoY
- 2.8%
- Active inventory
- 379
- Price-to-rent
- 11.1×
Monthly cashflow live
- Estimated rent
- $2,733 high interval (Pro) →
- Mortgage (P&I)
- −$1,914
- Tax from tax record
- −$123 /mo · $1,475/yr
- Insurance
- −$152
- HOA
- −$0
- Vacancy / Maint / Mgmt
- −$574
- Net cashflow
- $-30
Break-even live
UW: 25.0% down · 7.5% · 30yr · 1.5% tax · 5.0% vac · 8.0% maint · 8.0% mgmt
Financing live
Cash to close
- Down payment
- $91,250
- Closing costs
- $10,950
- Reserves months
- —
- Total cash needed
- —
Loan-product check · same deal, 3 products live
Conventional
25% down · 7.5% · 30yr
- Down + closing
- —
- Monthly P&I
- —
- Monthly cashflow
- —
- DSCR
- —
- Eligible?
- —
Personal DTI + credit; lowest rate.
DSCR
20% down · 8.5% · 30yr
- Down + closing
- —
- Monthly P&I
- —
- Monthly cashflow
- —
- DSCR
- —
- Eligible?
- —
No personal income docs; deal must DSCR.
Hard money
10% down · 12.0% · 12mo
- Down + closing
- —
- Monthly P&I
- —
- Monthly cashflow
- —
- DSCR
- —
- Eligible?
- —
Short-term bridge; refi at stabilization.
Rent comps 9 comps
| Address | Beds | Baths | Sqft | Rent | $/sqft | DOM | Units | Dist |
|---|---|---|---|---|---|---|---|---|
| 8425 E County Road 110 Midland, TX | 3.0 | 2.0 | 1616 | $3,070 | $1.90 | 43d | 1 | 1.15mi |
| 8513 E County Road 110 Midland, TX | 3.0 | 2.0 | 1616 | $3,070 | $1.90 | 43d | 1 | 1.15mi |
| 8433 E County Road 110 Midland, TX | 3.0 | 2.0 | 1500 | $2,850 | $1.90 | 43d | 1 | 1.15mi |
| 8605 E County Road 110 Midland, TX | 3.0 | 2.0 | 1500 | $2,850 | $1.90 | 43d | 1 | 1.15mi |
| 8603 E County Road 110 Midland, TX | 3.0 | 2.0 | 1500 | $2,850 | $1.90 | 43d | 1 | 1.15mi |
| 8515 E County Road 110 Midland, TX | 3.0 | 2.0 | 1500 | $2,850 | $1.90 | 43d | 1 | 1.15mi |
| 8505 E County Road 110 Midland, TX | 3.0 | 2.0 | 1500 | $2,850 | $1.90 | 43d | 1 | 1.15mi |
| 8513 E County Road 110 Midland, TX | 3.0 | 2.0 | 1616 | $2,250 | $1.39 | 21d | 1 | 1.15mi |
| 8425 E County Road 110 Midland, TX | 3.0 | 2.0 | 1616 | $2,250 | $1.39 | 21d | 1 | 1.15mi |
Listing history 17 events
-
2026-06-19days on market $365,000 Active 34 DOM
-
2026-06-18days on market $365,000 Active 33 DOM
-
2026-06-17days on market $365,000 Active 32 DOM
-
2026-06-16days on market $365,000 Active 31 DOM
-
2026-06-15days on market $365,000 Active 30 DOM
-
2026-06-14days on market $365,000 Active 28 DOM
-
2026-06-13days on market $365,000 Active 27 DOM
-
2026-06-10pricedays on market $365,000 Active 25 DOM
-
2026-06-09days on market $370,000 Active 24 DOM
-
2026-06-08days on market $370,000 Active 23 DOM
-
2026-06-07days on market $370,000 Active 22 DOM
-
2026-06-02days on market $370,000 Active 17 DOM
-
2026-06-01days on market $370,000 Active 16 DOM
-
2026-05-31days on market $370,000 Active 15 DOM
-
2026-05-30days on market $370,000 Active 14 DOM
-
2026-05-16$380,000 Active
-
2004-05-19soldstatus
ⓘ Source: listings_history table (triggers on properties + properties_extension) + one-shot
backfill from property_details.listing_events for pre-trigger history.
Tax reassessment forecast TX · Resets to sale price
- Current annual tax
- $1,475 · $123/mo
- Projected year-2 tax
- $6,680 · $557/mo
- Expected delta
- +$5,204/yr (+$434/mo · 352.8%)
ⓘ Screening estimate from a state-policy table — verify with the county assessor before closing.
Climate risk First Street
- Flood 1/10 Low FEMA zone X · 0% chance over 30 yrs
- Wildfire 8/10 Severe
- Heat 6/10 Major 7 d/yr ≥102°F today · 20 d/yr by 30 yrs out
- Wind 3/10 Moderate 7% chance of damaging wind over 30 yrs
- Air quality 1/10 Low 0 unhealthy d/yr today · 0 by 30 yrs out
Nearby sold comps map
Loading sold comps map…
Walkable amenities ~0.75 mi
Loading nearby amenities…
Taxation est. · year 1
- Rental income
- $32,798
- − Mortgage interest
- −$20,446
- − Property taxes
- −$1,475
- − Insurance
- −$1,825
- − Repairs & maintenance
- −$2,624
- − Management
- −$2,624
- − Depreciation
- −$10,618
- Taxable loss
- −$6,814
- Est. tax savings @ 24.0%
- +$1,635
- After-tax cash flow
- $1,276/yr
For passive investors: Depreciation is non-cash, so a rental often shows a tax loss while cash-flowing — sheltering income. Rental losses are passive: they offset passive income freely, and up to $25,000/yr can offset ordinary (W-2) income if you actively participate and your MAGI is under $100k (phasing out to $0 by $150k); unused losses carry forward. On sale, claimed depreciation is recaptured at up to 25%, and gains may owe capital-gains tax (a 1031 exchange can defer both). Figures are a year-1 estimate at your 24.0% rate — not tax advice; consult a CPA.
Schools (NCES district)
- District
- Greenwood ISD
- NCES district ID
- 4821750
- Math proficiency
- 45% ▲ 4.00%
- Reading proficiency
- 44% ▲ 1.00%
- Median HH income
- $74,012
- Composite
- 40.54/100
- National rank
- #3701
- State rank
- #220 of 826 in TX
Livability — Stanton
- Score
- 75/100
- State rank
- #140
- US rank
- #4008
Category grades
Schools grade is shown separately in the Schools card above.
Census & demographics
- County
- Midland County · 168,494 people
- Metro
- Midland, TX
- Population (ZIP)
- 34,281
- Household income
- $108,059
- Rent vs Own
- Severe rent burden
- 303.0
Population outlook (Midland County) Hauer SSP2
- Today (2025)
- 220,895 people
- By 2030
- 253,667 · +14.8%
- By 2040
- 325,498 · +47.4%
- By 2050
- 404,168 · +83.0%
- By 2075
- 609,802 · +176.1%
- By 2100
- 760,172 · +244.1%
Race, ethnicity, and origin ACS 2023
- Neighborhood character
- Diverse neighborhood (Simpson 0.58)
- Race & ethnicity
- Hispanic / Latino 48% White 44% Two or more races 13% Black 3% Asian 2%
- Hispanic origin (detail)
- Mexican 43% Cuban 1%
- Common ancestry
- Italian 1% Lithuanian 1% Swedish 1%
- Foreign-born
- 11% · Canada
- Languages at home
- 68% English-only · Spanish 30%
Political lean MEDSL · Midland
- 2024 margin
- Solid R (+60.5) · D 19.3% · R 79.8%
- 2008→2024 swing
- -3.3pp toward R · 2008: -57.3pp · 2024: -60.5pp
- All cycles
- 2024: R+60.5 2020: R+56.6 2016: R+55.2 2012: R+61.5 2008: R+57.3
Not yet ingested
- Civics
- —
Market trends
- HPI YoY
- ▼ -173.42%
- Current HPI
- 212.6467
- Rent YoY
- ▲ 2.75%
- Metro
- Midland, TX
- State GDP YoY
- ▲ 3.95%
- F500 in state
- 110
Industry mix (Fortune 500 HQ in TX)
| Industry | F500 HQs | Revenue |
|---|---|---|
| Energy | 16 | $1,198B |
|
||
| Technology | 5 | $198B |
|
||
| Engineering / Construction | 4 | $72B |
|
||
| Energy Services | 3 | $60B |
|
||
| Utilities | 3 | $41B |
|
||
| Healthcare | 2 | $330B |
|
||
Price history
2 events — show timeline
- 2026-05-16 Listed $380,000 PBBOR
- 2004-05-19 Sold (Public Records) — Public Records
Property tax history
+11.4%/yrLatest (2025): $1,475 · -4.8% YoY. Source: county tax records.
Cash-flow waterfall
monthlySold comps — $/sqft
last 12 mo · ≤1 miLoading sold comps…